Journal of Environmental Protection
Vol. 3 No. 3 (2012) , Article ID: 17943 , 8 pages DOI:10.4236/jep.2012.33036
Performance Assessment of Received and Formulated Carbon Animalis: A Comparative Adsorption Isotherm Test
![]()
1Department of Applied Chemistry, Kebbi State University of Science and Technology, Aliero, Nigeria; 2Basic Science Unit, Nasarawa State University Keffi, Shabu-Lafia Campus, Keffi, Nigeria; 3Department of Chemistry, Benue State University, Makurdi, Nigeria; 4Department of Chemistry, Ahmadu Bello University, Zaria, Nigeria.
Email: *itodoson2002@gmail.com
Received October 7th, 2011; revised November 17th, 2011; accepted December 18th, 2011
Keywords: Methyl red; Dye; Activated Carbon; Adsorption Isotherm; Carbon Animalis
ABSTRACT
With the stated advantages of finer adsorbent of high surface area, why then do manufacturers design unspecified active carbons of granular size even for the removal of medium size particles? This research attempt to provide one of such answers. A batch equilibrium adsorption study was carried out to assess the adsorption capacity and intensities of methyl red dye onto “Received” Granular Activated Carbon (GAC) and “formulated” Powdered Activated Carbon (PAC). The equilibrium data obtained were modeled using the Langmuir and Freundlich Isotherms. The data fitted best with the Langmuir model which was predicted by the highest R2 value (0.981). The experiment carried out demonstrated that GAC had a higher adsorption efficiency range of 33.4% to 93.55% and a high adsorption capacity of 1.176 mg/g. Generally, the research ascertained the reason why the manufacturer supplied the chosen adsorbent as “granulated particulate” instead of “powdered” as formulated for the purpose of this research.
1. Introduction
Modern environmental legislation is becoming much more internally coherent and less prescriptive and focused on preventing of pollution through control of hazardous materials and processes. Commercial reactive azo dyes are internationally designed to resist biodegradation i.e. Dyes are synthetic aromatic water soluble and dispersible organic compounds, which cause coloration of natural water bodies when released into the environment. They affect the aquatic fauna and flora by reducing light transmission through water surface and in some cases may be toxic to the aquatic biota due to the presence of aromatics, metals, chlorides etc. Dyes usually have complex aromatic molecular structures, which make them more stable and more difficult to biodegrade [1].
This colour impede light transmission and penetration into streams, thereby reducing photosynthetic action. Dye upsets the biological activities in water and poses problem along the food chain due to their mutagenic and carcinogenic effects [2].
The textile dying industries consumes large quantities of water and produces large volumes of waste water from different steps in the dying and finishing process, effluent derived from the textile activities can provoke serious environmental impact [3].
Traditional waste water treatment technologies have proven to be ineffective for handling the effluent containing synthetic dyes because of the chemical stability of these pollutants. In comparison With conventional process such as coagulation, flocculation, and biological method, adsorption has proved to be more versatile and efficient method.
Azo dye are compounds containing the group -N=Nwhich are linked to sp2 hybridized carbon atoms. Their major advantages are superior wet fatness properties and high brightness of colours especially for mono-azo dyes and dull colours for more substantive dyes for those containing two or more azo group an example of an azo dye is “Methyl Red”. Methyl red (Molecular formular-C15H15N3O2; Molar mass, 2.69.3 g/mol) also called C.I. Acid Red 2, is an indicator dye that turns red in acidic solution. It is an azo dye and is a dark red crystalline powder [4]. Azo dyes are the largest and most versatile class of dyes and are commonly used to dye various materials such as textiles, leathers, plastics, cosmetics and food [5]. The degradation of azo dyes produces aromatic amines which are carcinogenic and mutagenic [6].
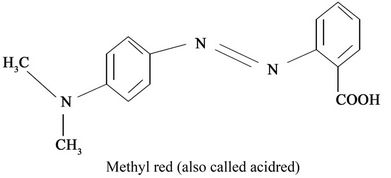
Structure of Methyl Red; IUPAC Name: 1-[Cp-pphenylazo)phenyl]Azo]-2-nephthen.
Activated carbon (powdered and Granular activated carbon) are mostly widely used adsorbents because it has excellent adsorption efficiency for organic compounds (e.g., Dye) [7]. Since commercially available activated carbon is very expensive, new findings and research is focusing on the use of low cost adsorbent derived from agricultural and wood wastes such as Bagasse, Coirpith, Banana pith. Others include Coconut shell, maize cob orange peels lemon, jackfruits peels [8]
The adsorption process is one the most effective methods for removal of dye from waste effluent .The process of adsorption has an edge over the other method due to its sludge free clean operation and completely removed dyes, even from diluted solutions [7].
1.1. Adsorption
Adsorption is the adhesion of a chemical substance (adsorbate) onto the surface of a solid (adsorbent). It is a surface phenomenon, thus extent of adsorption is proportional to specific surface area. Specific surface area is that portion of the total surface that is available for adsorption. The amount of adsorption accomplished per unit weight for a solid adsorbent is greater the more finely divided and the more porous the solid [9].
1.2. Adsorption Isotherms
The analysis of the adsoption equilibrium data by fitting them into different isothermal model is an important step to find the suitable model that can be used for definite purposes. Isotherm are empirical relationship used to predict how much solute can be adsorbed by activated carbon. Adsorption isotherm was defined as a graphical representation showing the relationship between the amount adsorbed by a unit weight of adsorbent (e.g. activated carbon) and the amount of adsorbate remaining in a test medium at equilibrium. It maps the distribution of adsorbable solute between the liquid and solid phases at various equilibrium concentration [10].
1.3. Langmuir Isotherm
This is the simplest theoretical model that can be used to described monolayer adsorption. The Langmuir equation is based on a kinetic approach and assumes a uniform surface, a single layer of adsorbed material and constant temperature. The model is useful when there is a strong specific interaction between the surface and the adsorbate so that a single adsorbed layer forms and no multi-layer adsorption occur. The rate of attachment to the surface should be proportional to a driving force multiplied by area. The driving force is the concentration in the fluid, and the area is the amount of bare surface [10].
The theoretical concept behind the Langmuir isotherm is as summarized below:
The adsorption is an equilibrium process
- The adsorption cannot proceed beyond monolayer coverage
- All sites are equivalent and the surface is uniform i.e. the surface is perfectly flat on a microscopic scale.
According to the Langmuir equation; adsorption is modeled as the equation [3,11]
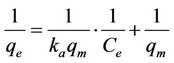 (1)
(1)
A plot of  against
  gave the slope,
  and intercept,
 .
.
The essential characteristic of the Langmuir isotherm can be expressed in term of a dimensionless equilibrium parameter (RL) defined as a dimensionless equilibrium parameter [12]
 (2)
(2)
where RL is the magnitude that determine the feasibility of the adsorption process. Ka = Langmuir constant related to energy of adsorption. Co is the highest initial dye concentration in the series of concentrations. RL = 1 shows linear Langmuir adsorption, RL >1 and <1 are unfavourable and favourable adsorption respectively while adsorption is irreversible when RL = 0.
1.4. Freundlich Isotherm
In environmental engineering and specifically drinking water treatment application, the most commonly used isotherm is the Freundlich isotherm equation. The Freundlich model is an empirical equation based on the distribution of solute between the solid phase and aqueous phase at equilibrium [10,11]. The basic equation is linearized as
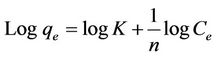 (3)
(3)
for a plot of the equation, 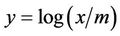 ,
,  , slope =
  and intercept =
 .
.
It is an empirical equation, with no basis in theory, which assumes an exponential variation in site energies [10]. Also assumed is that surface adsorption is not the rate limiting step. The model’s coefficient (n and k) must be found by analysis of the specific system at a number of equilibrium concentrations.
- A large  indicate larger change in effectiveness over different equilibrium concentrations;
- When  > 1.0 the change in adsorbed concentration is greater than the change in the solute concentration. Once the coefficient have been determined,
  can be calculated for all concentrations. Generally, a carbon that has a higher
  value at a specified equilibrium concentration will be preferred for a given application [10].
The values of Kf, the binding constant and n, the exponent, are shown the values of Kf and n determine the steepness and curvature of the isotherm [13].
The values of , less than unity is an indication that significant adsorption takes place at low concentration but the increase in the amount adsorbed with concentration becomes less significant at higher concentrations and vice verse. The higher the Kf value, the greater the adsorption intensity [13].
Water is one of the most important natural resources upon which all life depends. Indiscriminate use and misuse of water is making it unfit for human consumption. A recent survey revealed that 90% of water is a major challenge in future years to come. Hence an attempt has been made in this present work to simulate dyestuff effluent with Methyl red (as adsorbate) assess the performance of commercially available received (GAC) and formulated (PAC) animal charcoal (carbon animalis). This work is aimed at carrying out adsorption studies via Isothermal modeling for methyl red uptake from the simulated dyestuff effluent and as a complement to a previously designed rate study on the same effluent [14].
2. Materials and Methods
The current study is the part of a chain Graduate project on product verification carried out at Kebbi state University of Science and technology, Aliero, Nigeria from 2010 to date.
Commercially available activated carbon (charcoal powder) was procured from Pharmacos limited southermedon-se, Gssex coj land. The commercially available Granular activated carbon, GAC (Received) is of relatively large particle size >0.02 mm aperture and grounded with mortar and pestle into a smaller size and sieved with a <0.02 mm mesh sieve. This was considered as powdered activated carbon, PAC (Formulated). Therefore two samples were deduced viz; Powdered Activated Carbon (PAC or Received) and Granular Activated Carbon (GAC or Formulated).
The methyl red dye (C15H15N2O3, Molecular weight = 269.31 g/mol) was obtained from a local shop in Kaduna State. An accurate weighted quantity (1 g) of methyl red dye was dissolved with distilled water into a 100 mls volumetric flask and made up to the mark with distilled water. From this solution working experimental solutions of desired concentration 10 ppm, 20 ppm, 30 ppm, 40 ppm, 50 ppm and 60 ppm were prepared by serial dilution using.
Batch Adsorption Experiment
Batch adsorption experiment was carried out in a 250 ml conical flask. 0.1 g of adsorbent (PAC and GAC) was separately mixed with 10 cm3 of 10 ppm, 20 ppm, 30 ppm, 40 ppm, 50 ppm and 60 ppm dye concentrations. This was kept in separate flasks and allowed to interact for 30 min contact time using a mechanical shaker. Each mixture was filtered using filter paper and the absorbance of filtrate was taken using a SUR GISPIC spectrophotometer (Model No SM7525 UV) at a predetermined wavelength of 617 nm.
pH, conductivity of the effluent and filtrate was measured as does the bulk density using methods described elsewhere [9]. Results were presented as mean values of triplicate analysis.
The result from the spectrophotometer was converted from absorbance value to find the final concentration of the solution by using standard curve for Methyl Red. Therefore the percentage of extraction also referred to as percentage removal can be calculated using the equation below [15].
 (4)
(4)
while the amount of solute removal at equilibrium is given as [14,16,17]
 (5)
(5)
where Co and Ci are the aqueous phase and equilibrium phase dye concentration in mg/L respectively. V is the volume of dyestuff (dm3) while W is the adsorbent mass (g).
3. Results and Discussion
3.1. Physicochemical Parameters
Table 1 revealed some physicochemical properties of the received (GAC) and formulated activated carbon (PAC). The fairly higher bulk density value presented by GAC (0.75 g/cm3) is an indication that the received carbon is denser. This implied that to occupy the same volume of column or reactor, more of GAC carbon bed is required than PAC. pH of both samples in their solution fell within neutrality. This is a measure of only little or no contamination while the low conductivity values (60.9 - 72.9 μs/cm) is an indication of only few ions in solution. This could be attributed to the nature of activating agents used during initial formulation.
3.2. Effect of Initial Dye Concentration
Tables 2 and 3 showed the effect of concentration on sorption process between dye solution and activated carbon. This study has shown that the efficiency of dye removal increases as the concentration of dye is increased. The increase in initial concentrations enhances the interaction between the dye molecule and the surface of the activated carbon. This fact is in accordance with the findings of Masrosemal et al., [18]. Increasing the initial dye concentration increases the number of collision between dye molecules and the adsorbent, which enhances the adsorption process.
Considering the percentage removal (RE) values in Tables 2 and 3, the adsorption efficiency of GAC increases from 33.4% to 93.55% as shown in Table 2. Figure 1 also showed that the percentage dye removal increases with increased initial dye concentration. That of PAC increases from 33.4% to 90.32% as shown in Table 3 and figure 1. Therefore the adsorption of dye stuff into GAC is said to be more efficient. On the contrary, Masrosemal et al., [18] reported that the adsorption efficiency of PAC is higher due to its surface area but GAC has shown a higher trend of adsorption in this study due to the fact that the activated carbon used was design to perform best as GAC of meso structure for medium sized adsorbate.
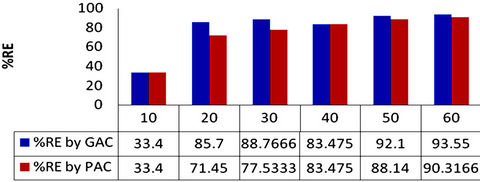
Figure 1. Percentage removal (%RE) of methyl red onto GAC and PAC.
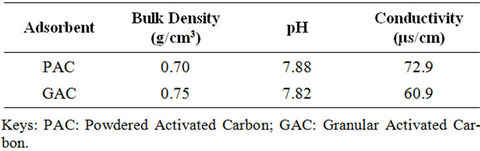
Table 1. Physicochemical parameters.
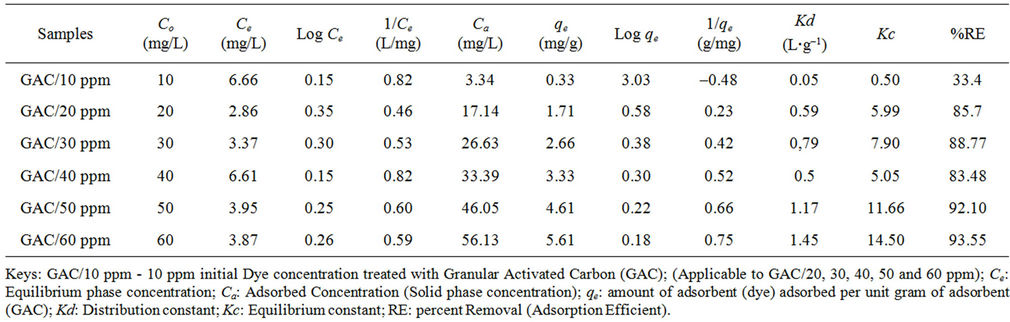
Table 2. Equilibrium experimental data of methyl red adsorption onto received granular activated carbon (GAC).
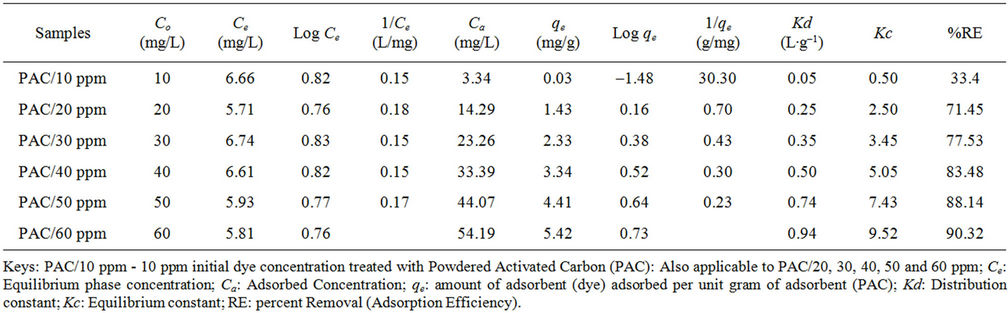
Table 3. Equilibrium experimental data of methyl red adsorption onto formulated powdered activated carbon (PAC).
3.3. Trend of Kd and Kc
Itodo, [9] defined the distribution equilibrium constant as a constant that implicitly indicate selectivity and affinity for the sorbate by the sorbent High values of distribution constant, Kd and equilibrium constant, Kc illustrate an enhancement rate of adsorption where as larger Kd and Kc values Illustrate better adsorption which is related to improved bonding between sorbate and sorbent particles between sorbate particles [19]. In Figure 2, the level of distribution with concentration is more linear than the extent of equilibration.
A higher value of Kc (Equilibrium constant), was recorded for adsorption of Methyl Red solution onto GAC (0.50 to 14.50 as shown in Table 2 and Figure 2) compared to the Kc values of PAC (0.50 to 9.52 such as in Table 3 and figure 3). The equilibrium constants presented as figure 3 is more linear with initial dye concentration than that of Figure GAC. Therefore, there is a more improved bonding between sorbate and sorbent particles for the PAC than GAC. A higher value of Kd (Distribution constant), was also recorded for adsorption of Methyl Red solution onto GAC (0.05 to 1.45 as in Table 2 and figure 2) as compared to that of PAC (0.05 to 0.94 as in Table 3 and Figure 3).
3.4. Isotherm Study (Surface Coverage)
Two adsorption isotherm models (Freundlich and Langmuir) were adopted for this study. The applicability of the best fit isotherm equation that described the adsorption process was predicted by regression coefficient, R2 values.
Figures 4-7 are Langmuir isotherms. In this study, two forms of Langmuir linearized isotherm models were adopted. The type i isotherms were presented as Figures 4 and 6 while the type ii isotherms were presented as Figures 5 and 7. For the received carbon (GAC), the equilibrium data is best modeled with the type i isotherm (with higher R2 value of 0.981) than the type ii isotherm (with lower R2 value of 0.951). The reversed is the case for PAC since its equilibrium data fitted well for Langmuir
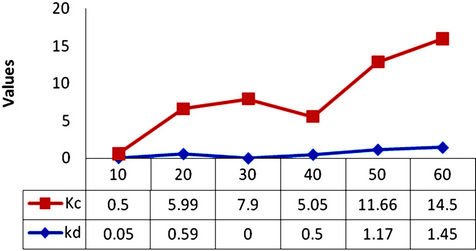
Figure 2. Distribution constant (Kd) and equilibrium constants (Kc) values for methyl red adsorption onto GAC.
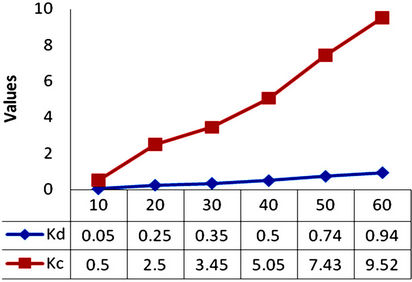
Figure 3. Distribution constant (Kd) and equilibrium constants (Kc) values for methyl red adsorption onto PAC.
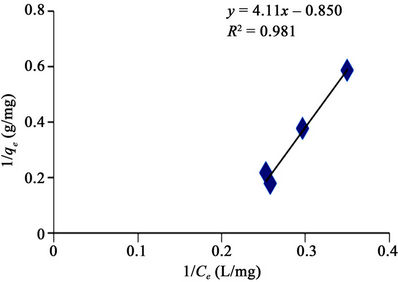
Figure 4. Langmuir adsorption isotherm of methyl red uptake onto granular activated carbon (GAC).
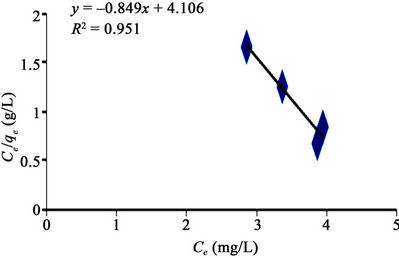
Figure 5. Langmuir adsorption isotherm type ii of methyl red uptake onto granular activated carbon (GAC).
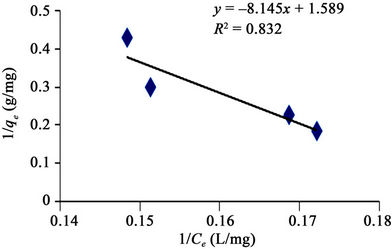
Figure 6. Langmuir adsorption isotherm of methyl red uptake onto powdered activated carbon (PAC).
isotherm type ii (R2 value of 0.869) as presented in figure 7.
Figure 8 made it evident that Freundlich isotherm goes well for GAC (R2 of 0.944) than it does for the PAC (R2 of 0.890) as revealed in Figure 9. It simply means that the level of heterogeneous adsorption experienced by GAC is higher. However, Plots of linear adsorption shown as Figures 10 and 11 presented a higher fitness for PAC than GAC.

Figure 7. Langmuir adsorption isotherm type ii of methyl red uptake onto powdered activated carbon (PAC).
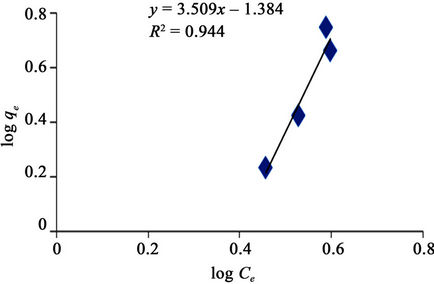
Figure 8. Freundlich adsorption isotherm of methyl red uptake onto granular activated carbon (GAC).
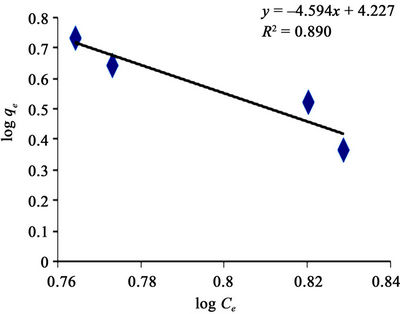
Figure 9. Freundlich adsorption isotherm of methyl red uptake onto powdered activated carbon (PAC).
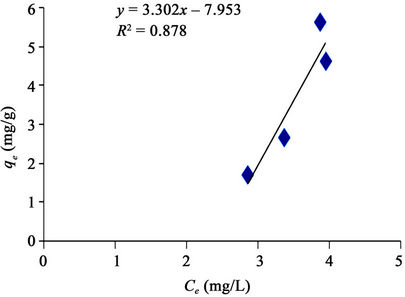
Figure 10. Linear adsorption isotherm of methyl red uptake onto granular activated carbon (GAC).
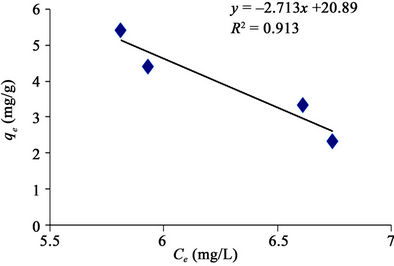
Figure 11. Linear adsorption isotherm of methyl red uptake onto powdered activated carbon (PAC).
3.5. Comparative Study
The applicability of the two isotherm models was investigated from the coefficient of determination (R2) values. Based on this, the sorption data were best modeled into Langmuir Isotherm (0.832 and 0.981) as it was made evident in figures 6 and 8, than Freundlich Isotherm Model (0.890 and 0.944). A high regression correlation coefficient, R2 (0.981) was shown by the Langmuir model. This indicates that the Langmiur model suited best for describing the sorption process of MR onto the commercial activated carbon. R2 value is in agreement with the result of Hameed, [3] and Itodo, [9] using the “Temkin Isotherm model”.
Tables 4 and 5 showed that the qm (mg/g) value which is a measure of maximum adsorption capacity of MR unto GAC has the higher (1.176 mg/g). This concludes that the adsorption of dyestuff (MR) onto GAC is higher using the Langmuir isotherm and this model best described the adsorption onto homogenous surface.
The value of RL indicates the application of the isotherm to be either unfavorable (RL > 1), linear (RL = 1), favourable (0 < RL < 1) or irreversible (RL = 0). In Tables 4 and 5 the RL value for the adsorption of methyl red (MR) on to PAC and GAC was 0.078 and 0.070 respectively, indicating that the adsorption was favourable.
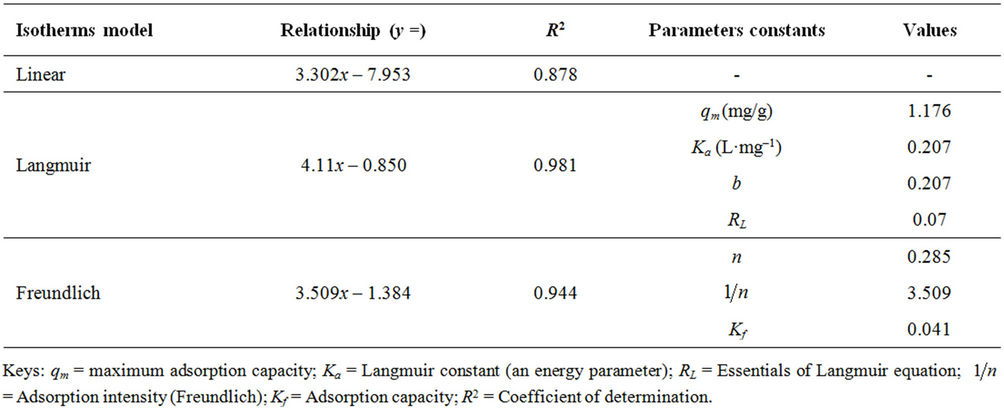
Table 4. Adsorption parameter constants of dye uptake onto Derived GAC.
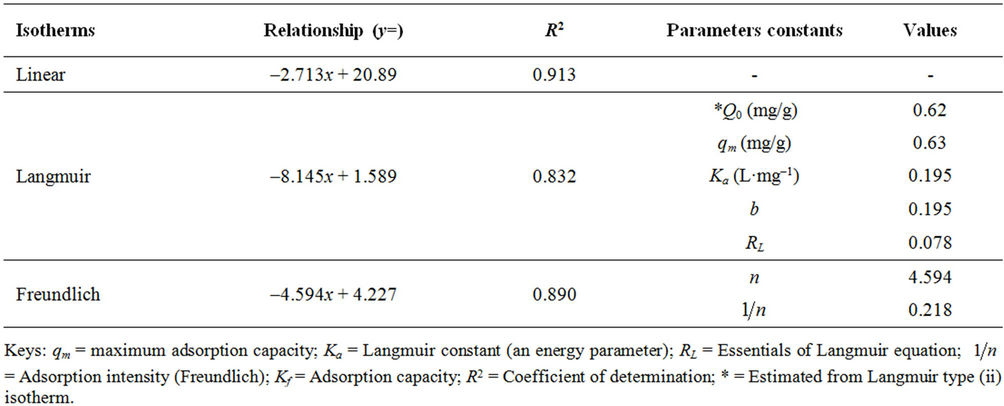
Table 5. Adsorption parameter and constants of dye uptake onto, Formulated PAC.
3.6. Adsorption Intensity ( )
)
The value,  measures the level of surface heterogeneity. Adsorption is said to more favourable when
  is smaller [2]. The
  values, is also related to the energy of adsorption and is usually less than unity. The value of
  ranging between 0 and 1 is a measure of adsorption intensity or surface heterogeneity, becoming more heterogeneous as it value gets closer to zero [18]. For this study the value for PAC (0.288) is closer to zero and in accordance with the favourable conditions. This implied that adsorption onto PAC was distributed onto heterogeneous surface. It also implied that surface site adsorption energy is not uniform. It could be agreeable that the received carbon (GAC) was designed to for a uniform adsorption onto surfaces with equivalent site energies as reflected by the high
  value for GAC (3.509).
4. Conclusion
The adsorption of methyl red from MR simulated dyestuff using both received and derived Activated Carbon was investigated using batch process. The Langmuir Isotherm was found to give the best fit to the experimental data with a higher coefficient of determination obtained for Received GAC. On the other hand, the surface coverage for both particle sizes differs. While adsorption onto GAC proved uptake onto homogenous surface, that on formulated PAC is heterogeneous and was best described with the Freundlich isotherm modeled. The study had also shown that GAC had a higher adsorption capacity compared to PAC.
REFERENCES
- A. Hazrat and K. M. Shah, “Biosorption of Crystal Violet from Water on Leaf Biomass of Calotropis procera,” Journal of Environmental Science and Technology, Vol. 1, No. 3, 2008, pp. 143-150. http://scialert.net/abstract/?doi=jest.2008.143.150
- A. U. Itodo, F. W. Abdulrahman, L. G. Hassan, F. A. Atiku and H. U. Itodo, “GCMS Prediction of Organochlorine Herbicide Sorption Rate: A Batch Kinetic Studies,” Trends in Applied Sciences Research, Vol. 6, No. 5, 2011, pp. 451-462. http://scialert.net/abstract/?doi=tasr.2011.451.462
- B. H. Hameed, “Grass Waste: A Novel Sorbent for the Removal of Basic Dye from Aqueous Solution,” Journal of Hazardous Materials, Vol. 166, 2009, pp. 233-2238. doi:10.1016/j.jhazmat.2008.11.019
- K. D. Shiv, P. Archana, K. B. Ashok and M. Krishna, “Some Commercial Azo Dyes as Inhibitors of Mushroom Tyrosinase DOPA Oxidase Activity,” Journal of Pharmacology and Toxicology, Vol. 2, 2007, pp. 718-724. http://scialert.net/abstract/?doi=jpt.2007.718.724
- O. D. Olukanni, A. A Osuntoki and G. O. Gbenle, “ Decolourization of Azo Dyes by a Strain of Micrococcus Isolated from a Refuse Dump Soil,” Biotechnology, Vol. 8, No. 4, 2007, pp. 442-448. doi:10.3923/biotech.2009.442.448; http://scialert.net/abstract/?doi=biotech.2009.442.448
- K. Rajeswari, R. Subashkumar and K. Vijayaraman, “Biodegradation of Mixed Textile Dyes by Bacterial Strains Isolated from Dyewaste Effluent,” Research Journal of Environmental Toxicology, Vol. 5, No. 2, 2011, pp. 97-107. doi:10.3923/rjet.2011.97.107 http://scialert.net/abstract/?doi=rjet.2011.97.107
- S. Saiful, A. Azhar, G. Liew, D. Suhardy, K. Farizal Hafiz and M. D. Irfan Hatim, “Dye Removal from Aqueous Solution by Using Adsorption on Treated Sugar Cane Bagasse,” American Journal of applied sciences, Vol. 2, No. 11, 2005, pp. 1499-1503. doi:10.3844/ajassp.2005.1499.1503
- M. Jayarajan, R. Arunachalam and G. Annadurai, “Agricultural Wastes of Jackfruit Peel Nano-Porous Adsorbent for Removal of Rhodamine Dye,” Asian Journal of Applied Sciences, Vol. 4, 2011, pp. 263-270. doi:10.3923/ajaps.2011.263.270 http://scialert.net/abstract/?doi=ajaps.2011.263.270
- A. U. Itodo, “Comparative Study of the Preparation, Adsorption and Evaluation of Activated carbons prepared from Agricultural Wastes,” Ph.D Thesis, Department of Pure and Applied Chemistry, Usmanu Danfodiyo, Sokoto, 2011, pp. 30-33.
- N. Chilton, N. Jack, N. Losso, E. Wayne and R. Marshall, “Freundlich Adsorption Isotherm of Agricultural by Product Based Powered Activated Carbon in Geosmin Water System,” Bioresoruce Technology, Vol. 85, No. 2, 2002, pp. 131-135. doi:10.1016/S0960-8524(02)00093-7
- I. Soheila and R. Maryam, “Use of Beech Wood Sawdust for Adsorption of Textile Dyes,” Pakistan Journal of Biological Sciences, Vol. 10, No. 2, 2007, pp. 287-293. doi:10.3923/pjbs.2007.287.293 http://scialert.net/abstract/?doi=pjbs.2007.287.29
- B. H. Hammed, A. T. M. Din and Al. Ahmad, “Adsorption of Methylene Blue on to Bamboo-Based Activated Carbon. Kinetics and Equilibrium Studies,” Journal of Hazardous Materials, Vol. 141, 2006, pp. 819-825. doi:10.1016/j.jhazmat.2006.07.049
- J. C. Igwe and A. A. Abia, “Adsorption Kinetics and Intraparticulate Diffusivities for Bioremediation of Co(II), Fe(II) and Cu(II) Ions from Waste Water Using Modified and Unmodified Maize Cob,” International Journal of Physical Sciences, Vol. 2, No. 5, 2007, pp. 119-127.
- A. U. Itodo, A. Abdulrahman, A. Usman and V. C. Ugboaja, “Pseudo Constants for Methyl Red Sorption: A Rate Study of Received and Derived Activated Carbon,” Journal of Encapsulation and Adsorption Sciences, Vol. 1, No. 4, 2011, pp. 57-64. doi:10.4236/jeas.2011.14008 http://www.scirp.org/fileOperation/downLoad.aspx?path=JEAS20110400003_30055926.pdf&type=journal
- N. Othman, R. Djamal, N. Mili and S. N. Zailani, “Removal of Red 3BS Dye from Wastewater using Emulsion Liquid Membrane Process,” Journal of Applied Sciences, Vol. 11, No. 7, 2011, pp. 1406-1410. doi:10.3923/jas.2011.1406.1410 http://scialert.net/abstract/?doi=jas.2011.1406.1410
- J. A. Otun, I. A. Oke, D. B. Olarinoye and C. A. Okuofu, “Adsorption Isotherms of Pb(II), Ni(II) and Cd(II) Ions onto PES,” Journal of Applied Sciences, Vol. 6, No. 11, 2006, pp. 2368-2376. doi:10.3923/jas.2006.2368.2376 http://scialert.net/abstract/?doi=jas.2006.2368.2376
- A. Syed, M. Sayeed and N. Mayaik, “Utilization of Red Soils and Amended Soils as a Liner Material for Attenuation of Copper from Aqueous Solution: Isotherm and Kinetic Studies,” Journal of Environmental Science and Technology, Vol. 4, No. 5, 2011, pp. 504-519. doi:10.3923/jest.2011.504.519 http://scialert.net/abstract/?doi=jest.2011.504.519
- H. Masrosemal, H. Mas and S. Kathiresan, “The Removal of Methyl Red from Aqueous Solutions Using Banana Pseudostem Fiber,” America Journal of Applied Science, Vol. 6, No. 9, 2009, pp. 1690-1700
- A. U. Itodo, F. W. Abdulraman, H. U. Itodo, L. G. Hassan and S. A. Maigandi, “Application of Methylene Blue and Iodine Adsorption in the Measurement of Specific Surface Area by four Acid Salt,” New York Science Journal, Vol. 3, No. 5, 2010, pp. 25-33.
NOTES
*Corresponding author.