Energy and Power Engineering
Vol.08 No.04(2016), Article ID:66191,6 pages
10.4236/epe.2016.84022
Upgrading Tests Using PSIM Tool of MPPT-PV Feedback-Current Controller
Herman Enrique Fernández Hernández
Engineering and Research Group of VG Metals/UNEXPO Puerto Ordaz-DIP, Ciudad Guayana, Venezuela

Copyright © 2016 by authors and Scientific Research Publishing Inc.
This work is licensed under the Creative Commons Attribution International License (CC BY).
http://creativecommons.org/licenses/by/4.0/


Received 5 March 2016; accepted 26 April 2016; published 29 April 2016
ABSTRACT
This paper presents improvement tests based in a feedback-current controller designed to Tracking Maximum Power Point in photovoltaic system (MPPT-PV). Previously, a version was developed exhibiting results satisfactory in simulation and through of a low cost prototype. Now, using a sophisticated physical model of solar cell available in PSIM program is shown other cases, considering variations both irradiation and temperature to evaluate successfully the controller. The results show that its system is suitable under dynamical changing atmospheric conditions operating with effectiveness acceptable.
Keywords:
MPPT, PV System, PSIM, Feedback-Current, Solar Cell

1. Introduction
A MPPT (Maximum Power Point Tracking) controller is most effective solution used to maximize the power extracted from PV modules under atmospheric conditions [1] - [5] . Although some MPPT methods are applicable for rural applications, they are implemented using powerful ICs, microprocessors or DSP (digital signal processor) [6] - [9] . Consequently, topologies mentioned are not the best for applications in underdeveloped countries, where the cost is a fundamental issue and where a highly trained installation and maintenance personnel is not easily available. As solution, a special feedback-current controller designed to operate as a MPPT system is developed [10] , which is a circuit highly efficient, simple, rugged, low cost design, and ideal for applications in isolated locations in the less developed countries. This paper presents improvement tests using PSIM [11] , a simulation program which allows additional verifications, specially focused to evaluate of the MPPT behavior under some perturbations not considered previously [10] : insolation changes, temperature variations and dynamical response of the controller. New simulation tests prove that the proposed controller can achieve effective, precise and fast response, being a part of the essential characteristics of a MPPT unit, specifically when is oriented to be used in an isolated place.
2. System Description
Figure 1 shows the MPPT circuit using PSIM models. The main blocks used are: a sophisticated PV model available in PSIM, a simple power stage represented by an average model DC/DC converter (step-down topology), the MPPT controller constituted for a generic regulator, filtering stages and finally, simplest representation of a battery bank.
DC/DC converter is modeled using controlled sources of voltage VCVSV1 and current IVCCSV1. Both configurations depend on the duty cycle signal provided by the MPPT regulator. Its unit only requires measurement of the current Isal which is proportioned for solar cells array. The controller structure is based on the model equations explained in a next section.
Connecting adequate sources on S and T terminals available of solar cell module is feasible simulate changing conditions of irradiation and temperature respectively. Either S or T can be configured independently using different profiles: fixed, staircase-ramp type, piecewise linear and with triangular variations.
Acquiring and comparing Pmax and Pout signalsis possible evaluate the tracking method proposed under different operational conditions.
2.1. Solar Module Physical Model (PSIM)
Although physical and functional models are available in PSIM, the first option can simulate the behavior of the solar module more accurately, and can take into account the light intensity and temperature variation. Some parameters required are: number of cells, maximum power, voltage and current in maximum power, open-circuit voltage, short-circuit current, standard light intensity, reference temperature, internal resistances, bang energy, ideality factor, temperature and light coefficients.
Both light intensity and ambient temperature are incoming externally. Default parameters used in simulations test are listed in Table 1 [12] .
The node S refers to the light intensity input (W/m2), and the node T is the ambient temperature input (˚C). The node on the top is theoretical maximum power given the operating conditions. While the positive (+) and negative (−) terminal nodes are power circuit nodes.
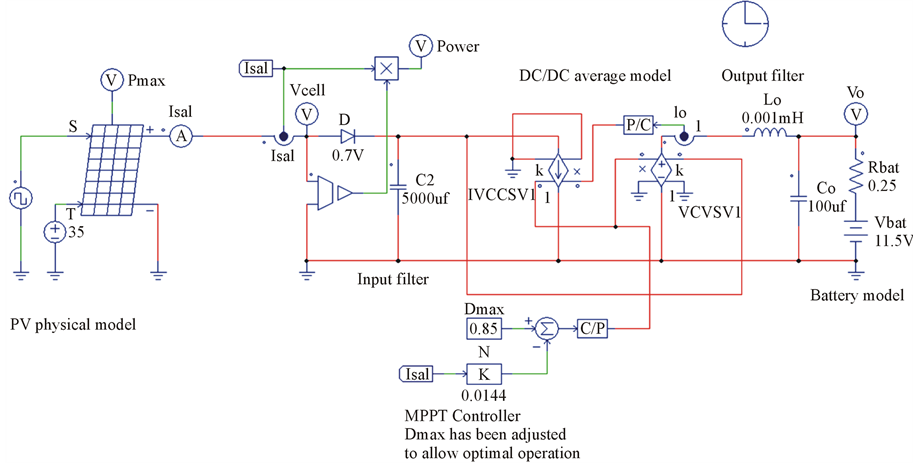
Figure 1. PSIM diagram used to simulate the MPPT-PV with feedback-current.

Table 1. Solar module (physical model)a.
aPSIM tutorial. How to use solar module physical model.
The equations that describe a solar cell are:
 (1)
(1)
where
 (2)
(2)
 (3)
(3)
and
 (4)
(4)
Defining q: electron charge (q = 1.6 × 10⁻¹⁹ C); Ns: corresponding to solar cells connected in series; Ct: temperature coefficient (˚C); k: Boltzmann constant (k = 1.3806505 × 10⁻²³); Rs: series resistance of each solar cell (Ω); A: ideality factor; Rsh(Ω): shunt resistance of each solar cell; S0: light intensity under standard test conditions; Eg: band energy of each solar cell (eV); Tref: temperature under standard test conditions (˚C); vd is the voltage that appears on Rsh; v(V)/Ns is the across the entire solar module; and i(A) is the current flowing out of the positive terminal of solar module [11] .
2.2. Feedback-Current Controller
MPPT strategy works as follows. The proposed MPPT based on output current measurements taking into account the theoretical straight line connecting the maximum power points in the PV panel characteristics. Specifically considering a couple points of power and voltage given by p1: 11.12W, v1: 15.31V and p2: 69.38W, v2: 16.32 V, is possible establish the load power as:
 (5)
(5)
According MPPT strategy previously presented [10] , then Dcontrol or duty cycle expression is determined by:
 (6)
(6)
where Dmax is a constant; and Isal is the current generated according to Equation (1).
3. Simulation Tests
A first test is focused to evaluate MPPT behavior under temperature variations. When Ta is adjusted, tracker function is kept close such to PV power available as is illustrated in Figure 2. Temperature ranges adopted specifically between 25˚C - 40˚C, correspond to environmental conditions in isolated locations at south of Venezuela, regularly registered in some regions at Bolivar State. Under such circumstances the efficiency corresponds to 98.88%.
A second evaluation is realized to verify the possible impact when solar irradiance changes linearly, simulated through triangular waveform with amplitude range between 100 to 1100 W/m2, applied as input signal to “S” terminal of solar cell model. Figure 3 illustrate an acceptable tracking capability of designed controller. The theoretical maximum available power is 63.6357W, the extracted power is 63.3713W, and the MPPT efficiency is 99.58%.
Regarding to dynamic test, the MPPT controller respond quickly under step change of solar irradiance as is showed in Figure 4.
Finally, is considered a staircase function as irradiation over solar cell but adjusting simultaneously a temperature range between 25˚C to 45˚C.When upper temperature is reached, the theoretical maximum available power is 60.648W, the extracted power is 58.292W, and therefore the MPPT efficiency is 96.11%, such as showed in Figure 5. Although the extracted power value has been reduced, the tracker system continues operating satisfactorily.
Because significant modifications are not required, the control system can be implemented with conventional PWM regulators [10] .

Figure 2. Power tracker response under temperature variations. Top traces: superimposed signals Pmax and extracted Power. Bottom trace: temperature profile applied.

Figure 3. System operation when S changes linearly. Newly, Pmax and power signal are coincident.

Figure 4. Step change solar irradiance evaluation.

Figure 5. Staircase function as incoming signal over S terminal available in solar cell model. Simultaneously, a parameter sweep analysis is used in order to produce temperature variations considering a range between 25˚C to 45˚C.
4. Conclusions
MPPT controller reveals that it operates satisfactorily during each test realized. The controller is efficient but also optimizes energy production of PV array. However, just like any off-line techniques, it requires manufacturer data sheet of solar cell connected.
Under conditions considered, it is feasible to install the MPPT controller in isolated locations although atmospheric perturbations persist.
Although the design does not require a compensation stage, nevertheless, a simple network could be added to adapt the circuit to temperature changes.
Acknowledgements
The author would like to thank support provided by the team VG Metals, especially to Mrs. María Mendoza and Mr. Jesús Vergara.
Cite this paper
Herman Enrique Fernandez Hernandez, (2016) Upgrading Tests Using PSIM Tool of MPPT-PV Feedback-Current Controller. Energy and Power Engineering,08,236-241. doi: 10.4236/epe.2016.84022
References
- 1. Babaa, S.E., Armstrong, M. and Pickert, V. (2014) Overview of Maximum Power Point Tracking Control Methods for PV Systems. Journal of Power and Energy Engineering, 2, 59-72.
http://dx.doi.org/10.4236/jpee.2014.28006 - 2. Dolara, A., Faranda, R. and Leva, S. (2009) Energy Comparison of Seven MPPT Techniques for PV Systems. Journal Electromagnetic Analysis & Applications, 3, 152-162.
http://dx.doi.org/10.4236/jemaa.2009.13024 - 3. Reisi, A.R., Moradi, M.H. and Jamasb, S. (2013) Classification and Comparison of Maximum Power Point Tracking Techniques for Photovoltaic System: A Review. Renewable and Sustainable Energy Reviews, 19, 433-443.
http://dx.doi.org/10.1016/j.rser.2012.11.052 - 4. Adly, M., Ibrahim, M. and El Sherif, H. (2012) Comparative Study of Improved Energy Generation Maximization Techniques for Photovoltaic Systems. Power and Energy Engineering Conference (APPEEC), Asia-Pacific 1-5.
- 5. Esram, T. and Chapman, P.L. (2007) Comparison of Photovoltaic Array Maximum Power Point Tracking Techniques. IEEE Transactions on Energy Conversion EC, 2, 439-449.
http://dx.doi.org/10.1109/TEC.2006.874230 - 6. Koutroulis, E., Kalaitzakis, K. and Voulgaris, N. (2001) Development of a Microcontrolled-Based Photovoltaic Maximum Power Tracking Control System. IEEE Transactions on Power Electronics, 16, 46-54.
http://dx.doi.org/10.1109/63.903988 - 7. Hua, C., Lin, J. and Shen, C. (1998) Implementation of a DSP-Controlled Photovoltaic System with Peak Power Tracking. IEEE Transaction on Industrial Electronics, 45, 99-107.
- 8. Kwon, J.-M., Nam, K.-H. and Kwon, B.-H. (2006) Photovoltaic Power Conditioning System with Line Connection. IEEE Transaction on Industrial Electronics, 53, 1048-1054.
http://dx.doi.org/10.1109/TIE.2006.878329 - 9. Lai, C.-M. and You, H.-P. (2014) A High-Efficiency Single-Stage Low-Power Photovoltaic Inverter System with Maximum Power Point Tracking Control. Energy and Power Engineering, 6, 222-234.
http://dx.doi.org/10.4236/epe.2014.69020 - 10. Fernández, H., Martínez, A., Guzmán, V. and Gímenez, M.I. (2008) A Simple, Low Cost Design Using Current Feedback to Improve the Efficiency of a MPPT-PV System for Isolated Locations. Power Electronics and Motion Control Conference, EPE-PEMC, 13th, Poznan, 1-3 September 2008, 1947-1950.
http://dx.doi.org/10.1109/epepemc.2008.4635550 - 11. Powersim (2010) PSIM User Guide. Version 9.0, Release 2. www.powersimtech.com
- 12. Powersim. PSIM Tutorial. How to Use Solar Module Physical Model. www.powersimtech.com