Energy and Power Engineering
Vol.5 No.3(2013), Article ID:31251,14 pages DOI:10.4236/epe.2013.53024
Toward Implementing HH the Amir Declaration of 2% Electricity Generation by Solar Energy in 2020
Qatar Environment and Energy Research Institute, Doha, Qatar
Email: madarwish@qf.org.qa
Copyright © 2013 Mohamed Darwish et al. This is an open access article distributed under the Creative Commons Attribution License, which permits unrestricted use, distribution, and reproduction in any medium, provided the original work is properly cited.
Received January 10, 2013; revised February 10, 2013; accepted February 26, 2013
Keywords: Concentrated Solar Power; Linear Fresnel Collector; Desalination
ABSTRACT
The utility solar power plants were reviewed and classified by two basic groups: direct thermal concentrating solar power (CSP) and photovoltaic (PV). CSP as Parabolic Trough Collector (PTC) of 100 MW solar power plants (SPP) is suggested and suitable to provide solar thermal power for Qatar. Although, LFC had enough experience for small projects, it is still need to work in large scale plant such as 100 MW and couple with multi effect distillation (MED) to confirm costs.
1. Introduction
HH the Amir of Qatar declared at the end of COP 18 in Dec. 2012 that: By 2020, solar energy should generate at least 2% of Electric Power (EP) produced in the country.
Qatar’s Power Plants (PPs) capacity in 2010 was around 8000 MW, and this is expected to be doubled in 2020, or becomes 16,000 MW. The PPs capacity was doubled in only six years in the last decade, as shown in Figure 1, [1]. The main operating PPs types in Qatar are Gas Turbine (GT), and GT Combined Cycle (CC). These plants have much higher Capacity Factor (CF) than Solar Power Plants, see Figure 2, [2]. The annual CF of the Qatar’s PPs was more than 40% in 2010, because of the winter EP low load. The CF of the Solar Power Plants (SPPs) is in the range of 20%. This means that, by 2020, the total capacity of the Solar Power plants (SPPs) should have at least 640 MW in order to generate 2% of the EP. The range of CF shown in Figure 2 is when the plants are operating as base load plants.
Solar Energy (SE) is as an attractive, available, clean, and free primary energy source. Application of SE to generate EP helps in growing new technologies and enhances energy security. Although the SPPs’ are more expensive than the presently used GTCC, it is logic that Qatar supports solar energy development as this is likely to be one of the main EP generation methods in the future. Concentrated Solar Power (CSP) plants offer dispatchable power when integrated with Thermal Energy Storage (TES). The EP outputs of the SPPs match very well with the peak load demand due to air conditioning loads during summer, as this depends on solar insolation along the day. The SPPs are increasingly moving into the range which has traditionally been the domain of classic large-scale PPs. The existing trend of falling SPPs costs would accelerate adoption of SE and reduce the need for incentives. Other advantage of using SPPs is the deep cut in the greenhouse gases emission, mainly caused by fossil fuel combustions in conventional PP.Solar collector manufacturing is conventional technology, can be manufactured locally with dropping cost as the need increases, and creates new business and jobs.
Domination of NG as primary fuel in Qatar can solve the main SE problem of intermittent nature, by using hybrid solar-NG plants. Compared to PPs using NG, the
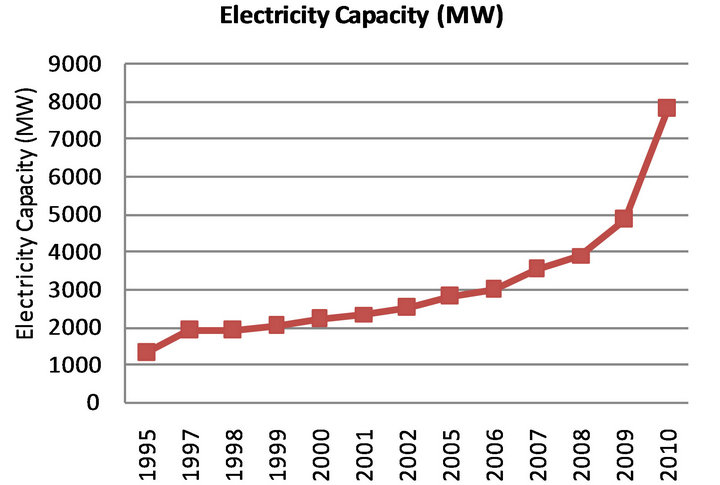
Figure 1. History of the EP installed capacity, [1].
SPPs are in their infancy, and are expected to become less expensive as technologies mature and become mass produced.
The major barrier for the technology at present is the cost of generated electricity by SE. Meanwhile, continuous increase of the NG cost, Figure 3, [3], is another reason for looking forward to diversify the primary energy for EP generation, and use of SE.
2. Utility Solar Power Plants (SPP) Broad Classifications
The utility-scale SPPs are generally classified by two basic groups: thermal concentrating solar power (CSP) and photovoltaic (PV). These are the types to be considered for the new SPPs in Qatar. Since the new required capacity is in the range of 640 MW, it is logic to choose plants of 50 MW - 100 MW to avoid the use too many small units.
2.1. Thermal Concentrated Solar Power (CSP) Plants
In thermal Concentrated Solar Power (CSP), solar receivers (mirrors) reflect their incident direct solar rays as concentrated rays on receivers, where Heat Transfer Fluids (HTF) is flowing. The HTF is heated to become heat source for driving heat engines, such as steam turbines, gas turbines or Stirling engines, producing EP, Figure 4. So, in CSP plants, only direct radiation is utilized, while diffuse type is not. The most developed and used type of concentrated solar collectors is the Parabolic Trough
(PTC), followed by power tower. Other types are the Linear Fresnel (LFC), and parabolic dish operating Stirling engine are under development to reach commercial status at large capacities.
Another mode of SPPs’ operation is the use of thermal storage. Solar heat collected during the daytime can be stored in liquid or solid media such as molten salts, ceramics, concrete or phase-change media. The stored heat can then be extracted at night for running the power block; and thus the plant becomes dispatchable. The PP’s dispatchability is very crucial in PPs as the plant can respond by generating the required power as the load demand. It can be turned on or off, or can adjust their power output on demand.
The capacity of individual CSP plants is now typically between 50 and 280 MW, but could still be larger.
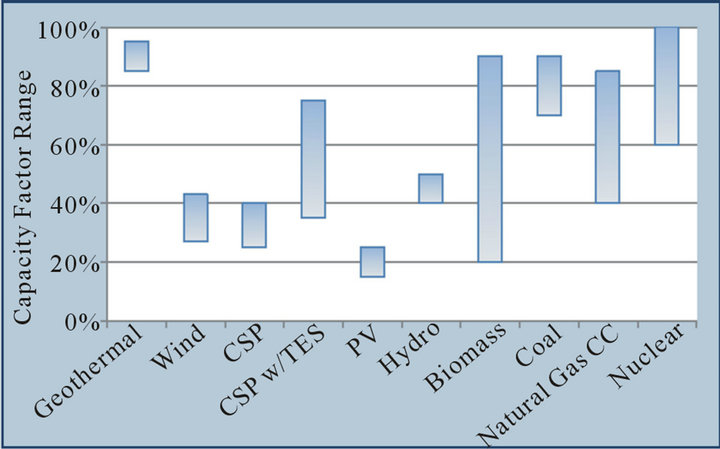
Figure 2. Comparison of capacity factor by technologies, [2].
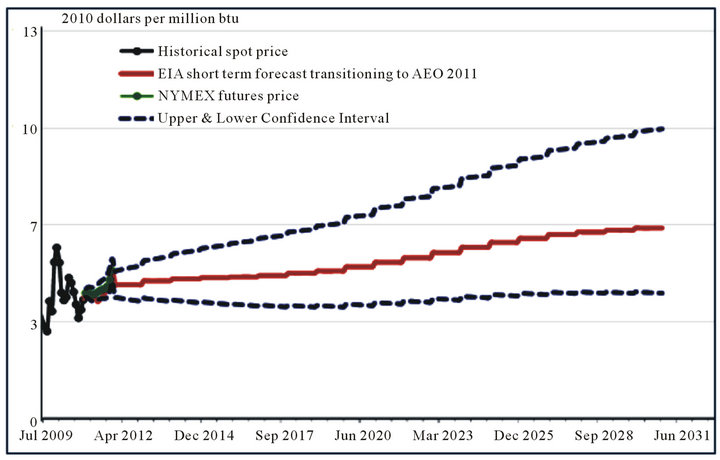
Figure 3. Henry hub wholesale natural gas price history, [3].
2.1.1. Concentrated Solar Power (CSP) Using Parabolic Trough Collectors (PTC)
The PTCs are the most used type of collectors in SPPs. The PTCs have mirrors of linear parabolic shape, reflect concentrated rays onto tube-shape receiver positioned along the reflector’s focal line, and carrying the HTF, Figure 5, [5]. More on the PTC plants are given later. The components of the SPP using PTC and molten salt thermal energy storage are shown in Figure 6, [6].
2.1.2. Concentrated Solar Power (CSP) Using Linear Fresnel Collectors (LFC)
The LFC concept uses sets of long mirror facets that reflect light to a linear receiver where it can be directly absorbed to generate steam. The LFCs are much cheaper and need much lighter carrying structure to mount compared to the PTCs. The optical performance of the LFC system is limited by the angle at which the sunlight strikes the reflectors, and because the mirrors must be oriented to reflect the irradiation to the receiver, they most often do not directly face the sun. This non-normal orientation towards the incoming sunlight is the primary optical loss for LFC, and the loss is incurred both with respect to the transversal plane (perpendicular to the axis of the collector) and longitudinal plane (parallel with the axis of the collector). This concept is illustrated in Figures 7(a) and (b), [7]. Figure 7(c) shows the arrangement of LFC in SPP. There is growing interest in Linear Fresnel Collectors (LFC) technology as candidate for combined-cycle integration with solar energy through direct steam generation (DSG).
The first large utility-scale basis of 30 MW using Linear Fresnel Collectors (LFC) to generate steam operating power cycle was Puerto Errado 2 (PE2), [8]. The plant
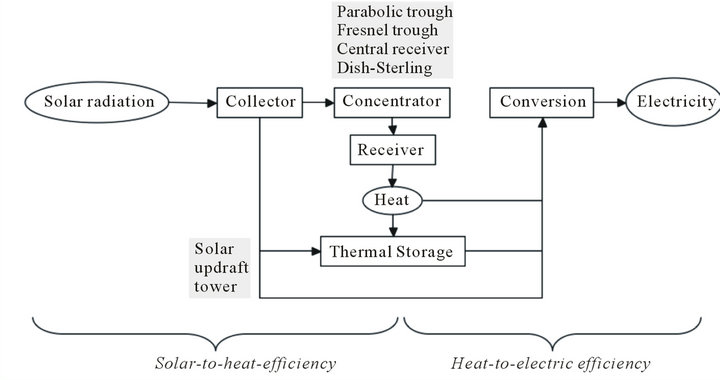
Figure 4. Schematic illustration of thermal CSP plants, [4].
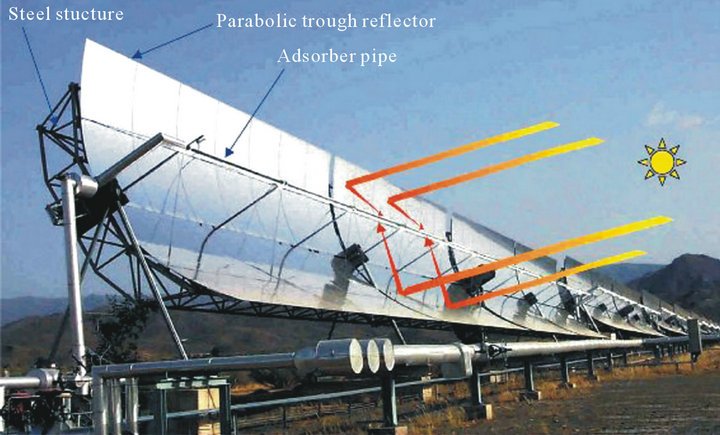
Figure 5. Photo of parabolic trough system (source: NREL), [5].
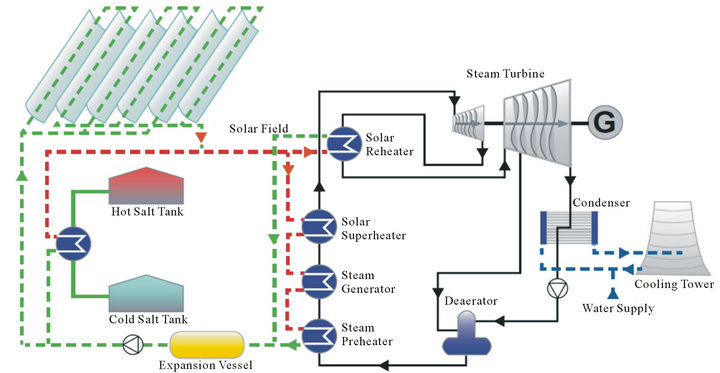
Figure 6. SPP arrangement using rankine steam cycle with thermal energy storage, [6].
 (a)
(a)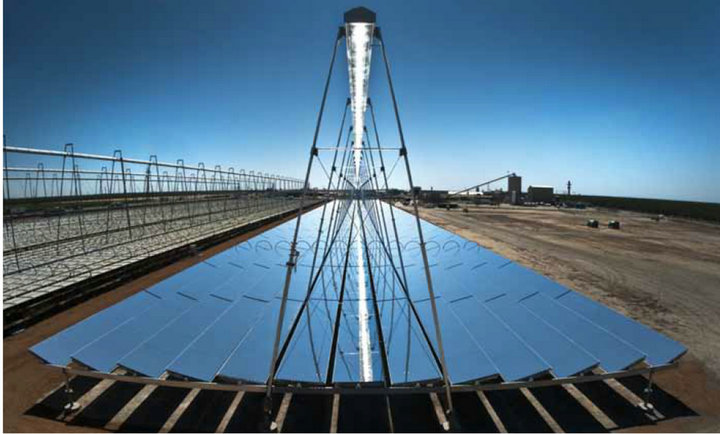 (b)
(b)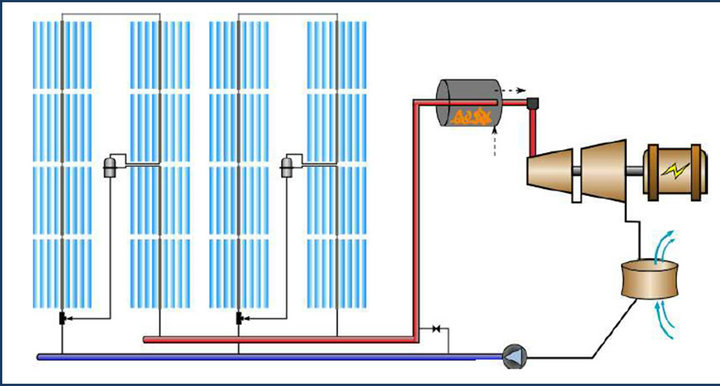 (c)
(c)
Figure 7. (a) Angles associated with the optical performance of the LFR technology, including transversal incidence φT, longitudinal incidence φL, solar zenith θz, and solar azimuth γs, [7]. (b) The linear fresnel collector type of direct steam generator, [6]. (c) SPP Arrangement using FLC and rankine steam cycle without thermal energy storage, [7].
covers an area of 700,000 m2 land with 28 rows of mirrors, and has aperture area of 302,000 m2, almost 10,000 m2/MW. The ratio of land to solar collector area is 2.33. This land to apertures’ area of 2.33 is low when compared with 4 for PTC plants. This plant, operated by Novatec Solar España, is a linear Fresnel reflector system, Figure 8, [8].
2.1.3. Concentrated Solar Power (CSP) Using Power Tower
A solar power tower consists of an array of distributed dual-axis tracking flat mirrors (called heliostats) that concentrate solar rays on a central receiver atop a tower; and containing the HTF, see Figure 9, [9].
The HTF heated up to 500˚C - 1000˚C and then is used as a heat source for a power heat engine or energy storage system. Power tower with molten-salt thermal storage was developed specifically to generate EP. It can be the most efficient and lowest cost solar power systems but it is not commercially established yet.
The molten-salt provides efficient, low-cost thermal energy storage (TES) system, and allows solar plants to be designed with high annual Capacity Factor (CP) or being dispatch-able to meet summer load.
The PS20 is the world’s most powerful solar power tower of 20 MW. The PS20 was designed by Abengoa Solar in Seville, Spain. Its operation began in April 2009. It has 162 m solar tower height and 1255 heliostats. The PS20 is adjacent to the world’s first commercial CSP tower, the PS10, also designed by Abengoa Solar, [10], see Figure 10.
2.1.4. Concentrated Solar Power (CSP) Using Parabolic Dish
Parabolic dish systems use mirrors forming dish-shaped reflector to focus solar rays onto receiver at the dish focal point, Figure 11, [11]. A working fluid, heated in the receiver, such as hydrogen drives a turbine or Stirling heat engine. Most current dish applications use Stirling engine technology because it has high solar-to-electric efficiency (@30%). Its modular nature (25 kWe units) implies that plants of virtually any size could be built or

Figure 8. An overview of the errado 2 plant, [8].
 (a)
(a) (b)
(b)
Figure 9. (a) Figure of solar power tower with heliostat, [9]. (b) Schematic diagram of solar tower power cycle, [9].
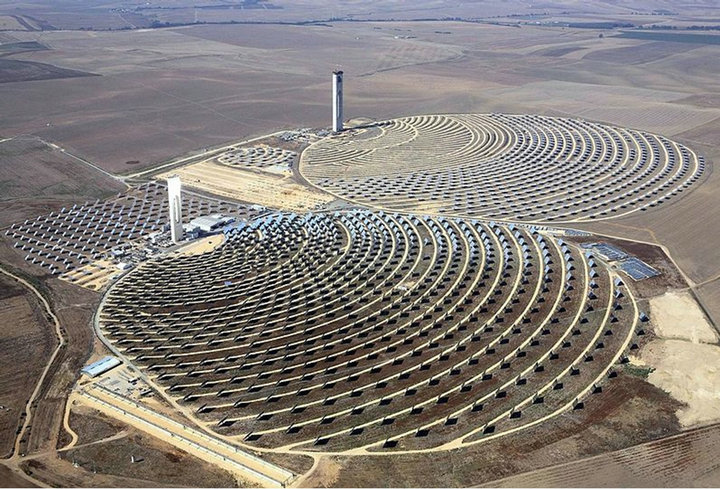
Figure 10. Solar power towers for PS10 and PS20, [10].
expanded. These systems do not require water for cooling; another benefit compared to PTC and LFC systems. Current systems have not demonstrated the level of reliability considered necessary for large commercial system.
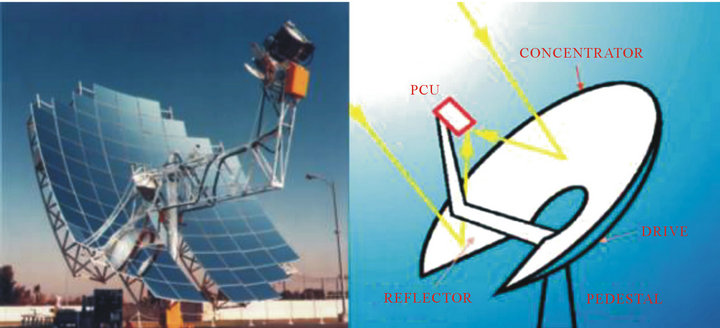
Figure 11. Stirling dish systems at sandia national labs, [11].
At present, there are no operating utility large scale parabolic dish plants.
Currently, there is one dish/stirling plant containing 60 dishes in operation in Arizona, US. Each dish has 250 kW capacities. So, the total capacity of the plant is 1.5 MW. This plant started production on January 2010. There are no operating (or in development) commercial dish systems of large utility scale capacity. The NREL gave the following data on Maricopa Solar Project (Maricopa) plant in the US, [12].
2.2. Photovoltaic (PV) Power Station
A PV panel generates electricity when light energy (photon) hits the semiconductor surface of the panel and releases electrons that would generate voltage differences. Large numbers of PV panels are needed to generate electricity on a large scale. The PV systems efficiency has increased during the last decade and reached a maximum of 20 per cent in some commercial panels. The system uses solar panels consisting of number of solar cells manufactured from semiconductors materials. The semiconductors materials exhibit the PV effect. Materials presently used for PV include crystalline silicon (c-Si) such as mono-crystalline silicon, polycrystalline silicon, and amorphous silicon; and cadmium telluride, and copper indium gallium selenide/sulfide. Masdar (in UAE), has already connected a PV power station 10 MW PV to the grid. Masdar is planning to install the first large solar PV plant of 100 MW (called NOOR 1).
Concentrating photovoltaic (CPV) systems are currently developed by different companies. Similar to dish/ Stirling systems, these systems are modular in nature (25 - 50 kWe units) and have potential for high solar-toelectric efficiency (>30%). These systems also do not require water for cooling. Manufacturers are currently providing CPV systems but only with a few MW per year; they still have limited operational experience.
A photovoltaic (PV) power station is large-scale PV system that generates EP to be supplied to the electric grid at the utility level, and not to local users, see Figure 12, [13]. PV systems usually include either crystalline silicon (c-Si) or thin-film technologies. Thin film includes an array of advanced materials, but only one— cadmium telluride (CdTe) has had significant success in utility-scale solar development.
2.3. Integrated Solar Combined Cycle Plants (ISCC)
An Integrated Solar Combined Cycle (ISCC) plant consists of conventional Gas Turbine Combined Cycle (GTCC), or simply (CC), plant integrated with solar field, Figure 13. The components of the ISCC are Gas Turbine (GT), Heat Recovery Steam Generator (HRSG) driven by the hot gases exhausted from the GT, steam turbine, and concentrated solar collector field (usually PTC but it can be FLC) producing steam. The steam generated in
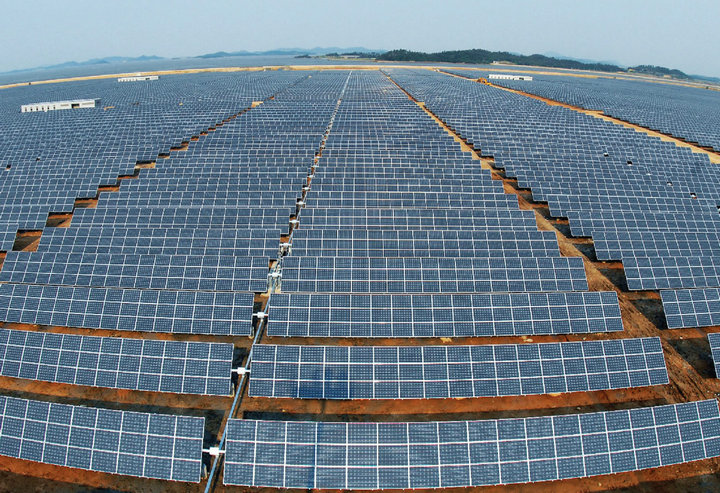
Figure 12. PV power system of 24 MW: SinAn, South Korea of 600,000 m2 area, [13].

Figure 13. Integrated solar combined cycle ISCC, [14].
the solar field augments the steam generated from the HRSG, and thus increasing the size and power output of the steam turbine. The ISCC system gives the benefits of solar energy and the highly efficient GTCC operated by Natural Gas (NG), which is abundant in Qatar. In Integrated Solar Gas Turbine Combined Cycle (ISCC), the energy generated by solar energy represents 10 - 20 percent of the total plant output. Kuwait has completed a technical feasibility study for the construction of ISCC plant having the capacity of 280 MW, including 60 MW solar components.
Choice of SPP for Qatar from the Available SPP Alternatives
The required additional capacity of the PP in Qatar is more than 8 GW from 2010 to 2020, and 640 MW of this capacity should be SPPs to satisfy HH the Amir decision to generate at least 2% of EP by solar energy. A logical capacity choice for each SPP should be in the range of 50 - 100 MW. The already existing PPs capacities in Qatar are: 497 MW for Ras Abu Fontas A, 2273 for totalRas Abu Fontas B, 3550 MW for totalRasLaffan A, B, and C, and 2007 MW for Mesaieed Power station, a total capacity of 7830 MW, [1]. Moreover the typical demand for base-load cheap electricity is usually supplied by large units. Thus, the estimated capacity of any suggested PP is in the range of 50 MW or higher. It is noticed that PV power stations (PVPS) the status of commercial well proven type PP for the range of 50 MW - 100 MW suitable for Qatar, and should be considered. However, all PVPS are not dispatchable and have low capacity factor. This means that stand by station of the same PVPS capacity should be built to count on the PVPS.
Concerning the CSP systems, both the power tower, and the FLC reached the commercial status for capacity of 20 MW, and 30 MW respectively. However the number of these types of plants are so little to give reliable records for their operation and maintenance. These two types are hardly to be considered for capacity of 100 MW for the time being.
2.4. Solar Power Plants (SPP) Using Parabolic Trough Collectors (PTC)
Reviewing the LFC, power tower, and parabolic dish with Stirling engine power stations indicates that none of them reach the commercial status of well proven type with reliable record to build new SPP having capacity of 50 MW or more here in Qatar for the time being. Table 1, [6], presents a comparison between the four types of the thermal CSP plants. This table shows that the technical risk of adopting the PTC type is low, while for the risk for power tower and the LFC and power tower is medium, and for the parabolic dish and Stirling engine the risk is high, [6]. The Solar Power Plants (SPP) using Parabolic Trough Collectors (PTC) is the only option left among the CSP type of SPPs. This is the reason to consider only the PTC plants here in details. Figure 14 shows the installed capacity of the different thermal CSP plants, with clear indication that the SPPs using PTC are the most used and planned type.
The operational large CSP using PTC includes: 354
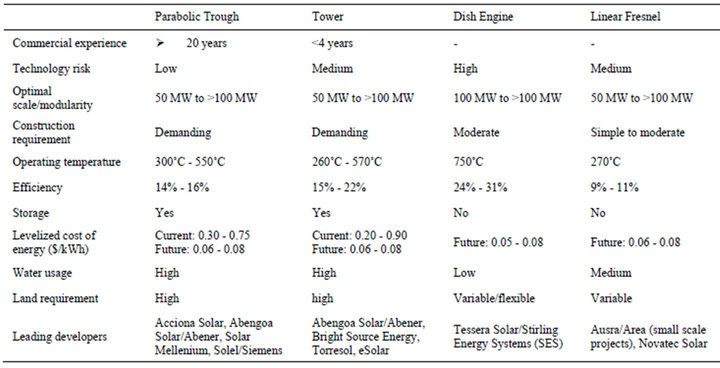
Table 1. Comparison of solar thermal concentrating technologies, [6].
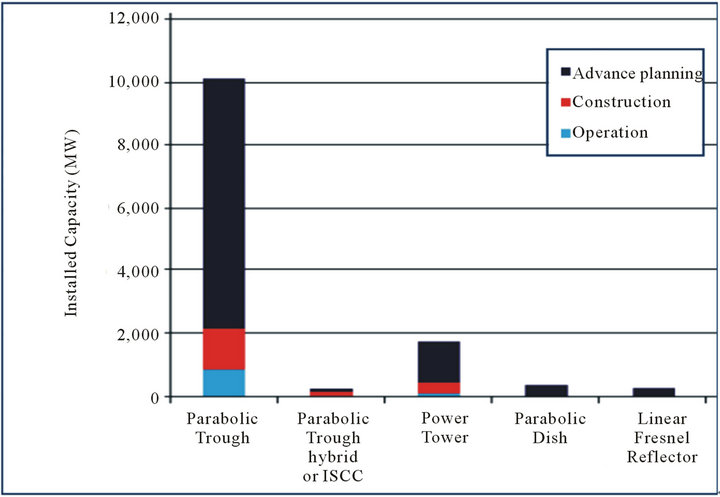
Figure 14. Implementation of CSP technologies, [6].
MW Solar Energy Generating Systems power installation in the USA, Solnova Solar Power Station (Spain, 150 MW) and Andasol solar power station (Spain, 150 MW).
There is the 370 MW Ivanpah Solar Power Facility, located in California’s Mojave Desert, is the world’s largest solar thermal power plant project currently under construction. The Solana Generating Station is also under construction and has capacity of 280 MW, and is located 110 km southwest of Phoenix, Arizona.
The SPPs using PTC technology are using steam Rankine cycle as power block. The average capacity is 50 MW or more, which is considered suitable for Qatar. This is the most used SPPs with enough operating experience. Nine SPPs, with a total generation capacity of 354 MW, called SEGS (Solar Electric Generating Systems) were the first large CSP to be built and operated in the California Mojave desert from 1984 - 1990. The SEGS systems are co-fired with natural gas to provide continuous operation when the sun does not shine. These were followed by several SPPs in many part of the world.
Examples of the several built SPP with PTCs are: 64 MW power plants near Boulder City, US, and several 50 MWe power plants in Spain shown in Table 2, [15].
3. Suggested SPP Using PTC
A solar CSP parabolic trough PP of 100 MW net power output is suggested in this study with 6 hours (h) Thermal Energy Storage (TES) system to assure the plant capability to cover the peak load period and to raise the CF to 38%. Tracking the sun from east to west, while rotating on a north-south axis, the trough focuses the sun’s energy on a pipe located along its focal line. Troughs can also rotate on an east-west axis only but yield less annual energy. The HTF, typically oil, is heated up to 400˚C temperatures while it is circulated through the receiver pipes and then pumped to a central power block area, where it passes through a heat exchanger. In this heat exchanger, called Steam Generator (SG), the oil’s heat is then passed to water to generate steam. The steam is used in turn to drive a conventional turbine generator. Since the parasitic power loss of this type of PP is about 10%, the gross power would be 110 MW. The System Advisor Model (SAM) computer program developed by NREL is used here to figure the solar field, the power cycle, the TES, required budget of the project, and finally levelized Energy Cost (LEC), [16]. Because no boundary conditions data are available for Qatar, the environmental data for Cairo, Egypt is used in running the program. This environmental data are given as follows:

The SPP data are: gross power output of 111 MW, net output to gross output efficiency is 90%, and then the estimated output design is 100 MW. The HTF has temperature to the power block at 391˚C, returns at 293˚C. The steam throttling condition is 100 bar pressure and 370˚C. The rated Rankine cycle efficiency is 0.3774, and and the parasite losses is about 85%, and thus the net efficiency is 0.82. The steam blow-down fraction is 0.02. NG backup boiler has 0.9 efficiency based on Low Heating Value (LHV). The steam cycle can be operated at maximum to rated ratio of 1.05, or maximum output of 105 MW, and the minimum operation output is 25 MW; and the minimum start up temperature of the steam is 300˚C.

Table 2. Examples of SPP using PTC, and their basic characteristics, [15].
The solar field data from the SAM output is given as follows.


As shown in the result, the Solar Multiple is 2, for 6 hours TES. The term solar multiple (SM) is useful metric to evaluate the performance and solar field sizes. The SM is the ratio of the solar energy collected at the design point to the amount of solar energy required to generate the rated turbine gross power. An SM of 1.0 means that the solar field delivers exactly the amount of energy required to run the plant at its design output, at the design point solar conditions. A larger SM indicates larger solar system. The design point is the reference set of conditions selected for designing the system. For PTC, the design conditions are: cosq = 0, ambient temperature = 25˚C, DNI = 1000 W/m2, and wind speed = 5 m/s. The cosq = 0 means that the incidence angle is zero degrees or the sun is normal to the collector aperture.
Based on the design point conditions in the sections above, solar fields with SM range from 1 to 3.5 have solar field areas as given in the Table 3, [15].

Table 3. Solar multiple field areas.
Thus, the aperture area per MW is 8616 m2/MW. The DNI solar in Cairo is given as 1840 kWh/m2. This may be lower than that of Doha, Qatar (which is about 2100 kWh/m2), but the dusty weather in Doha may give DNI less than that of Cairo. The irradiation design is taken as 950 W/m2.
The solar field thermal output is 588 MW thermal (MWt). This is achieved by using 86,5252 m2 total aperture area by using 230 number of loops of 3762.4 m2 area per loop, and loops total optical efficiency equal to 0.716. The land area for the solar field is 641 acres (2,589,640 m2), and the land total area is 898 acres (3627, 920 m2 or 4.63 square kilometer), by assuming that the total land area is 1.4 the solar field area.
The HTF operating condition are: the minimum operating temperature is 12˚C, maximum operating temperature is 400˚C, design inlet loop is 293˚C, and outlet loop minimum temperature is 391˚C. The minimum and maximum HTF flow rates in a single loop is 12 kg/ and 1 kg/s respectively. Data on solar SCA are given as:

4. Concerning the Used Receivers
The net efficiency of the power block plant (net EP out/ heat rate output of the SG) is 0.32. Thus, heat is to be generated at rate 312.5 MW tin the SG. The ratio of the SG heat output to the solar heat is in the range of 65% - 70%, and thus the required solar heat input is (312.5/0.65=) 481 MWt when no TES is considered.
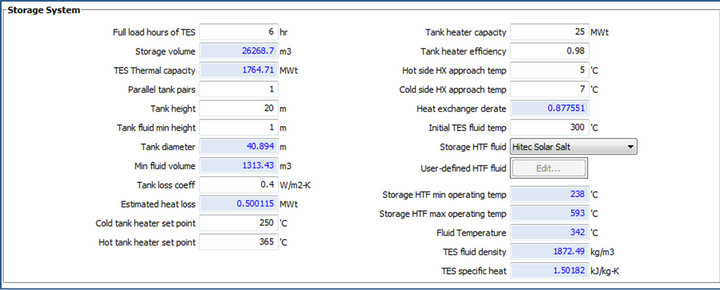
The storage system data are given as follows:
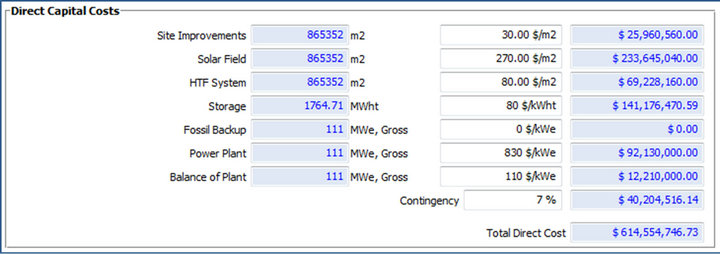
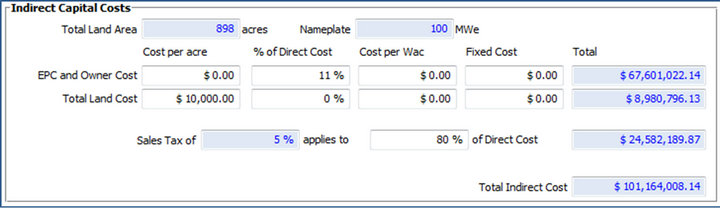
The capital costs include: land side improvement, solar field cost (about $270/ m2), HTF cost, TES cost of 1765 MWt ($80/kWht), the power block ($830/kW), and the balance of the plant ($110/kW). The capital costs are given by SAM program as:

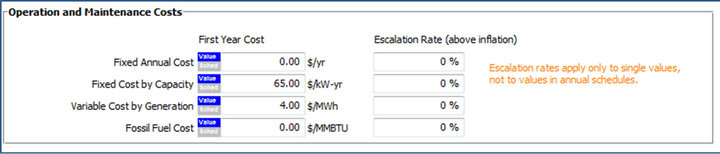
The operation costs are given as:
The above data were used to calculate the LEC, based on 25 years for the plant life, 2.5% inflation rate, 8.2% real discount rate, and 10.9% nominal discount rate. The itemized LEC is shown in Figure 15. The plant electric output is given in Figure 15.
The annual energy output is 247.345 GWh, the real LEC is 21.93 cent/kWh, capacity factor is 28.3%, and annual water usage is about 1 million cubic meters (Mm3/y) by using evaporative cooling condenser. Figure 16 shows the monthly electric power output of the plant.
5. Conclusions
The utility solar power plants were reviewed. The installed capital cost per MW of SPP is much higher than that of conventional plants. Thus, substantial economic support will be required for CSP project economic viability. For the utility scale power production, parabolic trough is only technology that can have operational track record, which gives it a moderate technology risk (low relative to other CSP technologies).
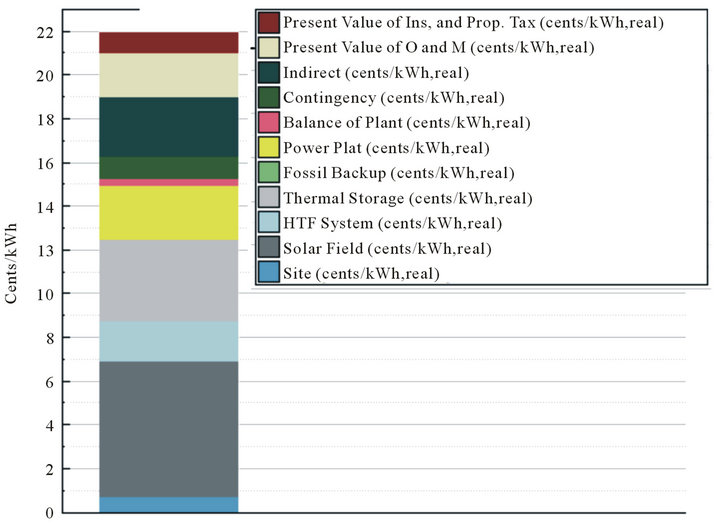
Figure 15. Itemized LEC cost.
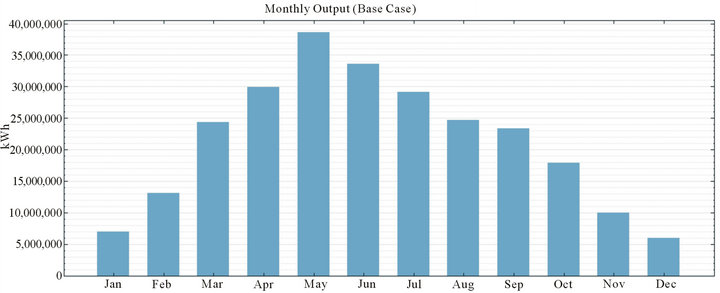
Figure 16. Plant monthly electric power output.
A 100 MW SPP using PTC was considered suitable for Qatar. The result shows that the total capital cost is $7.16 Million (M) per MW, and the LEC is $0.22/kWh.
Linear Fresnel technology can be more competitive with parabolic trough for utility-scale generation, but more projects are needed to build reliability record for large SPP. There is insufficient actual construction experience to confirm costs of utility scale projects at this stage. There are enough experience with LFC for small projects such as solar cooling and desalination. There is insufficient actual construction experience to confirm costs of utility scale projects at this stage.
REFERENCES
- M. Darwish and R. Mohtar, “Qatar Energy Footprint,” Submitted for Publication to the Journal of Energy Strategy.
- M. Mendelsohn, T. Lowder and B. Canavan, “UtilityScale Concentrating Solar Power and Photovoltaic Projects: A Technology and Market Overview,” Prepared under Task No. SM10.2442 Technical Report, NREL/ TP-6A20-51137, 2012.
- Appendix A, “Key Assumptions for Levelized Cost of Electricity Ranges”. http://www.ucsusa.org/assets/documents/clean_energy/Appendix-Key-Assumptions-Levelized-Costs.pdf
- “Final Report on Technical Data, Costs, and Life Cycle Inventories of Solar Thermal Power Plants,” Project No: 502687, NEEDS New Energy Externalities Developments for Sustainability Integrated Project. http://www.needs-project.org/RS1a/RS1a%20D12.2%20Final%20report%20concentrating%20solar%20thermal%20- power%20plants.pdf
- Concentrated Thermal Power Now. http://www.greenpeace.org/raw/content/international/press/reports/Concentrated-Solar-Thermal-Power.pdf
- Utility Scale Solar Power Plants; Guide for Developers and Investors, International Finance Corporation (IFC), World Bank Group, 2012.
- M. J. Wagner, “Results and Comparison from the SAM Linear Fresnel Technology Performance Model Preprint,” 2012 World Renewable Energy Forum, Denver, 13-17 May 2012, p. 2.
- “Puerto Errado 2 Thermosolar Power Plant (PE2),” Concentrating Solar Projects, National Renewable Energy Laboratory, 2012. http://www.nrel.gov/csp/solarpaces/project_detail.cfm/projectID=159
- “Planta Solar 20,” Concentrating Solar Projects, National Renewable Energy Laboratory, 2012. http://www.nrel.gov/csp/solarpaces/project_detail.cfm/projectID=39
- NREL Concentrating Solar Project, Maricopa Solar Project (Maricopa) Plant. http://www.nrel.gov/csp/solarpaces/project_detail.cfm/projectID=58
- P. R. Fraser, “Stirling Dish System Performance Prediction Model,” M.Sc. Thesis, Mechanical Engineering Department, University of Wisconsin, Madison, 2008.
- NREL Concentrating Solar Project, Maricopa Solar Project (Maricopa) Plant. http://www.nrel.gov/csp/solarpaces/project_detail.cfm/projectID=58
- 24 MW, SinAn, South Korea. http://www.conergy.com.au/PortalData/1/Resources/master/images/references/freefield/Solar_farm_SinAn.pdf
- AM0100, “Integrated Solar Combined Cycle (ISCC) Projects— Version 1.0.0”. https://cdm.unfccc.int/methodologies/DB/BES7OQGMZYOMCP9JPTVJHP93BVK4UO
- M. Darwish, H. K. Abdulrahim and R. Mohtar, “Solar Power Desalting Plant in Qatar: Design and Analysis,” LAP LAMBERT Academic Publishing, Saarbrücken, 2012.
- P. Gilman and A. Dobos, “System Advisor Model, SAM 2011.12.2: General Description,” Technical Report, NREL/ TP-6A20-53437, 2012. http://www.nrel.gov/docs/fy12osti/53437.pdf