Energy and Power Engineering
Vol.5 No.1(2013), Article ID:26442,9 pages DOI:10.4236/epe.2013.51007
Factors Affecting Electricity Demand in Jordan
Electrical Power Engineering Department, Hijjawi Faculty for Engineering Technology, Yarmouk University, Irbid, Jordan
Email: mhomom@yahoo.com
Received September 30, 2012; revised November 30, 2012; accepted December 10, 2012
Keywords: Electricity Demand; Demographic Factor; Tariff; Ambient Temperature; Jordan
ABSTRACT
1) The paper examines the relationship between electricity demand and climate/non-climate related factors using statistical regression analysis. 2) It focuses on the environmental, demographic, policy (energy pricing) and technological factors as the main factors affecting the consumption pattern in Jordan. 3) The paper also presents the variations occurred in the electricity demand over the period 1994-2008. The variations that are observed during the period of study are: Shifting of the peak load occurrence from evening to morning period, Modification in the annual daily load curve especially in winter season, Variation in relationship between space temperature and demand especially in winter, and dramatic increase in electric generation after year 2003. The shift in peak load from evening to morning period is mainly due to technological factor as a result of wide use of the air conditions in houses, services and government offices for cooling in summer instead of ordinary air fans. The variations in consumption pattern between 2000 and 2007 are mainly associated with economic, social and demographic factors. The high demand at lower space temperature is governed by introducing new appliances for heating in winter as a result of low electricity pricing comparing with gasoline price. The dramatic increase in electric generation after 2003 is probably due to demographic factors as a result of high growth of population after the Gulf war II. 4) The correlation between the daily maximum loads in morning and evening periods with the differential temperature (ΔT) above 20˚C threshold in summer and below 15˚C threshold in winter, shows pronounced changes in 2007 compared with year 2000. The regression tests show that a decrease of 1˚C below 15˚C threshold in winter 1) increases the morning demand by only 2 MW/˚C in 2000 and 16.7 MW/˚C in 2007, 2) decreases the evening peak by −2.6 MW/1˚C in 2000 and increases the evening peak by 22.9 MW/1˚C in 2007. Results show that the demographic, technological, environmental and national energy pricing factors play a vital rule in consumption pattern in Jordan. Moreover, the paper reveals that planners and decision makers should be careful when applying new tariff in the developing countries such as Jordan.
1. Introduction
The electricity energy consumption pattern in any country is a multivariate, consisted a mix between climate and other important economic factors including energy prices, income, Gross National Product (GNP), import and export values and energy demand index [1-3]. Shuvra et al. [4] summarized the factors that directly influence the change of electrical energy demand in any country by economic, demographic and technological factors, factors related to policy change and environmental factors. The economic factors that drive the electrical energy demand are income and price. The income is reflected by the Gross Domestic Product (GDP) of a nation where the demand is expected to increase with the growth of economy [5], while the increase in the price of the energy unit (i.e. in kWh) leads to reduced consumption. The demographic factor implies that population is an important factor that might influence electricity demand; with growing population, the total energy requirement in all sectors is expected to rise. Technological factors imply that introducing new technologies in the production side, improvement of raw material processing and purification, increase in the efficiency of the machineries may influence energy demand. Global and regional policy changes may influence energy consumption, government financial policies, building regulations, taxation, and commitment to reduce Green House Gas emission, shifting towards renewable and cleaner energy, use of energy efficient equipments may play significant role in the variation of demand of electricity. Finally, the environmental factor implies that, the ambient air temperature, as well as the relative humidity, clearness index, cloudiness, rainfall, solar radiation and wind speed are considered variables in energy demand estimation [6]. The influence of local climate on energy demand has been reported by several researchers in different countries [7-10]. Rosenthal et al. [7] investigated the economical impact of ambient temperature on the energy consumption in USA and show that the increase of 1˚C above the mean daily maximum temperature reduce the primary energy use and energy expenditures by 0.70% and $5.5 billion during 2010 due to the saving in the heating systems. Colombo et al. [8] show that the increase in the mean daily maximum temperature by 3˚C in Toronto during summer would increase the average and standard deviation of the peak load by 7% and 22% respectively. A study made by Cartalis et al. [9] shows that the increase of ambient temperature by 1˚C above the mean value causes a decrease in the energy consumption required for heating by 10% during winter and increase in the energy required for cooling by 28.4% [9]. An experiment made by Shukla et al. [10] for climate assessment in India shows that the increase of the average ambient temperature causes an increase in the space cooling requirements for residential, services and transportation sectors. The increase in electricity requirements for these sectors induced by temperature rise requires higher power capacity build-up [10]. Bessec and Fouquau [11] used population, production in total manufacturing, and temperature as main factors for modeling the monthly electricity consumption in 15 states of the European Union. Results show a U-shape relationship between outdoor temperature and electricity demand [11,12]. The nonlinearity refers to the fact that both increases and decreases in temperature, linked to exceeding certain threshold temperatures, increase the demand for electricity [13].
The paper emphasis the factors causing changes in consumption pattern in Jordan during the period between 1994-2008, with emphasis on the environmental, demographic, technological and policy factors. Section 2 of the paper presents the changes occurred in the load demand during the period 1994-2008, mainly the shift in peak load to midday time period, and influence of local climate on energy demand. Section 3 compares the correlation between demand and environmental demographic factors in years 2000 and 2007. The factors used in analysis are: ambient temperature in summer and winter, and factors related toi population response during holiday and working day. The correlation was obtained based on statistical regression analysis.
2. The Changes in Electricity Demand Response in Jordan during 1994-2008
2.1. Shifting of Annual Peak Load from Evening to Morning Period
Table 1 presents the annual generation (in GWh) and maximum demand (in MW) between 1994 and 2008 for Jordan case. As shown in the table, the annual energy and demand increased from 4794 GWh and 794 MW in 1994 to 12,807 GWh and 2130 MW in 2007 )factors of 2.7 for both energy and demand). It is also shown that the annual peak load in Jordan occurs in summer particularly between July and September. According to Jaber et al. [14], the annual peak load in Jordan occurs in summer, particularly between July and September every year, due to the profuse use of air-conditioning and ventilation systems as a result of the dry climate and high temperatures, and due to the holiday for many returning Jordanians, who normally work in the Gulf states. Table 1 also
Table 1. Annual electricity generation in Jordan during 1994-2008 [15].
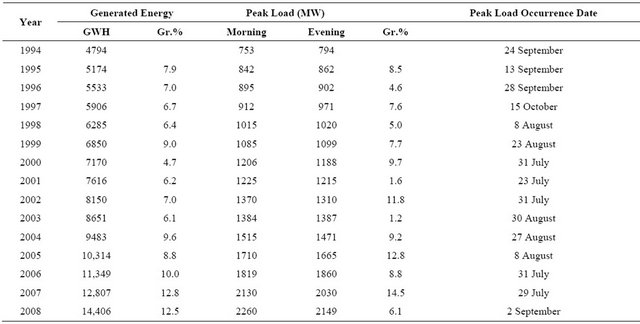
shows that starting from year 2000, the occurrence of the annual peak load shifted from evening (around sunset time) to morning period (11 am-14 pm) except during years 2003 and 2006 where the evening peak was slightly higher than morning peak. This shift is mainly due to technological factor as a result of extension of using the air conditions for cooling in summer instead of ordinary air fans. It is also found that generated energy (in GWh) dramatically increased staring from 2004 until 2008, with the percentage in the last three years of 11.8%. The dramatic increase in generation during this period is probably to demographic factor as a result of population growing and many immigrants from Iraq after the Gulf war II.
Figure 1 presents the monthly morning (MP) and evening (EP) peak loads for 2000 and 2007. As shown in the figure, obvious modification in the demand response in summer of 2007 where MP became dominant comparing with the EP, this response was not seen in 2000 where the EP was dominant except in July/August where MP was slightly higher. During summer of 2007, the MP was higher than EV by 30 - 130 MW. It is also found that during winter of 2007 (December), the EP is almost same as the EP in July of the same year (July) which reflects the influence of environment (cold weather) that result in profusion use of electric heater systems during winter. This behavior was not seen during the year 2000 where the gasoline was the main recourse used for heating. It is worth to mention that following the year 2003, sharp increase in the oil price took place without changing the electricity tariff. Based on historical data, the price of oil barrel raised from $35.2 in 2000 to $38.5 in 2003 to $55 in 2004, $97 in 2007 and to above $100 in 2008. The dramatic increase in oil price reduces the use of oil/ gasoline for space heating during winter, instead the electricity was used.
2.2. The Modification in the Annual Daily Load Curve
The Daily Load Curves (DLC) for winter season (September-March) and summer season (April-September) of 2000 and 2007 is presented in Figure 2. As shown in the figure, a shift of 2 - 3 hours between EP in winter and summer is clearly seen. The shift is mainly due to the shorter daylight period during winter and due to implementation of Daylight Saving Time (DST) through shifting the clocks one hour advance. The comparison between the DLC between summer and winter in both years shows obvious changes in the EP periods while slight changes was seen in the MP periods (MP was higher than EP by 27% in 2000 and 20% in 2007. During 2007, the winter EP was close to summer EP with the maximum recorded values were 2020 and 2030 MW (0.5% difference). The 2020 MW was recorded two times in winter particularly at 17:00 pm on 23rd December and 18:00 pm on 29th December 2007, the 2030 MW occurred at 20:00 pm on 29th July. A comparison with year 2000, the winter evening peak was 1034 MW occurred at 18:00 pm on 20 November while summer evening peak is 1188 MW (14% higher than winter peak) occurred at 20:00 pm on 30th July. Comparing with the year 2000 where the difference between EP is relatively high, the winter and summer evening peak for 2007 were close to each other. This is mainly due to the extension of using the air conditioning systems for heating purpose during winter. A

Figure 1. Monthly peak load in years 2000 and 2007.

Figure 2. The annual maximum DLC for summer and winter of 2000 and 2007 [15].
recent survey studies made by Electricity Regulatory Commission of Jordan (ERC) during year 2007 [16] show that 13% of residential and commercial customers in Jordan use electric apparatus for space heating instead of gasoline during winter.
2.3. Changes in the Relationship between Local Climate and Energy Demand
2.3.1. Morning Peak versus Temperature
Figures 3 and 4 present the relation between the MP load (in MW) (i.e. 10 am-14 pm local time) with daily ambient temperature (in ˚C) during both 2000 and 2007 respectively. As shown in both figures, obvious increase in demand took place at temperatures above a threshold of 20˚C in summer and below 15˚C in winter. The influence of higher temperatures was more pronounced than the effect of lower temperatures in both years. At lower temperatures, pronounced increase in electricity demand was only seen in 2007 comparing with 2000 where the effect was insignificant.
2.3.2. Evening Peak versus Temperature
The daily EP load (y-axis) versus maximum temperature (x-axis) during evening period (~15:00-24:00 pm LT) is presented in Figures 5 and 6 respectively. As shown in both figures, the response was quite different. In 2000, the relation is nearly linear, and no significant increase in demand was observed at lower temperature. During 2007, almost similar effect was seen at higher temperature above 20˚C, and pronounced increase in electricity demand was observed at lower temperature below 15˚C. It is also found that, the increase in the evening demand peak at lower temperature during winter is more pronounced than the effect at higher temperature during summer. The Figures 3-6 indicate the impact of higher and lower ambient temperatures on electricity demand. The results for 2007 show that both cold and warm weather cause high electricity consumption while in 2000, only the warm weather caused an increase in demand. It is worth to mention that, the morning peak in 2000 and 2007 occurred during the week of high temperature particularly between 27-31 July with the space temperature readings were the range between 34˚C - 39˚C in 2000 and 36˚C - 39˚C in 2007. During winter season, the MP occurred on 20th December 2000 of which coincidence with a daytime temperature of 7˚C while in 2007 the MP occurred on 7 February 2007 where the maximum temperature is 5˚C.
These large variations between the responses in 2000 and 2007 are probably due to two reasons the first is the dramatic increase of the oil price in Jordan market that causes the wide use of electric apparatus (i.e. electric heaters and air conditioning) for space heating instead of gasoline. The second reason is the delay in reflection the enhancement in oil price on the electricity tariff. It is worth to mentioning that the national energy pricing plays a vital rule in consumption pattern in Jordan. Planners and decision makers should be careful when applying new tariff in the developing countries such as Jordan where the resources are scarce and try to increase the energy resources.

Figure 3. The MP-load versus ambient temperature during year 2000.
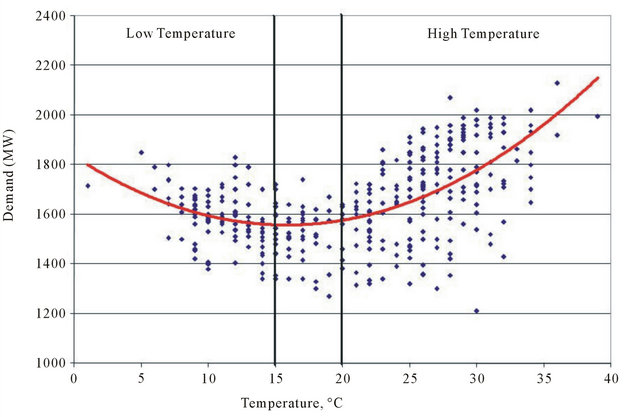
Figure 4. The MP load versus ambient temperature during 2007.
3. Correlation between Electricity Demand and Specific Factors
The relationship between electricity demand and environmental (local climate) and demographic factors has been examined using a multiple regression technique of SPSS. The study covers the period between 2000 and 2007. The dependent variables used in analysis are: the daily maximum loads during both morning and evening peak periods, while independent variables are: the differential temperature (ΔT) above or below a threshold temperature, and the population response during holiday and working day. The threshold temperature was selected to be 20˚C in summer and 15˚C in winter. The ΔT is determined as T − 20˚C in summer and 15˚C − T in winter. The dummy variables (0 or 1) are used to represent the
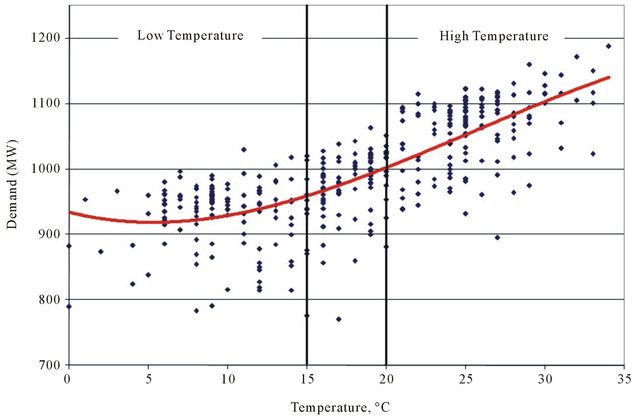
Figure 5. The EP-load versus temperature during year 2000.
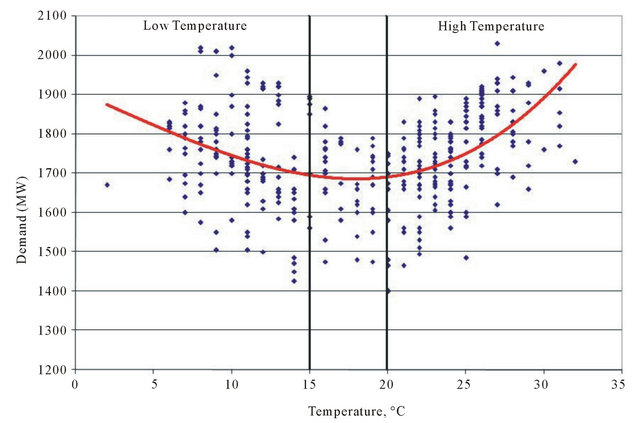
Figure 6. The EP-load versus ambient temperature in 2007.
type of day, where digit 0 means 0% and digit 1 is 100%. For example, in order to determine the variations of electricity demand during Friday which is holiday in Jordan, the day was represented by 1 while the remaining days of the week are represented by 0. Table 2 shows that during the first two weeks of January 2007, the temperature was always less than 15˚C, where ΔT is 5˚C - 9˚C during MP and 4˚C - 9˚C during EP.
The multiple regression test that correlate the MP and EP peak readings in 2000 with the nominated factors is presented in Table 3. The data used in analysis are covering period between 1st June and 23rd of September (~115 days). As shown in the table, the analysis over 115 days in summer shows strong correlation between electricity demand and independent variables in both MP and EP periods.
Table 2. Dependent and independent variables used in regression analysis for two weeks period in Jan. 2007.
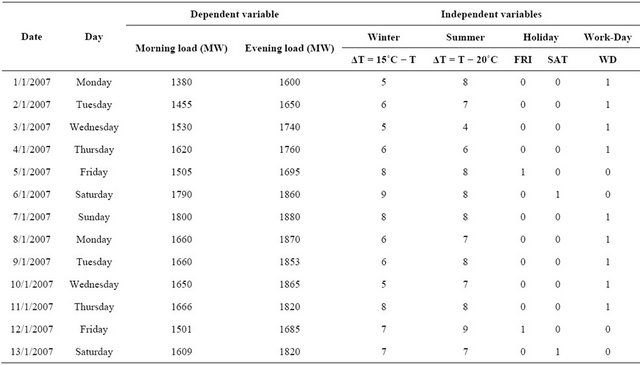
Table 3. The multiple regression test between MP/ EP load readings under high and low ambient temperature during 2000.
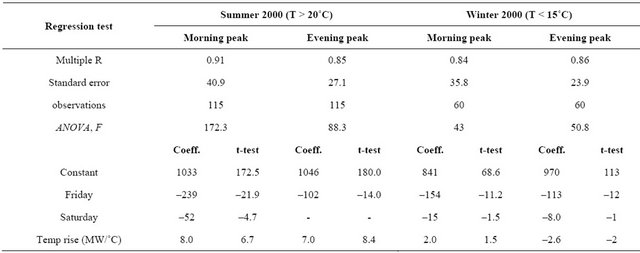
During these periods, the multiple R, standard error σ and ANOVA-F values are 0.91 and 0.85, 40 and 27, and 172 and 88 respectively. The analysis shows an intercept value of 1033 MW and 1046 MW for both MP and EP periods respectively. This intercept is also called “Base Load” and it is subject to change from day to day and season to season. Table 3 also shows that the increase of temperature 1˚C above the threshold of 20˚C may increase the morning and evening peak by 8 MW/˚C and 7 MW/˚C respectively.
On Friday, the morning and evening peak loads would drop 239 MW below the base load for morning peak and 102 MW below the base load of evening peak. On Saturday, the morning and evening peak drop by 52 MW and 6 MW respectively. The regression analysis during winter of 2000 is shown in right side of Table 3, the winter season period was chosen to be the period between 15th January and 15th March (~60 days). The results show strong correlation coefficient between demand and the independent parameters. The multiple R, σ and ANOVA-F during both MP and EP periods in winter were 0.84 and 0.86, 36 and 23, and 43 and 51 respectively. The value of intercept for both MP and EP periods was 841 MW and 970 MW respectively where the “Base Load” during EP is higher by 15.3%. The results also show that a decrease in ambient temperature 1˚C below 15˚C may increase the MP load by 2 MW/1˚C and decreases the EP load by –2.6 MW/1˚C. The reduction in electricity demand during EP period of winter in year 2000 is probably due to narrow use of electricity for space heating purpose, instead the gasoline was used for this purpose. It is also found that the electricity demand during Friday and Saturday dropped by 154 and 15 MW during MP period and by 113 and 8 MW during EP. The drop in electricity demand during holiday was 18.3% and 11.6% during Friday, and 1.8% and 0.8% during Saturday.
The correlation between both morning and evening peak loads and independent variables (the ambient temperature that is above 20˚C and type of day) during the summer season of 2007 is presented in Table 4. The analysis was made over 122 observation days (period between 1st June and 30th September). Similar to the results in 2000, strong correlation between electricity demand and ambient temperature was obtained where the multiple R, σ and ANOVA-F values during MP and EP periods were 0.89 and 0.80, 78 and 64, and 144 and 66 respectively. The value of base load during MP and EP periods in summer was nearly same with values of 1724 MW for morning peak and 1712 MW for evening peak. The table also shows that on Friday the MP and EP are dropped by 377 MW and 166 MW respectively which represents 23% and 10% of the base load. On Saturday, the MP and EP dropped by 53 MW and 0 MW which represents a percentage of 3% and 0% respectively. It is also seen that 1˚C above 20˚C will increase the load by 21.4 MW/˚C during MP period and 20.4 MW/˚C during EP period.
The relation between both MP and EP loads during winter of 2007 is presented in right side of Table 4. The analysis is made over 60 observation days during cold winter (between 1st January and 30th March). As shown in the table, strong correlation between electricity demand and ambient temperature was also seen with multiple R, σ and ANOVA-F values for both MP and EP periods are 0.85 and 0.82, 62 and 57, and 48 and 37 respectively. The values of intercept (base load) were 1402 MW and 1727 MW respectively showing a difference of 324 MW which represent a percentage of 23%. On Friday of winter season, the regression analysis shows that both MP and EP are being dropped by 169 MW and 195 MW respectively while on Saturday the MP was only increased by 22 MW while no affect on the EP value (0 MW). The results also show that the decrease of temperature 1˚C below 15˚C during winter would increase the morning peak by 16.7 MW/˚C and evening peak by 22.9 MW/˚C.
4. Summary
The paper highlights the modification of electricity demand in Jordan during the last decade and the variations of the load between summer and winter seasons and the day to day load variations.
The paper examines the relationship between electricity demand and climate/non-climate related factors using statistical regression analysis. The environmental (ambient temperature), demographic (population growth and response during holiday and working days), policy (energy pricing) and technological factors (introducing new electric apparatus) are the main factors affecting the consumption pattern in Jordan. The variations occurred in
Table 4. The multiple regression test for the electricity demand under high and low atmospheric temperature during summer and winter of 2007.

the electricity demand over the period 1994-2008 are summarized by: Shifting in the peak load occurrence from evening to morning period, Modification in the annual daily load curve (consumption pattern) especially in winter season, variation in relationship between space temperature and demand especially in winter (High energy demand caused by low temperatures was not seen before, and dramatic increase in electric generation after year 2003. This shift in peak load is mainly due to technological factor as a result of wide use of the air conditions in houses, services and government offices for cooling in summer instead of ordinary air fans. The variations in consumption pattern between 2000 and 2007 are mainly associated with economic, social and demographic factors. It is found that high demand at lower space temperature is governed by introducing new appliances for heating in winter as a result of low electricity pricing comparing with gasoline price. The dramatic increase in electric generation after 2003 is probably due to demographic factor as a result of population high growth after the Gulf war II. The regression test correlates the daily maximum loads in morning and evening periods with the differential temperature (ΔT) above 20˚C threshold in summer and below 15˚C threshold in winter, and population response during holiday and working day. The attained coefficients are the drop/increase in MW on holiday to working days and the impact of differential temperature on specific consumption MW/˚C. The results show pronounced changes in 2007 to 2000 responses, Results show that a decrease of 1˚C below 15˚C threshold in winter increases the morning demand by only 2 MW/˚C in 2000 and 16.7 MW/˚C in 2007, and it decreases the evening peak in 2000 by –2.6 MW/1˚C and increased evening peak by 22.9 MW/1˚C in 2007. Results also show that the national energy pricing plays a vital rule in consumption pattern in Jordan. Planners and decision makers should be careful when applying new tariff in the developing countries such as Jordan.
REFERENCES
- E. Arsenault, J. T. Bernard, C. W. Car and E. GenestLaplante, “A Total Energy Demand Model of Quebec,” Energy Economics, Vol. 17, No. 2, 1995, pp. 163-171. doi:10.1016/0140-9883(94)00003-Y
- J. A. Zarniko, “Re-Examination of the Causal Relationship between Energy Consumption and Gross National Product,” Journal of Energy and Development, Vol. 21, No. 2, 1997, pp. 229-239.
- M. Beenstock, E. Goldin and D. Nabot, “The Demand for Electricity in Israel,” Energy Economics, Vol. 21, No. 2, 1999, pp. 168-183. doi:10.1016/S0140-9883(98)00005-X
- M. A. Shuvra, M. M. Rahman, A. Ali and S. KhanI, “Modeling and Forecasting Demand for Electricity in Bangladesh: Econometrics Model,” International Conference on Economics, Trade and Development, Vol. 7, 2011, p. 74.
- C. J. Cleveland, R. K. Kaufmann and D. I. Stern, “Aggregation and the Role of Energy in the Economy,” Ecological Economics, Vol. 32, No. 2, 2000, pp. 301-317. doi:10.1016/S0921-8009(99)00113-5
- J. R. Cancelo, A. Espasa and R. Grafe, “Forecasting the Electricity Load from One Day to One Week Ahead for the Spanish System Operator,” International Journal of Forecasting, Vol. 24, No. 4, 2008, pp. 588-602. doi:10.1016/j.ijforecast.2008.07.005
- D. H. Rosenthal, H. K. Gruenspecht and E. A. Moran, “Effects of Global Warming on Energy Use for Space Heating and Cooling in the United States,” The Energy Journal, Vol. 16, No. 2, 1995, pp. 77-96. doi:10.5547/ISSN0195-6574-EJ-Vol16-No2-4
- A. F. Colombo, D. Etkin and B. W. Karney, “Climate Variability and the Frequency of Extreme Temperature Events for Nine Sites across Canada: Implications for Power Usage,” Journal of Climate, Vol. 12, No. 8, 1999, pp. 2490-2502. doi:10.1175/1520-0442(1999)012<2490:CVATFO>2.0.CO;2
- C. Cartalis, A. Synodinou, M. Proedrou, A. Tsangrassoulis and M. Santamouris, “Modifications in Energy Demand in Urban Areas as a Result of Climate Changes: An Assessment for the Southeast Mediterranean Region,” Energy Conversion and Management, Vol. 42, No. 14, 2001, pp. 1647-1656.
- P. R. Shukla, R. Nair, M. Kapshe, A. Garg, S. Balasubramaniam, D. Menon and K. K. Sharma, “Development and Climate: An Assessment for India,” UNEP Collaborating Centre on Energy and Environment (UCCEE), Roskilde, 2003.
- M. Bessec and J. Fouquau, “The Non-Linear Link between Electricity Consumption and Temperature in Europe: A Threshold Panel Approach,” Energy Economics, Vol. 30, No. 5, 2008, pp. 2705-2721. doi:10.1016/j.eneco.2008.02.003
- A. Henley and J. Peirson, “Non-Linearities in Electricity Demand and Temperature: Parametric versus Non-Parametric Methods,” Oxford Bulletin of Economics & Statistics, Vol. 59, 1997, pp. 149-162. doi:10.1111/1468-0084.00054
- B. E. Psiloglou, C. Giannakopoulos, S. Majithia and M. Petrakis, “Factors Affecting Electricity Demand in Athens, Greece and London, UK: A Comparative Assessment,” Energy, Vol. 34, No. 11, 2009, pp. 1855-1863. doi:10.1016/j.energy.2009.07.033
- J. O. Jaber, M. S. Mohsen, S. D. Probert and M. Alees, “Future Electricity Demands and Green House-Gas Emissions in Jordan,” Applied Energy, Vol. 69, No. 1, 2001, pp. 1-18. doi:10.1016/S0306-2619(00)00068-4
- NEPCO, “National Electric Power Company Annual Report,” 2008.
- ERC, Electricity Regulatory Commission of Jordan, Technical Study, 2007.