Open Journal of Modern Hydrology
Vol.3 No.1(2013), Article ID:27247,5 pages DOI:10.4236/ojmh.2013.31007
Simulation and Prediction on Space-Time Distribution of Water Quality in Dianchi Lake
![]()
MOE Key Laboratory of Metallogenic Prediction of Non-Ferrous, Central South University, Changsha, China.
Email: renjunqiuhappy@163.com
Received October 11th, 2012; revised November 23rd, 2012; accepted December 12th, 2012
Keywords: Dianchi Lake; Water Quality, Space-Time Distribution; Simulate; Space-Time Semivariogram
ABSTRACT
It is very important in pollution treatment to clarify the space-time distribution of water quality in Dianchi Lake. Based on the sample data obtained from 10 observation stations every month from 2008 to 2009, it uses space-time semivariogram and ordinary kriging method to simulate the space-time variance and distribution of water quality indictors (TN, TP, BOD, CODMn, DO, Chlorophyl-α, etc.). Because the space-time semivariogram also has a certain of extrapolation function. From the simulation results, the pollution is mainly concentrated at the North (Caohai) and the Southwest area (Haikou), and water pollution has a increase trend.
1. Introduction
As the biggest plateau lake in Yunnan, the Dianchi Lake supplies water for production and life in its valley and Kunming city, and takes the burden of regulate the regional climate in the past few years, with the development of social economy, the pollution in Dianchi Lake has becoming serious. However,the water treatment did not make much progress. There are many researches on the pollution controlling of Dianchi Lake. Most of the them emphasize on analysis of single index or inspecting the changes of water quality indexes in divided region, but not from the aspect of space. These researches focus on the application of deterministic equation or use the randomness model and theories which lack the unification of determinacy and randomness. Based on the theory of geostatistics, this paper build the geospatial distribution speculation model of water quality by using the methods of variant function and ordinary kriging, and studying the geospatial change and relativity of geospatial variants. The model can simulative speculate the geospatial changes of water quality of Dianchi Lake, and provide scientific proof for the management of Dianchi Lake.
2. Data Collection and Pre-Procession
The Dianchi Lake lies in the middle of the YunnanGuizhou Plateau, with an area of 300 km2, average water depth of 4.4 m and the deepest depth is 10 m, water storage of 1.29 billion m3, water capacity of 1.57 billion m3. It is at the watershed area of three big water systems such as Yangtze, Honghe and Zhujiang. and it has some characters such as small area, small water volume, no supply of passing-by water, continuous raining, warm climate, long term sunlight, big evaporation, etc [1].
The data of water quality in this article are from the monitoring data in 2008 and 2009 from 10 monitoring stations in Dianchi Lake (2 of them in Caohai and 8 of them in Waihai). Generally speaking, most water indexes are in line with the principle of normal distribution. With the principle, the collected data was processed and classified. The log of all kinds of index data is taken and the acquired normal distribution map has two peak values, which means that the data is from two sources. Considering the water of Caohai and Waihai of Dianchi Lake, they almost don’t flow to each other, namely two different water systems, so they are studied separately. By using the data of Waihai as an example, after taking out the data of two monitoring stations of Caohai.
The six indexes are complying with normal distribution much nearly. However, only the TP has a little bad result. But it complies with the selection principle basically.
The data is deleted which is obviously wrong (accidental error). The very few lacking data can be filled out with the arithmetic mean value of two surrounding data on the condition that there will be no effects on general data.
3. The Establishment of Space-Time Distribution Predicting Model
The time-space change of water quality indexes has the unification between designability and randomicity, which is a difficulty for studying on the time-space changes of water quality. To solve the problem, the geostatistics was introduced. One of the important tools on geostatistics is variant function. It can show the spatial designability of regional variants and its ramdomicity. The steps of timespace distribution prediction model are as follow:
1) Because the studies on time-space distribution of water quality of Dianchi Lake do not only focus on spatial but also time change, so extending variant function to time and space and adding time parameter to get the time-space variant function:

where hs refers spatial delay, ht refers time delay, and  refers the change variable of spatial location s and time t.
2) The hs and ht are both assumed as 0 and the two variant functions are got: the time variant function , and space variant function
 .
.
3) According to the spherical model, the drill base of theoretical boundary variation function can be fitting out. The three parameters including drill base C0, arch high value C and variation A, which are showed in Table 1.
4) By using the three parameters above, the theoretical variant function can be got. The time variant function map and space variant function map can be got by overlaying the maps of theoretical variant function and real variant function. Dissolved oxygen is taken as an example.
5) On the basis of boundary variant function, the sumof-product model is defined as follows:

where
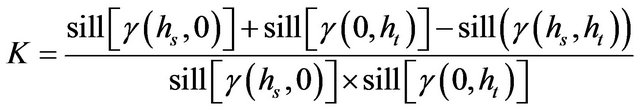
Table 1. The table of boundary variation function model parameters.
 and the K must meet the sufficient and necessary conditions
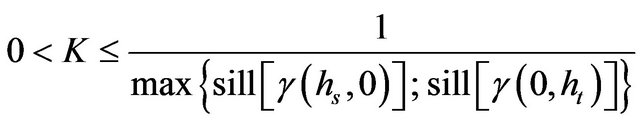
The sill is the drill base of theoretical boundary variation function.
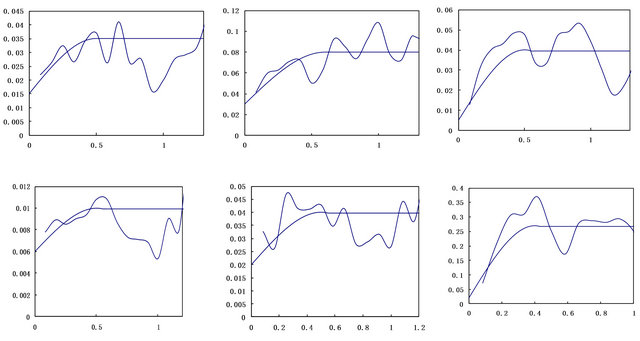
6) By using the time boundary variant function and space boundary variant function, the curved surfaces of theoretical model and real model of the time-space distribution (dissolved oxygen as an example) are created and shown in Figure 1.
7) The real time-space variant map can be got after overlaying. The boundary variant function maps and time-space variant function of the 6 water quality indexes of Dianchi Lake are shown in Figure 2.
It can be known from Figure 2 that the spatial boundary variant function has a bad fitting while the time boundary variant function has a good fitting with obviously higher arch height and better continuity. It means that the time variant principle of water quality index is more obvious than the space variant principle.
8) On the basis of time-space variant function, the ordinary Kriging can estimate it inside its time and space [2]. Then the equitation set of calculating Kriging parameter can be obtained

where 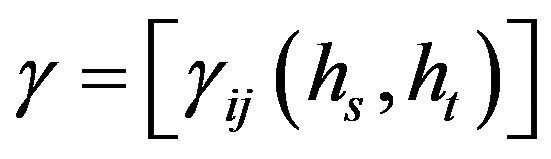 is
is  matrix composed of
 . and
. and  is time space variant function value determined by time-space gap between timespace points i and j. The
  is
is  matraix
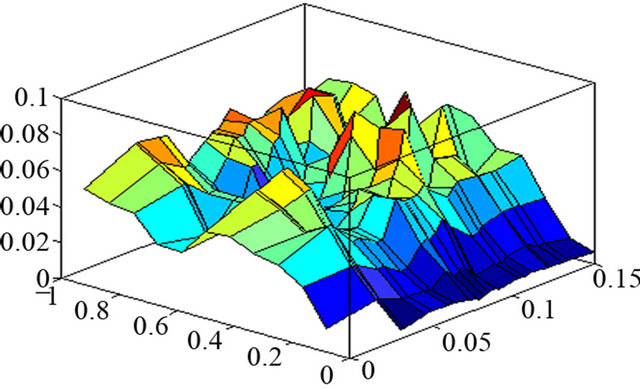

Figure 1. Curved surfaces of theoretical model and real model of the time-space distribution.

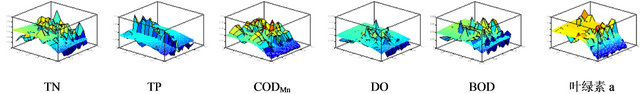
Figuer 2. The boundary variant function maps and time-space variant function of the 6 water quality indexes of Dianchi Lake.
composed of . and
. and  is time space variant funcation value determined by time-space gap between time space points i and to-be-estimated point. The I is
  unit matrix and
 ,
, .
.
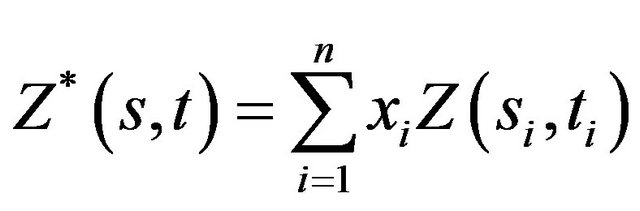
9) After acquired the Kriging parameter , the estimated value can be calculated by substituting it into the formula
4. The Result and Discussion of the Application in the Temporal and Space Distribution Model
4.1. The Simulation of the Temporal and Space Distribution of the Water Quality of Dian Lake
Use common Kriging to figure out the other unknown temporal and space point data on the process of computing, the Step length of the time-domain is 0.833 year (a month), the tolerance is 0.417 year (15days); and the step length of the spatial-domain is 0.005 (about 500 m), the tolerance is 0.0025 (about 250 m). From the result of the calculations, it can be seen that the range of the space variation functions is about 0.1 and the range of the time boundary variation functions is about 0.5 years (6 months). Through the visualization of expression of the program, it could simulate of the water quality of Dian Lake. The coldest and the hottest months of Dian Lake watershed are June and July respectively. With a quarter for time interval, select January, April, July and October as the time feature points to simulate the temporal and spatial distribution of Dian Lake’s water quality.
4.2. The Simulated Results of Cross Test
Cross test the observation and the estimate value of the 6 index through SPSS software, and the results are as follows: the cross validation coefficient of the total Nitrogen (0.70), Hypermanganate (0.76) and Chlorophyll-a (0.70) which are all above 0.70 and have good credibility. The cross validation coefficient of dissolved oxygen (0.53) and Biochemical oxygen consumption (0.53) which are only above 0.5, but below 0.6, so the credibility is not high. Phosphorus (0.382) is lower than 0.5 and the credibility is low. It is mainly because that the source is not the same matrix phosphorus. Generally speaking, in addition to the TP, the product-and theoretical model temporal and space variation functions of this paper is acceptable. It better reveals the drinking water quality indexes and the temporal and space changes between law, and the Kriging estimate is credible.
4.3. The Discuss of the Simulation Result
From the figure we can see that the pollution situation of 2009 is more serious than the status of 2008, it shows that the situation of the Dian Lake is still the pollution is bigger than curation.
TN: From the changes it can see that in the year of 2009, there are four time points each quarter when the content of total nitrogen is higher than the year of 2008, especially on July 15th the nitrogen content near the Ash Bay rose to two to three times than usual and the nitrogen pollution extends to the east coast. In the rainy season of July and August the rain brought the nitrogen into Dian Lake and caused the rise of the nitrogen content in the east. From the distribution of the TN it can see that the nitrogen pollution of Dian Lake is mainly in the north and west, and in the east it is also getting serious, but it is better in the south and central. The main reason is that the northern part is near the grass sea, and the west is near the seaport, which accept municipal sewage and industrial wasting water, the east coast distribution a lot of farmland, the rain rushed the nitrogen element into the lake. Because of the rain, the effects of the pollution change presented a seasonal characteristic, which conforms to the actual situation of Dian Lake.
TP: Due to the less number of the observation station and the uneven distribution, the simulation is not very good and has certain errors. The correlation coefficient calculated from SPSS is too low and the credibility of the simulation is not high. Simulation conditions are for reference only, it will not be discussed here.
CODMn: From the changes, it can be seen that reducible pollutant presents the overall trend, only certain areas are coming down. The seaport area is rising remarkably and the east part of Dian Lake is getting better. The reducible pollutants are mainly come from industrial pollution, and mainly change according to the industrial pollution source. The reason of the change maybe related to the production peak season of the industrial pollution source companies.
DO: The changes from 2008 to 2009 show that the area of Guanyinshan in the west of Dian Lake and Luojiaying in the east has larger variety, and the dissolved oxygen can recover in a short time, but the other part is not like this. This shows us that the quality of the water in the west of Dian Lake is better and their self cleaning capacity is stronger, however, the quality of the water of other parts is worse and their self cleaning capacity is weaker.
BOD: The changes show that it is a rising trend from 2008 to 2009, it means that compare to 2008 the organic pollutant is increasing and the pollution is moving to south. From the distribution situation it can see that the organic pollutant of the Dian Lake is opposite to the dissolved oxygen, it fits the theory. The pollution is mainly at north and the central of Dian Lake. The east and south is better where the highest point of BOD is in summer and at autumn this maybe related to the water bloom break out.
From the changes of the Chlorophyll-a, it can see it is higher in summer and at autumn but lower in spring and winter. This is because the summer and autumn climate suits algae and other algae growth, resulting in a large number of water bloom break out. From the distribution situation it see that the Chlorophyll-a high content in the Dian Lake area focus on north and northeast and the seaport, the main reason is the north and the seaport near the living area and industrial zone, came in for a lot of life and industrial pollution, the northeastern coast of Dian Lake near DouNa shelter flower planting base, too much fertilizer, make the area eutrophication level for all kinds of algae, serious growth provides favorable conditions.
5. Conclusions
In this paper, by using the data of 10 observation stations in Dian Lake area, and using emporal and space variation functions and ordinary Kriging method of water quality, and do cross examination with SPSS software, determined the credibility of the Kriging estimate method. Some conclusions on the research of the temporal and space distribution model of Dian Lake are as follows:
1) We get the data of 6 kinds of water quality index named TN, TP, BOD, CODMn, DO and Chlorophyll-a including every month from 2008 to 2009.
2) Use the geological statistics theory as a foundation, application variation analysis function 6 indexes variation law of space and time, and connecting with the ordinary Kriging, the method to estimate made time and space distribution. At the same time, the article also establishes a forecasting model, and achieves the prediction of the Dian Lake water quality of the distribution of the temporal and spatial distribution.
3) From the simulative situation, it has been observed that Dian Lake is still in serious pollution. The polluted area mainly concentrated in the north near Caohai, the southwest of Dian Lake at the seaport and the eastern coast areas. The serious pollution in the north and in the southwest is the mainly caused by the life and industrial pollutions, which means that the life and industrial pollutions are not under control and the east coast of Dian Lake has a lot of intensive agriculture (such as DouNan flower planting base), the pollutions are mostly from the agriculture, because of the rain the pollution shows seasonal.
REFERENCES
- H. Q. Sun, “Geostatistics and the Corresponding and Its Application,” University of Mining and Technology Press, Xuzhou, 1990.
- T. Fang, H. Y. Ao, J. T. Liu, et al., “The Spatio-Temporal of Water Environmental Status in Dianchi Lake,” Acta Hydrobiologica Sinica, Vol. 28, No. 2, 2004, pp. 124-130.