World Journal of Condensed Matter Physics
Vol.4 No.3(2014), Article
ID:49395,13
pages
DOI:10.4236/wjcmp.2014.43020
Effective Thermoelectric Power Generation in an Insulated Compartment
Harkirat S. Mann1, Yosyp Schwab1, Brian N. Lang1, Jarrett L. Lancaster2, Ronald J. Parise3, Giovanna Scarel1*
1Department of Physics and Astronomy, James Madison University, Harrisonburg, USA
2Department of Nano-Science at the Joint School of Nano-Science and Nano-Engineering (JSNN), University of North Carolina at Greensboro and North Carolina A&T University, Greensboro, USA
3Parise Research Technologies, Suffield, USA
Email: *scarelgx@jmu.edu
Copyright © 2014 by authors and Scientific Research Publishing Inc.
This work is licensed under the Creative Commons Attribution International License (CC BY).
http://creativecommons.org/licenses/by/4.0/


Received 5 May 2014; revised 11 June 2014; accepted 5 July 2014
ABSTRACT
The Seebeck coefficient  is a temperatureand material-dependent property, which linearly and causally relates the temperature difference
  between the “hot” and “cold” junctions of a thermoelectric power generator (TEC-PG) to the voltage difference
 . This phenomenon is the Seebeck effect (SE), and can be used to convert waste heat into usable energy. This work investigates the trends of the effective voltage output
  and effective Seebeck coefficient
  versus several hours of activity of a solid state TEC-PG device. The effective Seebeck coefficient
  here is related to a device, not just to a material’s performance. The observations are pursued in an insulated compartment in various geometrical and environmental configurations. The results indicate that the SE does not substantially depend on the geometrical and environmental configurations. However, the effective Seebeck coefficient
  and the produced effective
  are affected by the environmental configuration, once the temperature is fixed. Heat transfer calculations do not completely explain this finding. Alternative explanations are hypothesized.
Keywords:Thermoelectric, Heat Conduction, Energy Harvesting

1. Introduction
Imagine two dissimilar electrical conductors or semiconductors joined in two different locations with the “hot” junction at temperature , and the “cold” junction at
 . Such device is a thermoelectric power generator (TEC-PG), and the schematic illustration of the basic unit of a TEC-PG is shown in Figure 1(a). Solid state (above millimeter size) TEC-PGs devices used in applications consist of several of such units placed in series. The Seebeck effect (SE) in the TEC-PG is a known phenomenon in which the temperature difference
  caused by heat generates a voltage difference
  due to the flow of charge carriers (electrons or holes) from the “hot” junction in contact with a thermal source, to the “cold” junction, which acts as a thermal sink. In the SE, at constant temperature,
  and
and  are causally and linearly related through the Seebeck coefficient
 , such that
 . Voltage production in the TEC-PG is referred to as TEC power generation [1] [2] . The spin SE [3] , transverse SE [4] , and anisotropic SE [5] , discussed in recent literature, are examples of TEC power generation. Heat is intended as the manifestation of kinetic energy [6] transmitted by the thermal source to the neutral particles of the alumina-ceramic plate protecting the “hot” junction of the TEC-PG. Temperature witnesses the trends of kinetic energy. Heat is transferred by convection and conduction to the “hot” junction of the TEC-PG, and contributes to the generation of the temperature difference
 . The temperature difference
 , in turn, generates the voltage difference
  according to the SE. Given that no, or very few, charged particles are involved, radiative heat transfer is minimal in the experiments presented here. The applications of TEC power generation are numerous: thermal sensors [2] [7] , spacecraft heat engines and deep-space probes [1] [2] [7] , laser temperature controllers [7] , thermal cyclers for biological testing [7] , health [1] [2] and vehicle climate controls [1] [2] [7] [8] , coolers [7] , and cooling of electronic enclosures [1] [2] [7] . Although controversies arose regarding the ability of research efforts to improve the efficiency and performance of the TEC-PGs [7] [8] , TEC power generation is still proposed for additional and larger-scale applications which require materials with large TEC parameters, such as the figure of merit
  [1] [2] [7] , and the Seebeck coefficient
 . In the expression for
 ,
,  is the thermal conductivity and
  the electrical resistivity. Under the assumption that the TEC parameters have a fixed value in a particular material and device, the design of the material and its composition are considered the most important factors in improving the performance and efficiency of the TEC-PGs [1] -[3] [7] -[9] . Recently, also band-engineering was shown to enable improvements in the TEC-PG’s performance [4]. In the case of miniaturized (around nanometer size) TEC-PGs with thin films as active layer, the film substrate was shown to influence the Seebeck coefficient
  [10] . This work focuses on the application of solid state TEC-PG devices as energy harvesting [1] [2] [8] [11] -[13] , and waste heat recovery devices [7] [8] [14] [15] . For these applications, the effective voltage output
  and the effective Seebeck coefficient
  are characterized versus time in various geometrical and environmental configurations for commercial solid-state TEC-PG devices consisting of several basic units placed in series. The effective Seebeck coefficient
  refers to a device, not just to a material’s performance, and relates the effective temperature difference
 , measured over time between the “hot” and “cold” junctions, and the effective voltage output
 , such that
 . Five different geometrical and environmental configurations are considered in the presented investigation: three geometries, two different “hot” junction finishing surfaces, and two sample holder materials, one insulating and one conducting. The investigation is performed in an insulated compartment to avoid the contributions to the effective
 ,
,  , and
, and  of random variations of laboratory temperature, humidity, and radiation. The insulated compartment promotes small fluctuations and low errors in the measurements. The details of the geometrical and environmental configurations are described in Section 2. The findings, described in Section 3, suggest that the effective
  and
and  are bound by a causal and linear relationship. However, the effective
  and the effective Seebeck coefficient
  are slightly affected by the specific geometrical and environmental configuration, in particular by the materials of the sample holder. Heat transfer calculations are unable to completely explain this phenomenon. An explanation is offered by observing that the experimental set-up involving the solid state TEC-PG device can be treated as system of two capacitors in series.
2. Experimental Set-Up and Data Analysis
The heat source used is a Corning Hot Plate Scholar 170. The instrument has a temperature range of 25˚C - 300˚C, and is located in a custom-made insulated compartment constructed of 1.27 cm thick extruded acrylic sheets. The insulated compartment is purged with a flux of N2, which is kept at a steady flow by suction. The temperature of the hot plate during the experiment is .
. 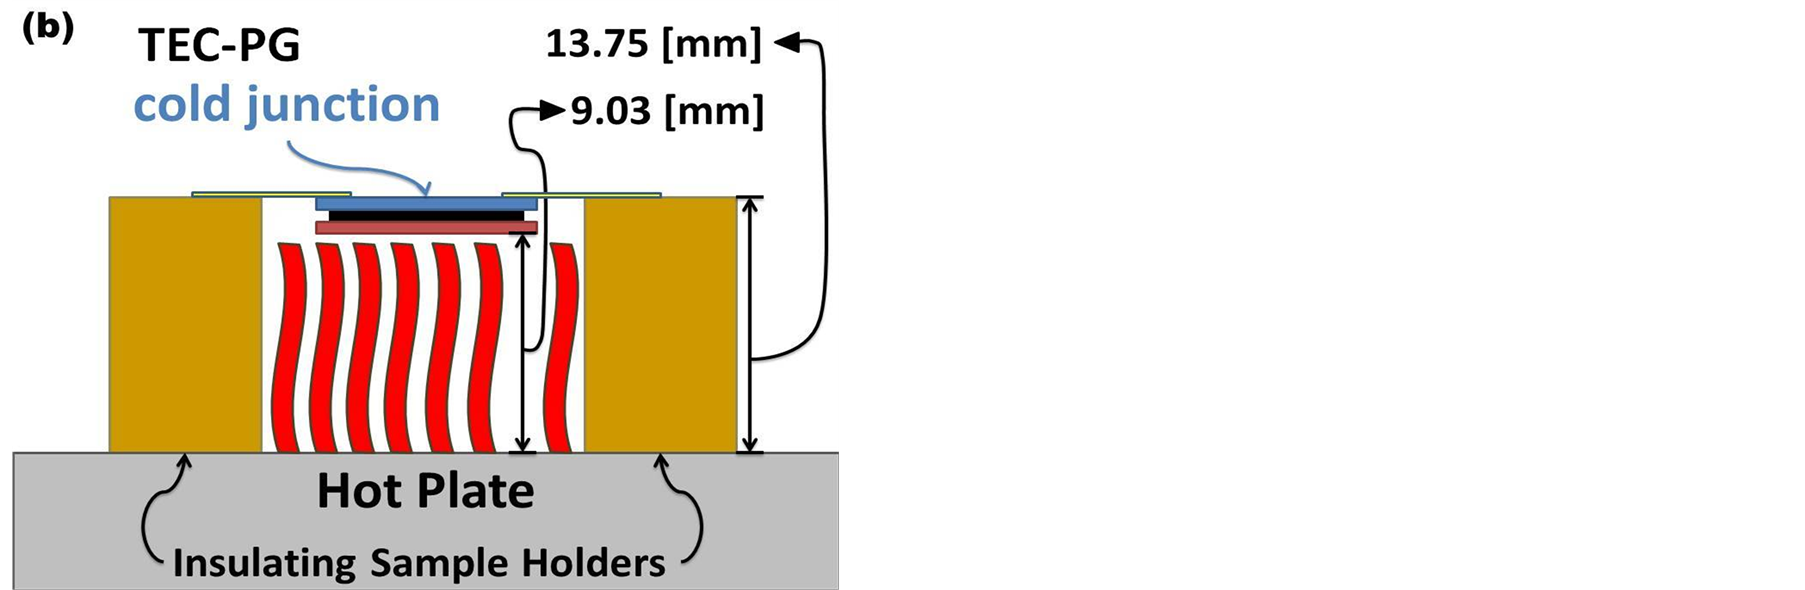
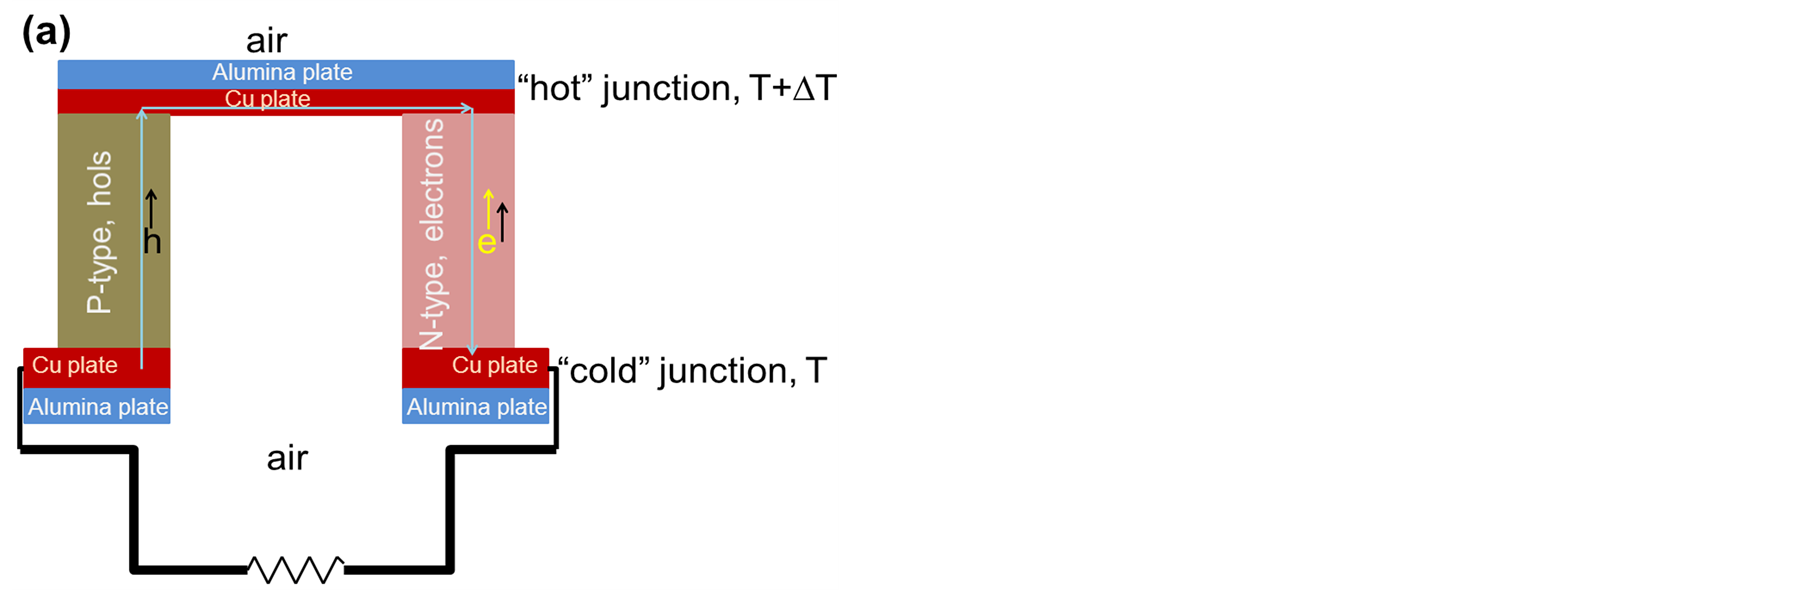
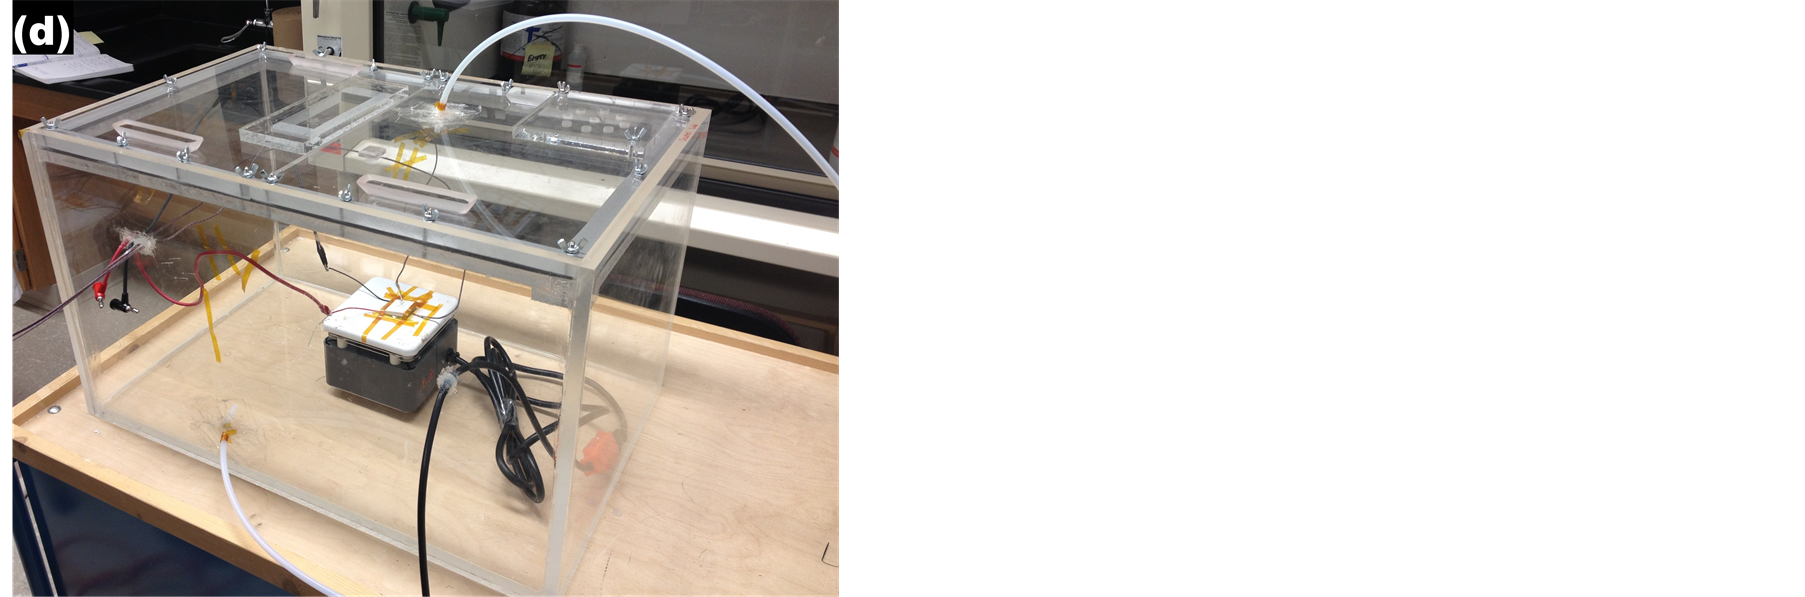
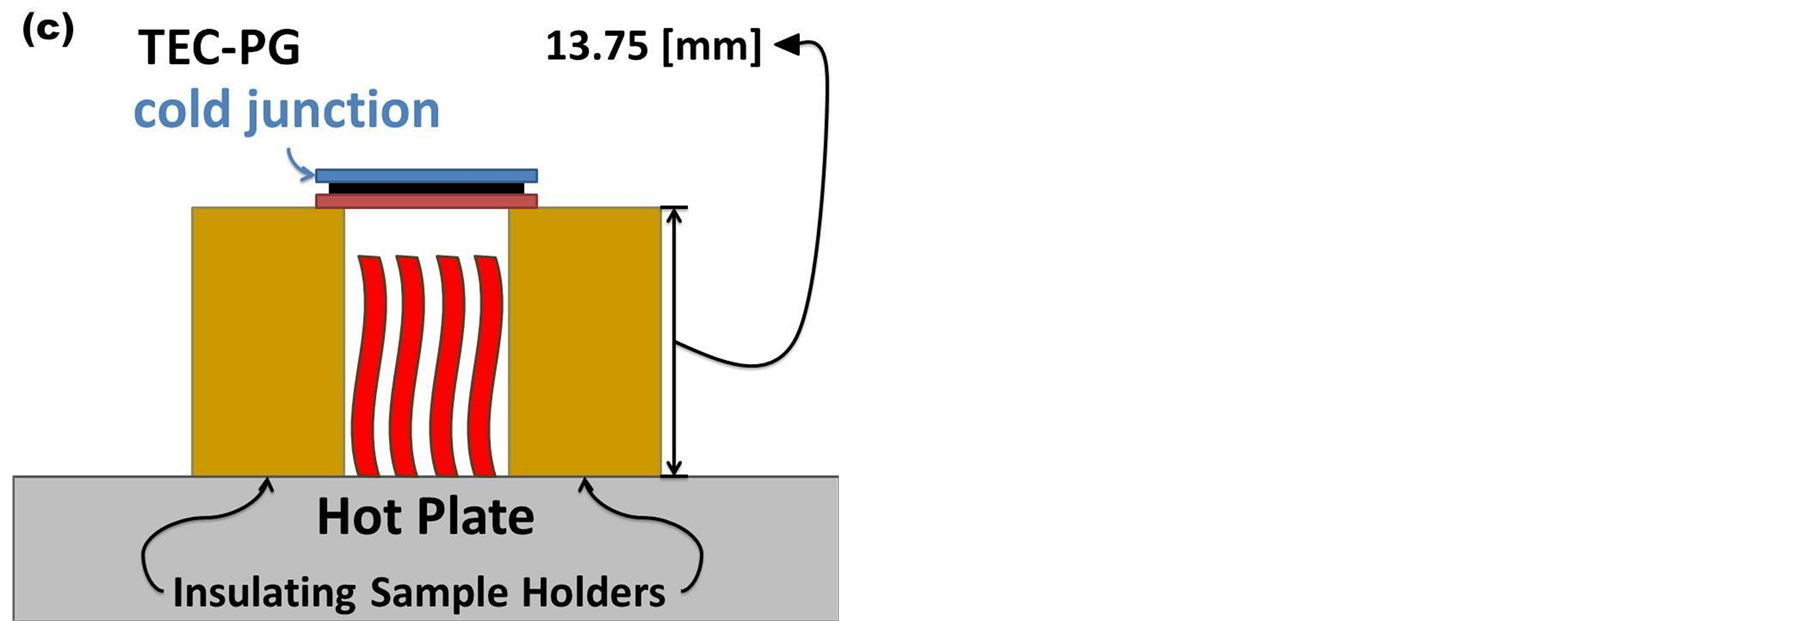
Figure 1. (a) Schematic illustration of the basic unit of the TEC-PG; (b) The “away” horizontal configuration; (c) The “toward” horizontal configuration; (d) Photograph of the isolated compartment.
 and
and , respectively. The junctions are separated along the vertical direction by 4 mm high pillars of an nand p-doped Bi2Te3-based alloy in series with each other, and by copper (Cu) plates. There are 142 of such pillars in the used solid state TEC-PG devices. In all measurements, the “hot” junction of the solid state TEC-PG device is placed parallel to the surface of the hot plate, which uniformly heats the junction. Thermally insulating sample holders made of wood are used to properly position the solid state TEC-PG devices on the hot plate, as illustrated in Figure 1(b) and Figure 1(c). A picture of the insulated compartment is shown is Figure 1(d). To examine the behavior of the effective
  and
and  with time, two geometrical configurations were considered: the “away” horizontal and “toward” horizontal. In these configurations, the hot plate is in horizontal position inside the insulated compartment as in Figure 1(d). In the “away” horizontal configuration, depicted in Figure 1(b), the solid state TEC-PG device is suspended above the hot plate through tape connected to the thermally insulating sample holder, and is in contact with neither the sample holders nor the hot plate. In the “toward” horizontal configuration, pictured in Figure 1(c), the solid state TEC-PG device is physically supported by the thermally insulating sample holders above the hot plate surface. An additional geometrical configuration was considered: the “toward” vertical, which is the “toward” horizontal configuration rotated by 90˚. Furthermore, two additional environmental configurations were examined: 1) the “toward” horizontal-black tape configuration, in which a layer of black electrical tape was placed in adhesion to the surface of the “hot” junction of the solid state TEC-PG device; and 2) the “toward” vertical-aluminum supports configuration, in which the thermally insulating sample holders were substituted with thermally conducting ones, made of aluminum (Al). To measure the effective temperatures
  and
and , OMEGA type E Ni-Cr/Cu-Ni thermocouple probes were used. The probes are sensitive to temperatures from ‒270˚C to 1000˚C. One probe was placed on the alumina-ceramic plate protecting the “hot” junction, and the other one on the plate protecting the “cold” junction. The average difference in the temperature detected by the two probes are
  and
and , measured on the alumina-ceramic plate on the “hot” junction in the “away” horizontal and “toward” horizontal configurations, respectively. In all configurations, it was verified that the hot plate uniformly heats the “hot” junction. The trends of
 ,
,  , and
, and  were collected using Keithley 2000 multi-meters. Each multi-meter is sensitive to direct current voltages from 1 mV to 1 kV, and to the same temperature range as the range of sensitivity of the chosen thermocouple probes. The data were collected for 30 hours (h) at time intervals
  of 300 s using Lab View 7, and a National Instruments PXI-1042q communications chassis. Before turning-on the hot plate, the solid state TEC-PG device and the thermocouple probes relaxed in the insulated compartment for 5 - 6 hours. This time range is named Region 1. In the 400 s time segment immediately following the turning-on of the hot plate, a
  of 1 s was selected for the data acquisition. Afterwards, the hot plate was kept on for the remainder of the experiment. This time range is named Region 2. In all experiments, the temperature of the ambient inside the insulated compartment, and the temperature of the sample holder were
 . The laboratory hosting the instrumentation was kept dark and at a constant temperature of 20˚C. The data were analyzed using Origin Pro Data Analysis and Graphing Software. The variation effective Seebeck coefficient was derived as
  in the time interval in Region 2 where steady state was achieved. The fitting of the
  and
and  curves was performed in the 400 s time segment in Region 2 immediately following the turning-on of the hot plate. A linear fit was employed, such that
 , and
, and , respectively. Here,
  and
and  are the initial offsets, while
  and
and  are the rate of increase of
  and
and  with time, respectively. The goodness of fitting parameters
  and
and  qualify the accuracy of the procedure.
3. Results
Figures 2(a)-(c) show the trends of ,
,  and
and  in the in the “away” horizontal configuration. The values of mean
 , standard deviation
 , and relative error
  of
of ,
,  , and
, and  are summarized in Table1 Figure 2(a) and Figure 2(b) clearly show that
  and
and  follow the same trends in both Regions 1 and 2. The step between Regions 1 and 2 corresponds to the turning-on of the hot plate. The average value of the effective Seebeck coefficient
  in the steady state portion of Region 2 is
  . The negative mean value of
  agrees with electrons flowing through the 142 basic TEC-PG units to explain the effective
  production [2]. Table 1 indicates that the values of
  and
and  in Region 2 are of the same order of magnitude for
 ,
,  and
and . Only the
  value for
  is one order of magnitude lower than that for the effective
  and
and . The results are reproducible, and fully testify the existence of a causal and linear relationship between
  and
and , in agreement with the SE, such that
 .
. 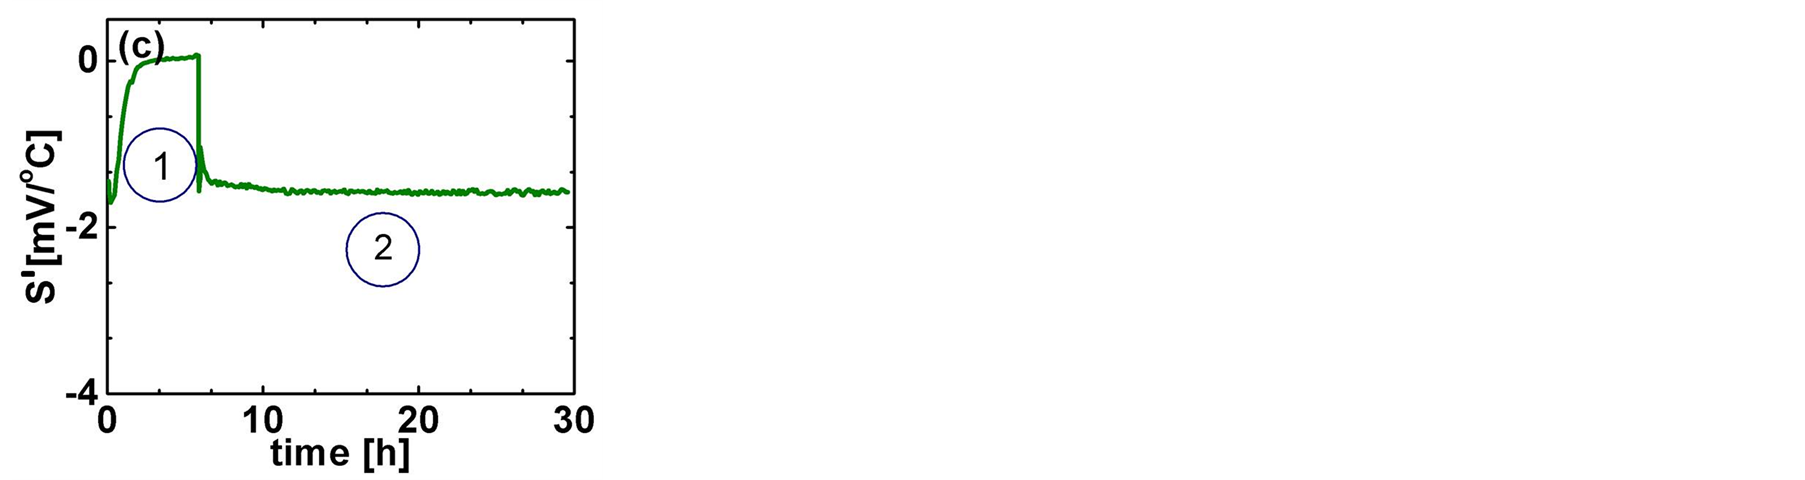
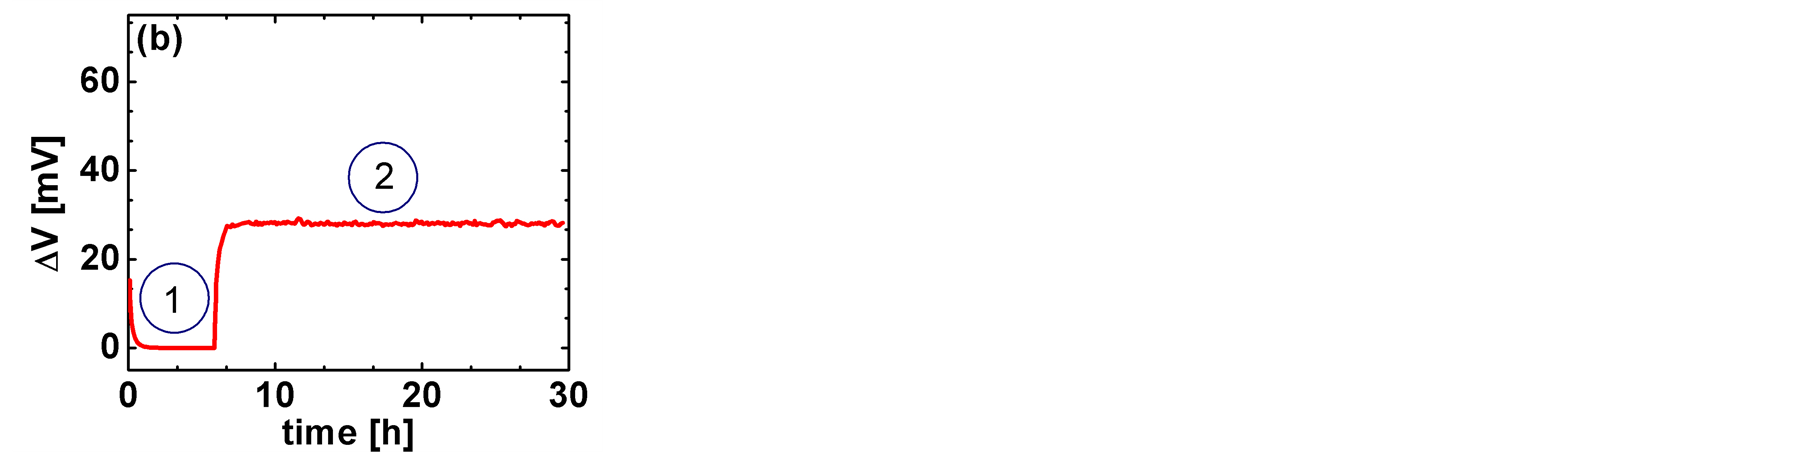
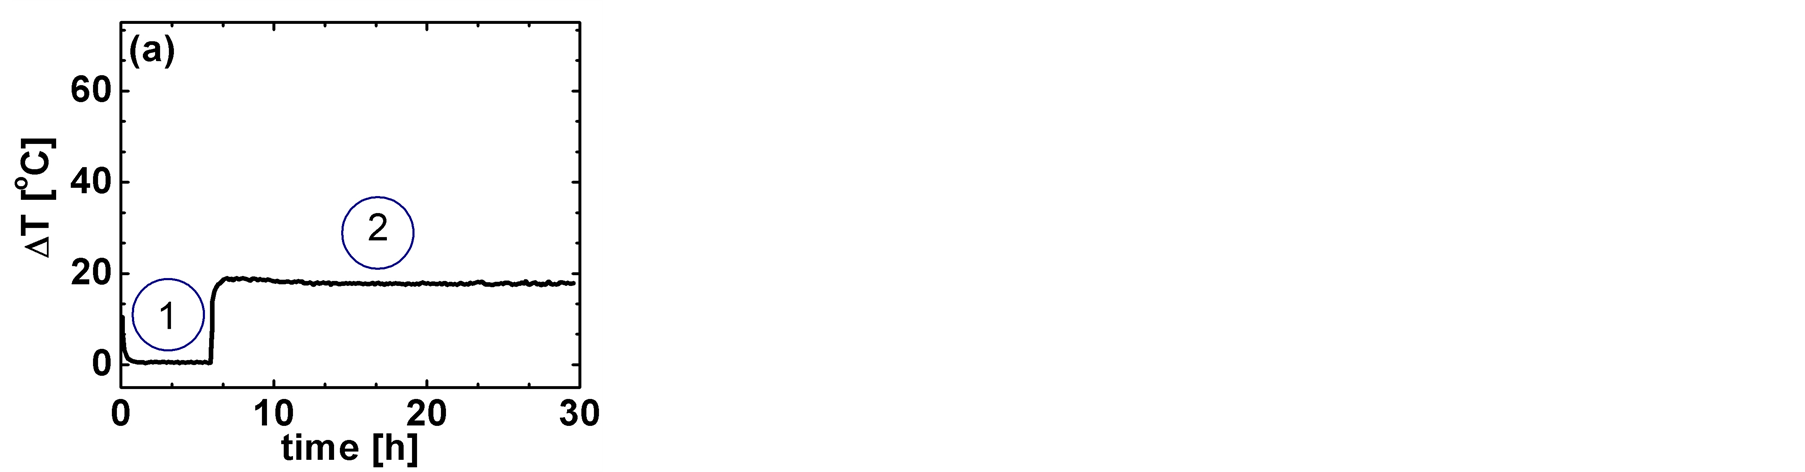
Figure 2. Trends of (a) , (b)
, (b) , and (c)
  for the solid state TEC-PG devicein the “away” horizontal configuration. Regions 1 and 2 are separated by the transient accompanying the turning-on of the hot plate.

Table 1. Mean , standard deviation
 , and relative error
  of
of ,
,  , and
, and  in the “away” horizontal and “toward” horizontal configurations. The values displayed for the “away” horizontal configuration are evaluated in Region 2 in the 12 - 30 hour time interval, whereas those for the “toward” horizontal configuration are evaluated in Region 2 in the 10.5 - 30 hour time interval.
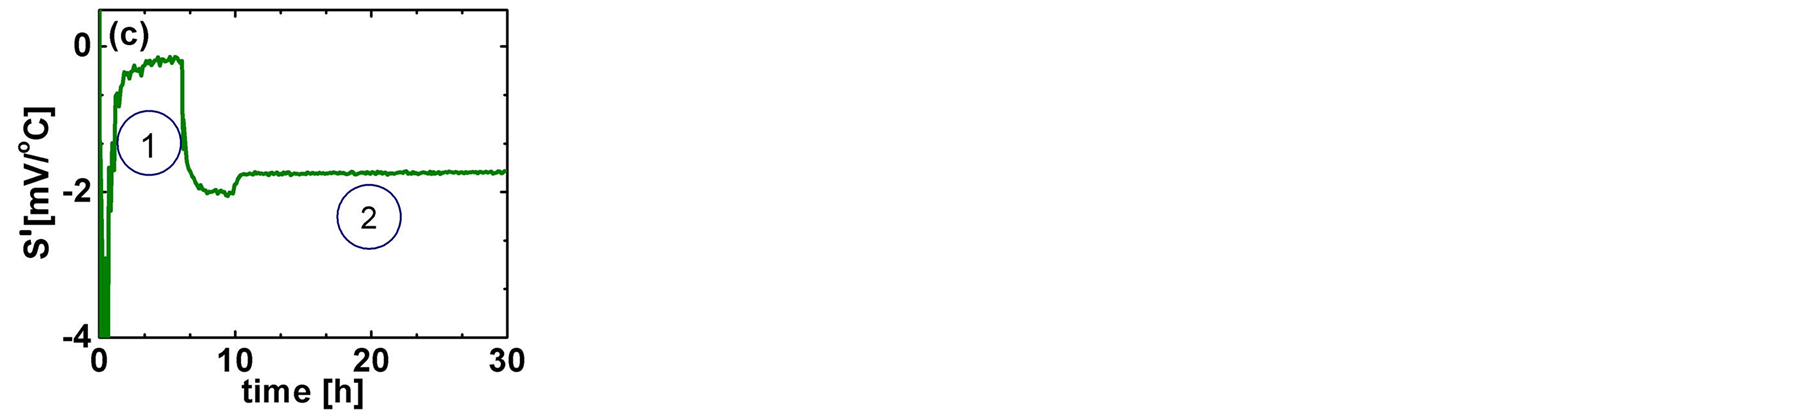
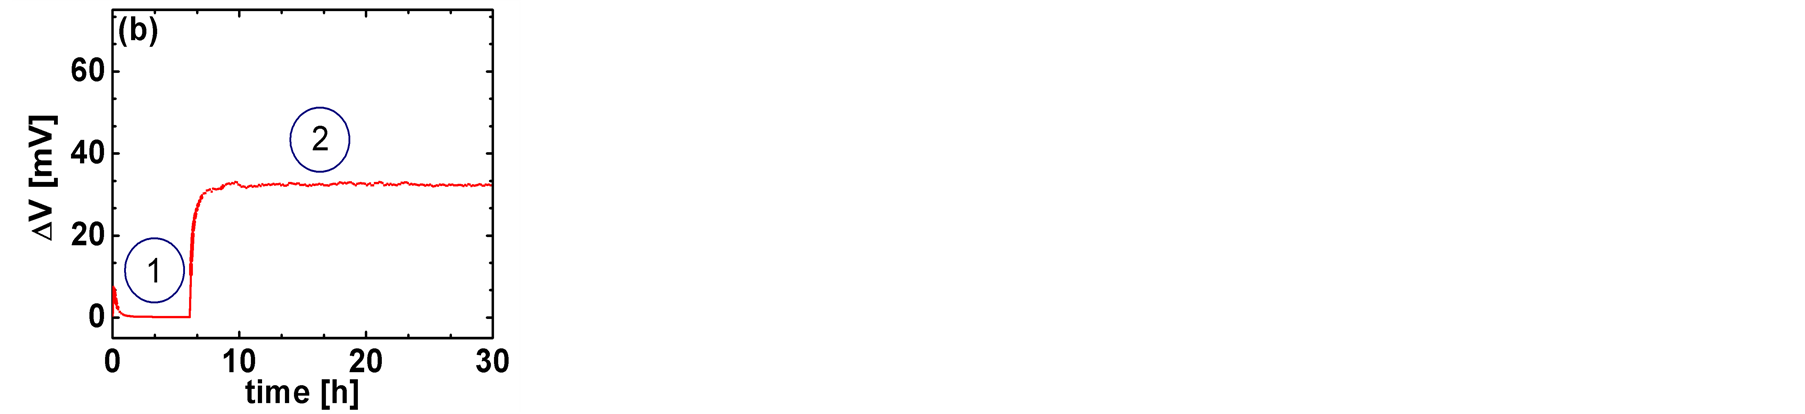
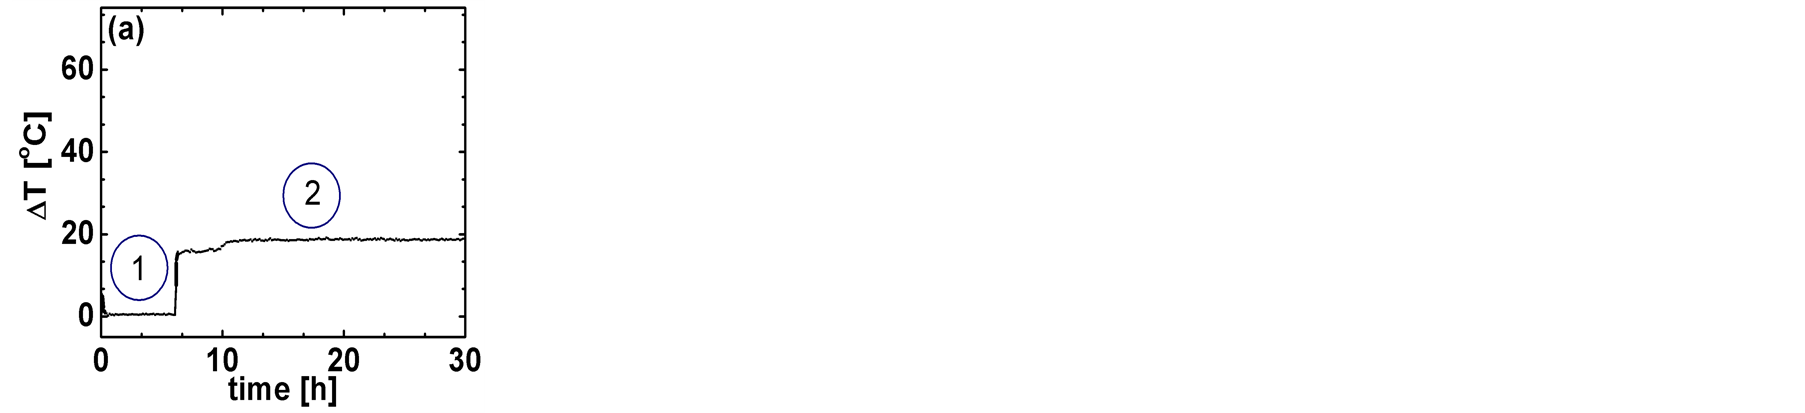
Figure 3. Trends of (a) , (b)
, (b) , and (c)
  for the solid state TEC-PG devicein the “toward” horizontal configuration. Regions 1 and 2 are separated by the transient accompanying the turning-on of the hot plate.
 ,
,  and
and  in the “toward” horizontal configuration. The
 ,
,  , and
, and  values are displayed in Table1 The results are comparable to those for the “away” horizontal configuration. The average value of the effective Seebeck coefficient
  in the steady state portion of Region 2 is
 . The results are reproducible, and further support the result achieved for the “away” configuration that the effective
  and
and  are bound by a causal and linear relationship, in agreement with the SE. Figures 4(a)-(c) illustrate the trends of
 ,
,  and
and  in the in the “toward” vertical configuration. The
 ,
,  , and
, and  values are reported in Table2 The findings again support the causal and linear relationship between
  and
and , in agreement with the SE, as in the previously examined configurations. It is noteworthy, however, that in this case the average value of the effective Seebeck coeffiecient
  in the steady state portion of Region 2 is
 , a slightly larger negative value than in the previously examined configurations. The effects of the environmental configurations are described in Figure 5 and Figure 6 and the corresponding
 ,
,  , and
, and  values are summarized in Table 3 and Table4 Causality and linearity between
  and
and  in agreement with the SE hold in a similar manner as for the “away” and “toward” horizontal, and “toward” vertical configurations. Figure 5 and Table 3 report the results for the “toward” horizontal-black tape configuration. In this case, the average value of the effective Seebeck coefficient
  in the steady state portion of Region 2 is
 . Figure 6 and Table 4 report the results for the “toward” vertical-aluminum supports configuration. In this case, the average value of the effective Seebeck coeffiecient
  in the steady state portion of Region 2 is
 , similar to that of the “toward” vertical configuration. Thus, the data
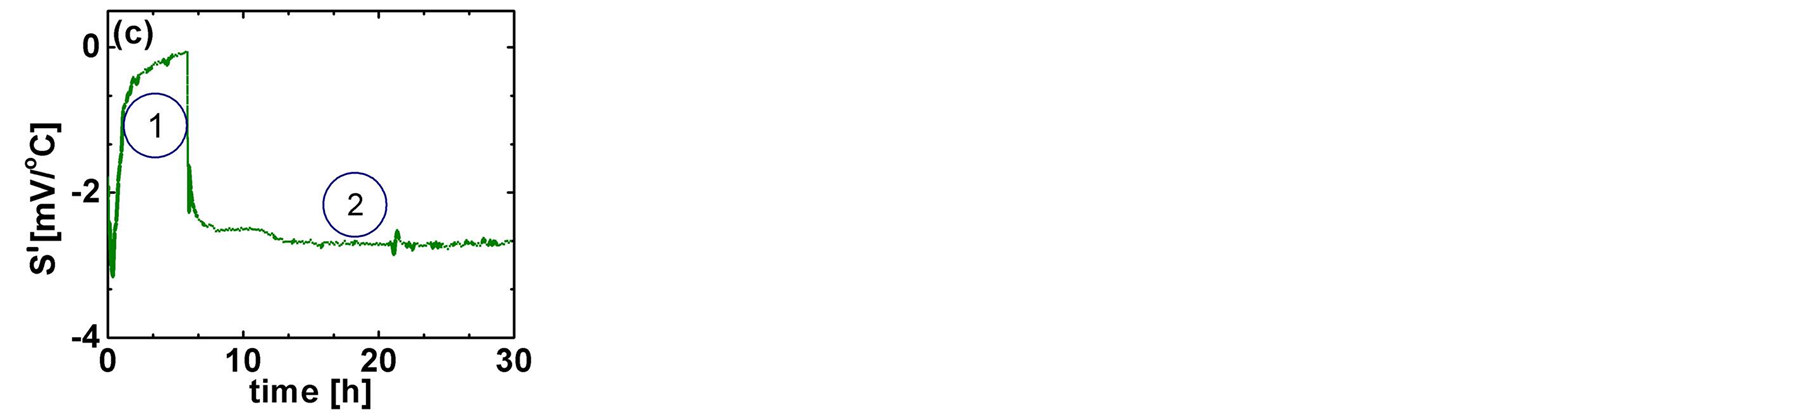
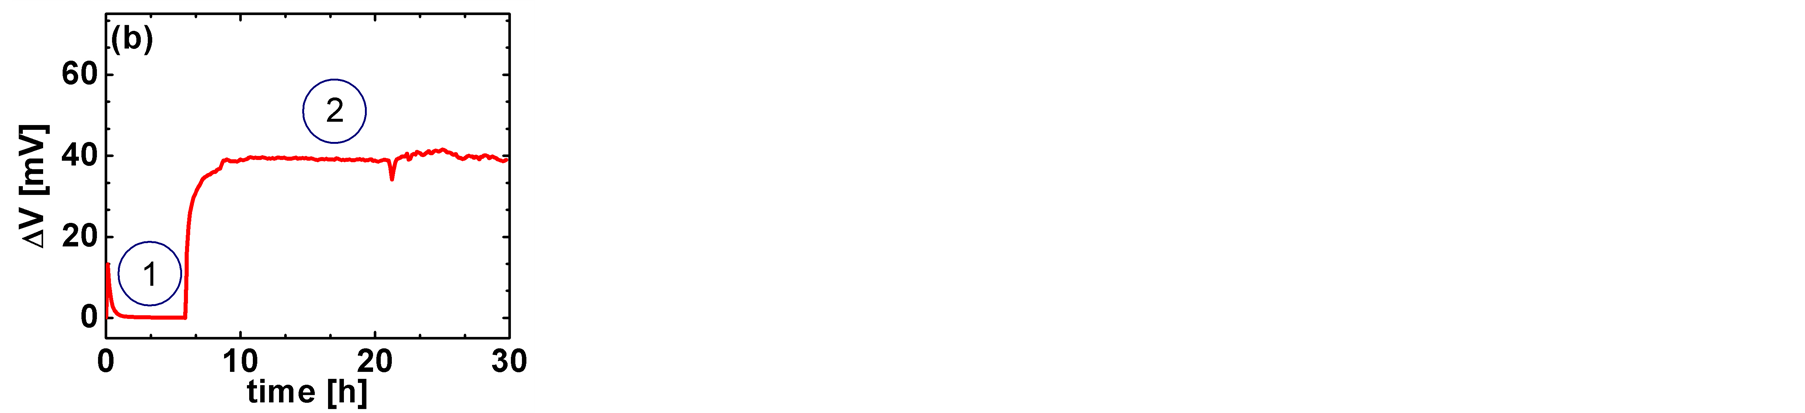
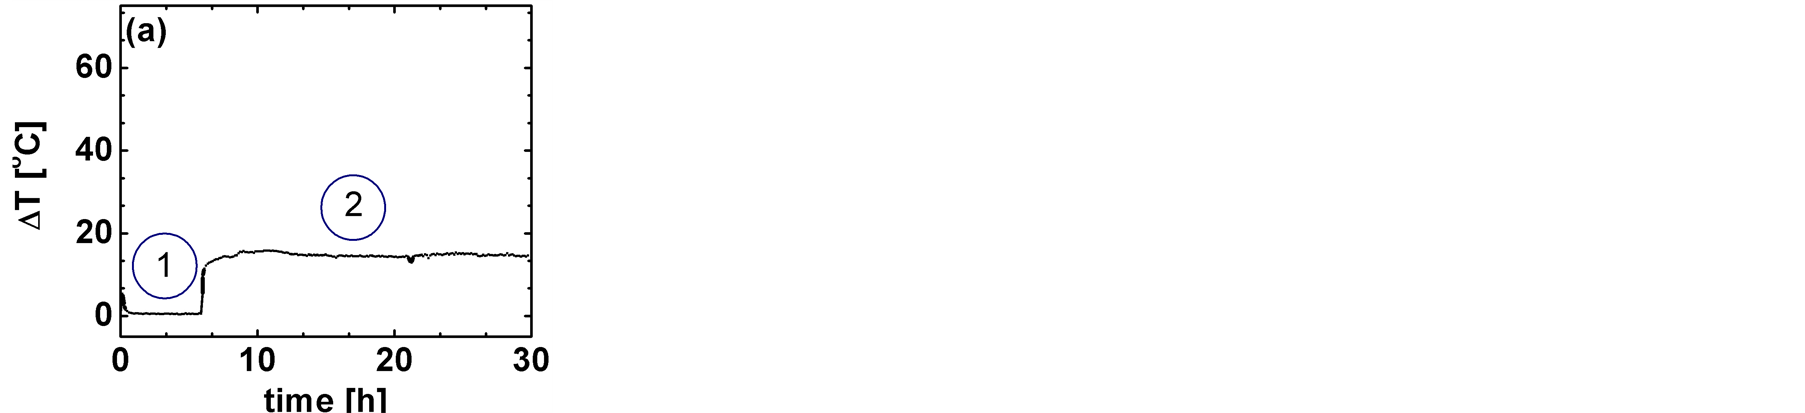
Figure 4. Trends of (a) , (b)
, (b) , and (c)
  for the solid state TEC-PG devicein the “toward” vertical configuration. Regions 1 and 2 are separated by the transient accompanying the turning-on of the hot plate.
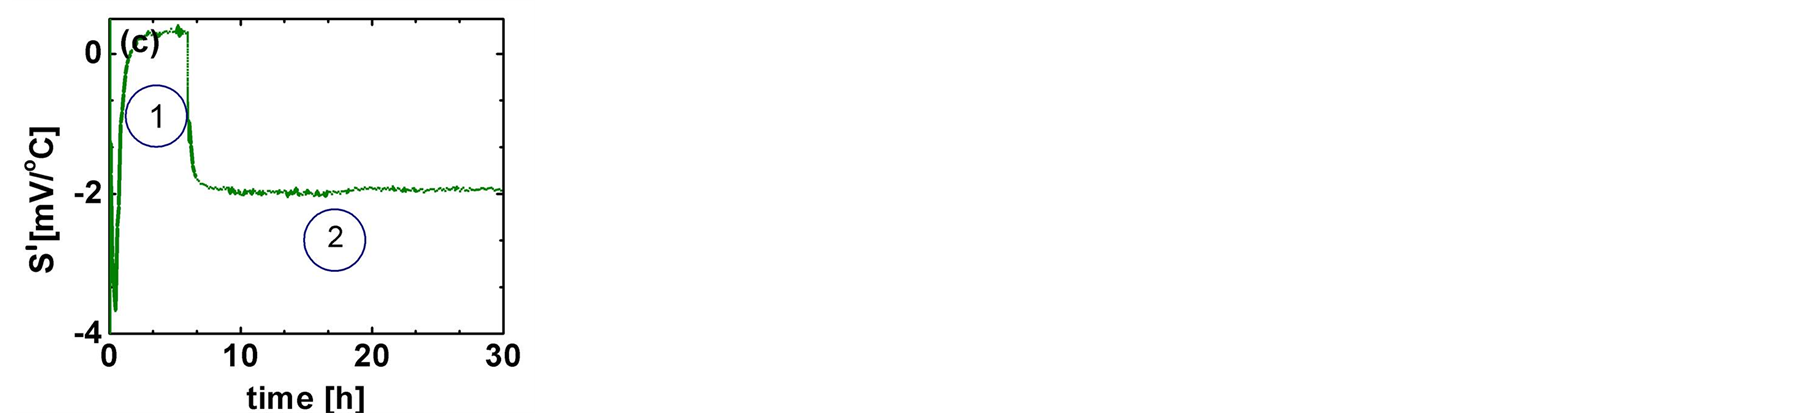
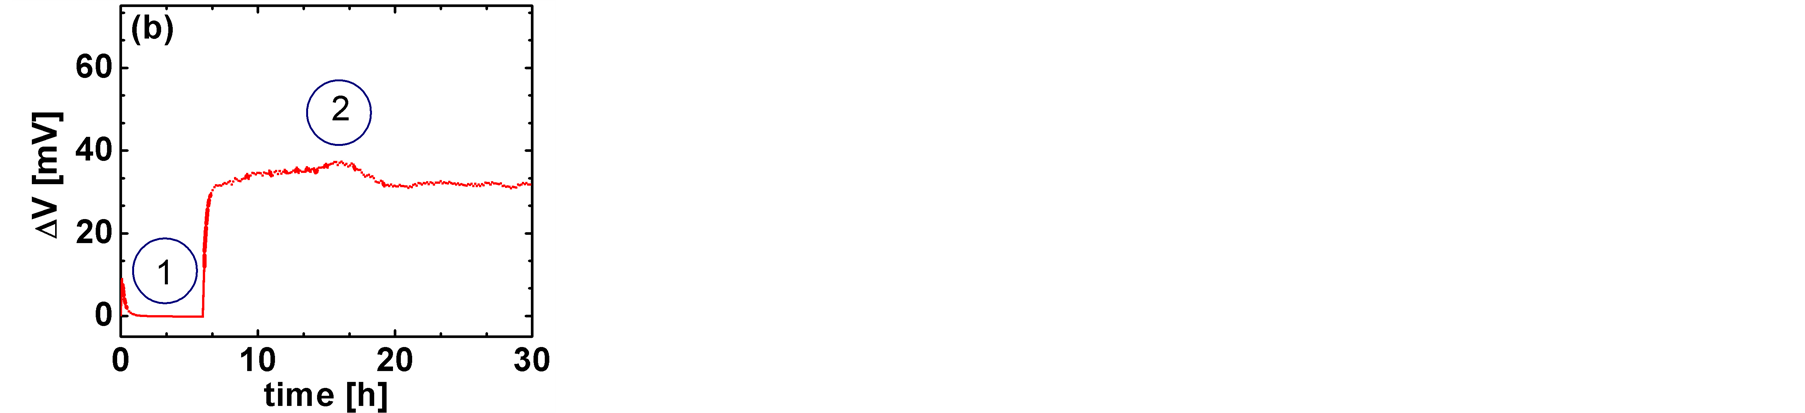
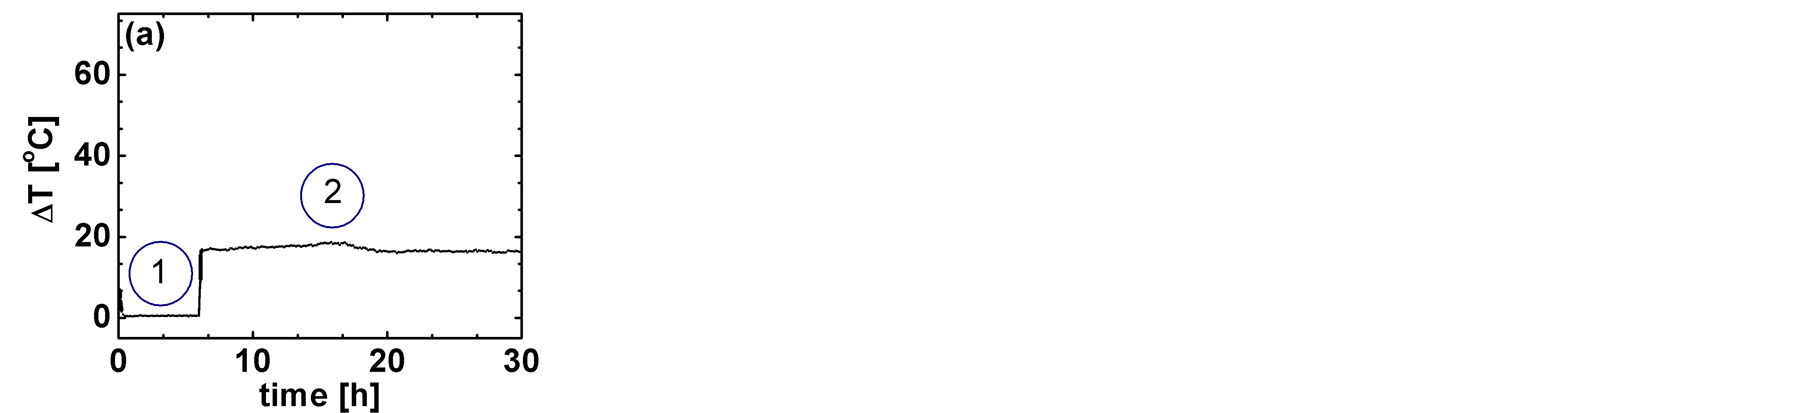
Figure 5. Trends of (a) , (b)
, (b) , and (c)
  for the solid state TEC-PG devicein the “toward” horizontalblack tape configuration. Regions 1 and 2 are separated by the transient accompanying the turning-on of the hot plate.
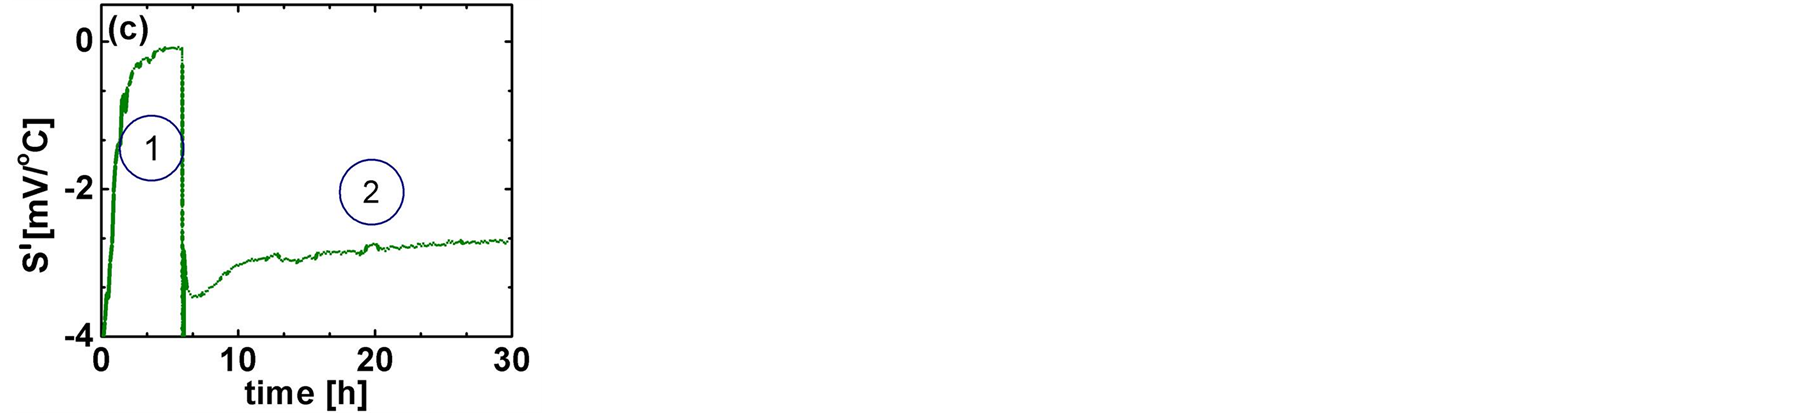
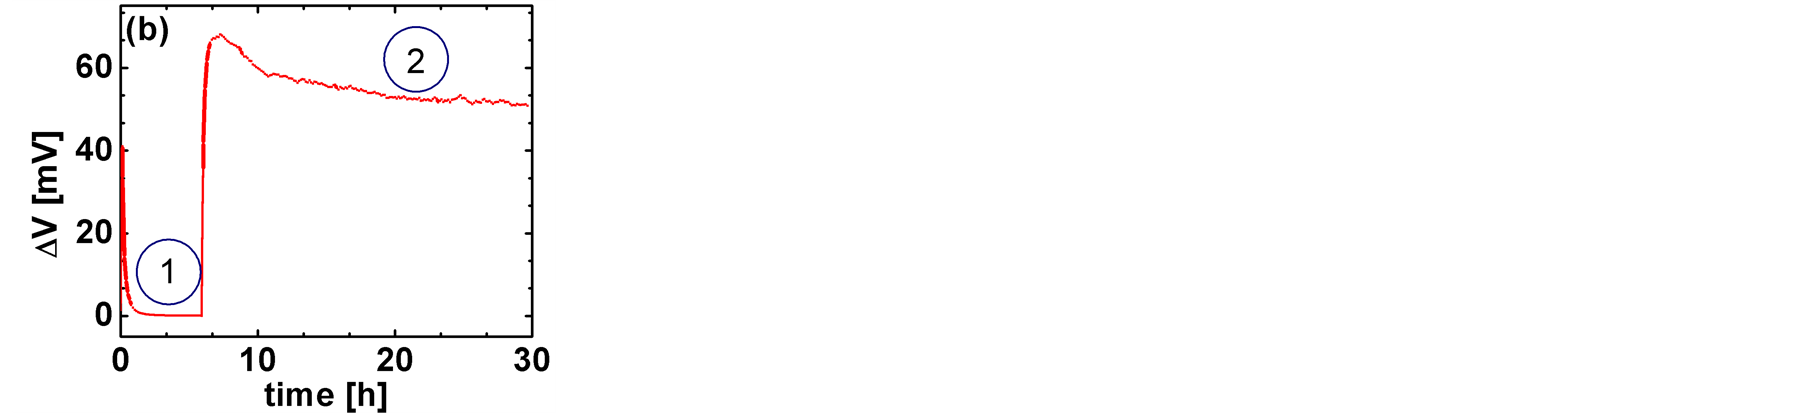
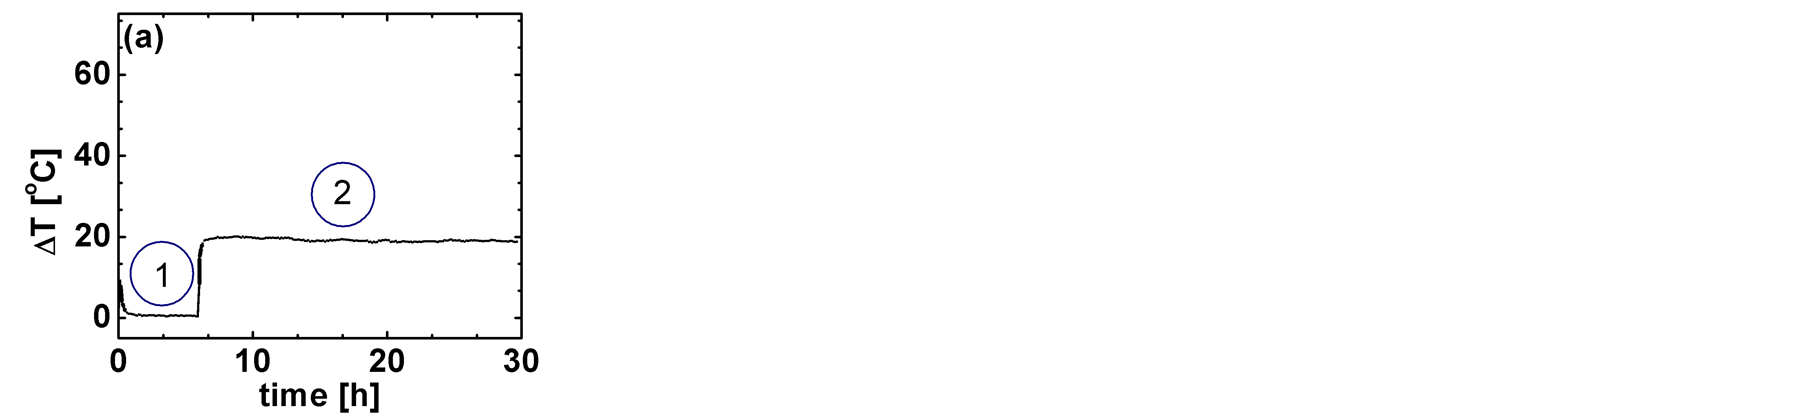
Figure 6. Trends of (a) , (b)
, (b) , and (c)
  for the solid state TEC-PG devicein the “toward” verticalaluminum supports configuration. Regions 1 and 2 are separated by the transient accompanying the turning-on of the hot plate.
Table 2. Mean , standard deviation
 , and relative error
  of
of ,
,  , and
, and  in the “toward” vertical configuration.The values are evaluated in region 2 in the 12 - 30 hour time interval.
 ,
,  and
and  are similar. The average values of the effective Seebeck coefficient
  in the steady state portion of Region 2, however, slightly depend upon the specific configuration. The vertical configurations seems to promote a lager absolute magnitude of
 . Slight instabilities in the trends of
  and
and , observed in Figures 3-5, might be due to instabilities in the heated N2 gas inside the insulated compartment. It is very interesting to observe that, when the instabilities are originated in the
  graphs, they are reflected in the
  trends. This is another proof of the causal
Table 3. Mean , standard deviation
 , and relative error
  of
of ,
,  , and
, and  in the “toward” horizontal-black tape configuration. The values are evaluated in Region 2 in the 20 - 30 hour time interval.
Table 4. Mean , standard deviation
 , and relative error
  of
of ,
,  , and
, and  in the “toward” vertical-aluminum supports configuration. The values are evaluated in Region 2 in the 20 - 30 hour time interval.
and linear relationship existing between the effective  and
and .
.
 between the two thermocouple probes in the “away” horizontal and “toward” horizontal configurations were measured and reported in Table5 Based on the
  values, the corrected
  s were estimated and reported as
 . Finally, using the experimental average voltage difference in Region 2 (
 from Table 1), the corrected effective Seebeck coefficients in the steady state of Region 2
  are reported in Table5 The values lie between
  and
and  in the “away” horizontal configuration, and between
  and
and  in the “toward” horizontal configuration. In both the “away” and the “toward” horizontal configurations, the experimentally measured average effective
  values of
  and
and , respectively, are within the
  range. Figure 7 shows the fitting of the experimental effective
  and
and  data in the “away” and “toward” configurations observed in the 400 s time segment in Region 2 immediately following the turning-on of the hot plate. A linear fitting with parameters
 ,
,  ,
,  , and
, and , reported in Table 6, gave the best goodness of fitting parameters
  and
and . The
. The  values vary between 0.28 (“toward” horizontal) to 1.5˚C (“toward” horizontal-black tape). On the other hand, the
  values vary between
  (“toward” horizontal) to
  (“toward” vertical-aluminum supports). However, the rates of increase of
  and
and ,
,  and
and  respectively, are almost constant in the examined configurations. The rate of increase of the effective
  ,
,  , is on average
 , while the rate of increase of the effective
 ,
,  , is on average
  . Only the
  value in the “toward” vertical-aluminum supports configuration is
 . In this case, the
  (3.75 mV) and the average
  (52.0 mV) values are the largest among all the examined cases. The value of the rate of increase of
 ,
,  , which is on average
 , coincides with the rate of increase of the temperature of the hot plate surface. The linearity of the relationship between
  and
and  in the 400 s time segment in Region 2, immediately following the turning-on of the hot plate, is strongly supported by the large values of the goodness of fitting parameters
  and
and .
.
Table 5. Temperature difference  between the two thermocouple probes; corrected temperature difference in Region 2 between the “hot” and “cold” junction of the solid state TEC-PG device
 ; experimental average effective voltage difference in Region 2
 , and corrected Seebeck coefficient in Region 2
 . The values are analyzed in the “away” and “toward” configurations, placing the thermocouple probes either on the “hot” or “cold” junctionsof the solid state TEC-PG device, and fixing, for the corrections, either the temperature of the thermocouple normally used on the “cold” or “hot” junctions of the solid state TEC-PG device. The former setting is named cold thermocouple, the latter the hot thermocouple.
Table 6. The values of initial offsets  and
and , and of
 , the rate of increase of
 , and of
 , the rate of increase of
 . The corresponding goodness of fitting parameters
  and
and  are also reported. The parameters are obtained from the linear fitting of the experimental curves, as those illustrated in Figure 7, which were obtained in the 400 s time segment in Region 2 immediately following the turning-on of the hot plate.
4. Discussion
The results are reproducible and fully support the causal and linear relationship between the effective and
and  in agreement with the SE,
  , over the examined time range and in all the considered geometrical and environmental configurations. The average values of the effective Seebeck coefficient
  in the steady state of Region 2 after turningon the hot plate, however, slightly depend upon the geometrical and environmental configuration. In particular, the vertical configuration seems to promote a lager absolute magnitude. The result holds also after the correction of the effective Seebeck coefficient
  values required to adjust the systematic errors occurring in the effective
  measurements. Gravity should prevent the convection of hot air to reach the higher parts of the solid state TEC-PG device, but this effect seems not to play any role. The larger
  values found in the examined vertical configurations are related to the relatively large average effective
 values, while the av-
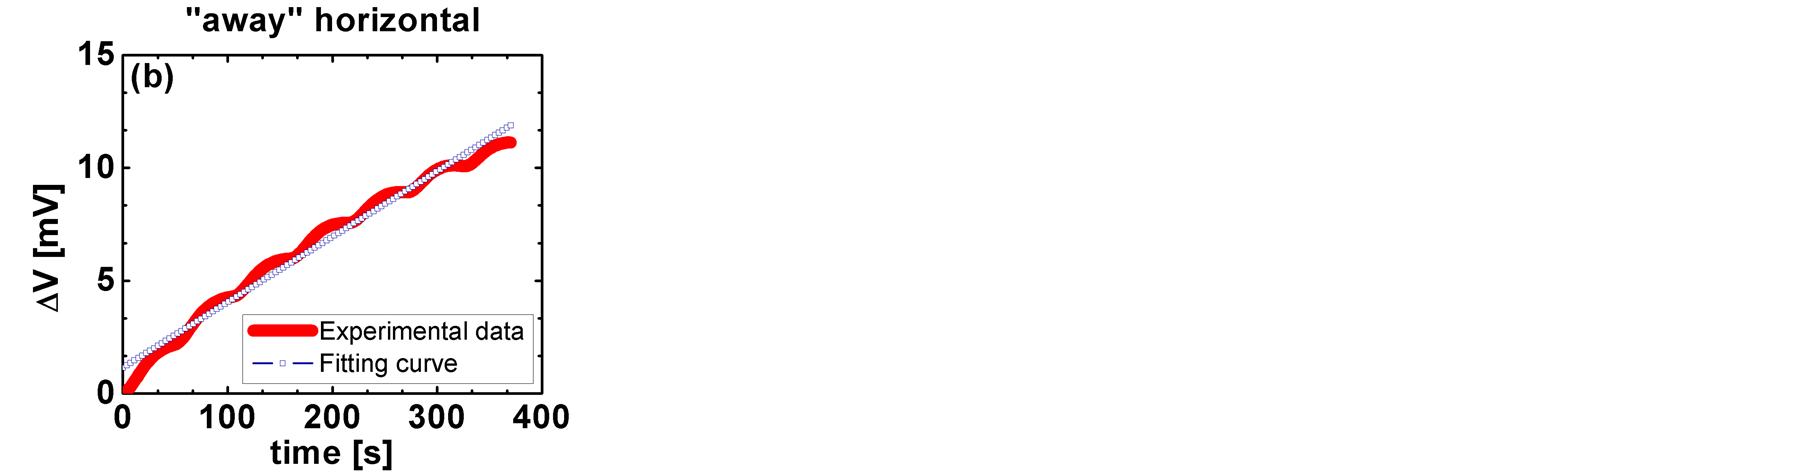
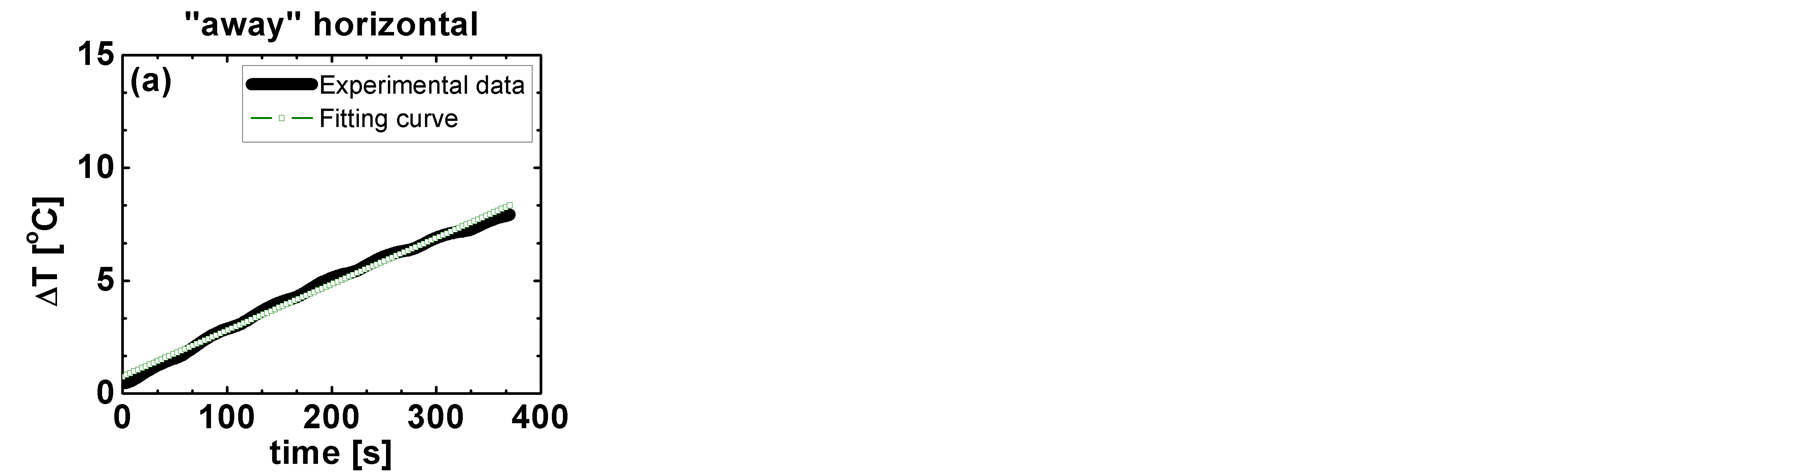
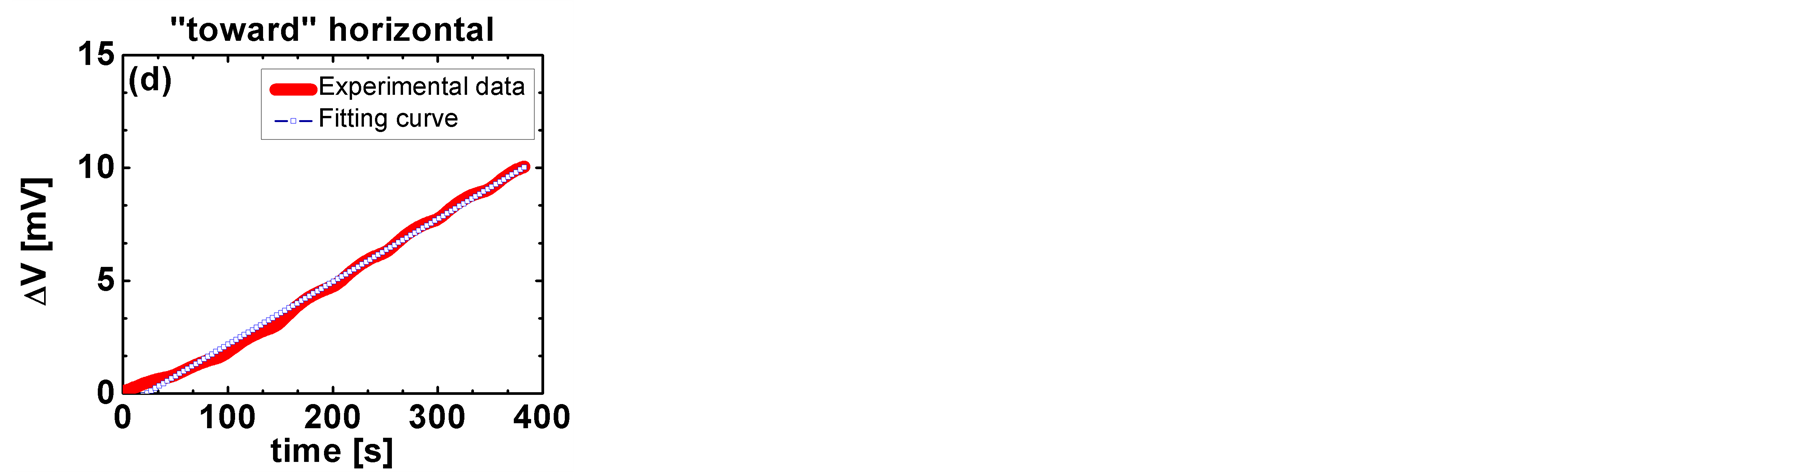
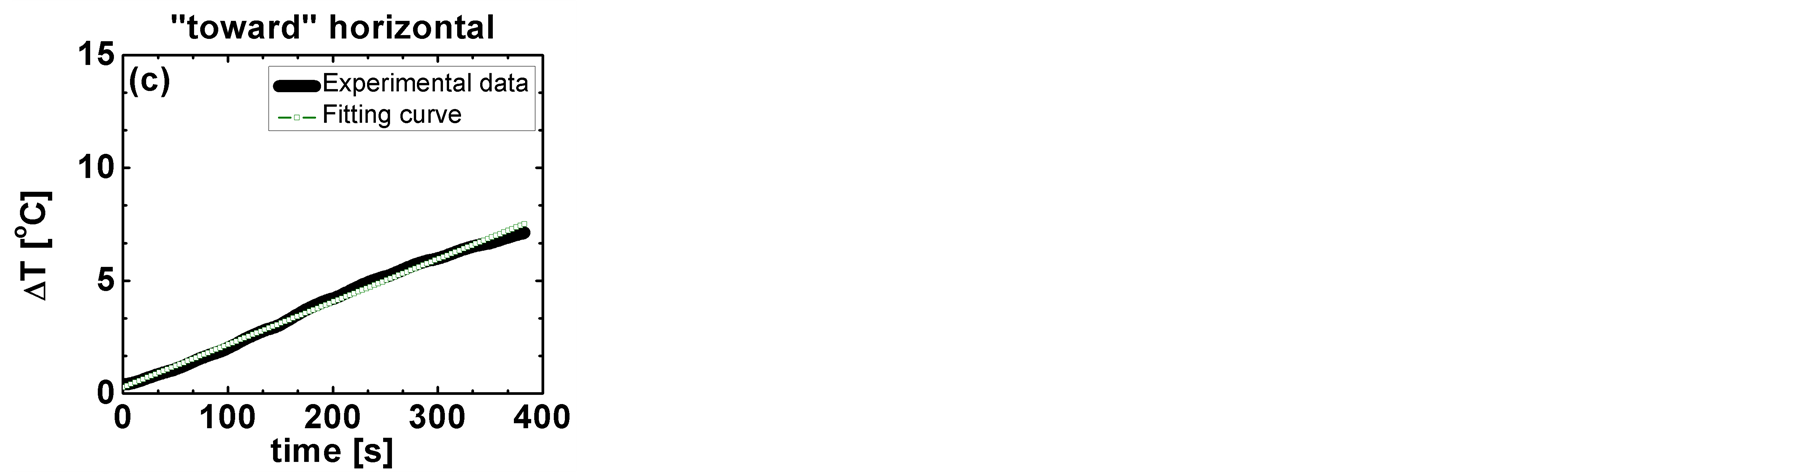
Figure 7. Linear fittings observed in the 400 s time segment in Region 2 immediately following the turning-on of the hot plate of the rise in  (a) and
  (b) in the “away” horizontal configuration, and of the rise in
  (c) and
  (d) in the “toward” horizontal configuration.
 is
is .This situation is verified also for the “toward” verticalaluminum supports configuration. Therefore, contributions to
  in the vertical configuration, especially with the Al sample holder, originate from factors other than the SE. The existence of a causal and linear relationship between the effective
  and
and , in agreement with the SE,
  , is corroborated by the rates of increase of
  and
and ,
,  and
and  respectively, whose values are summarized in Table6 These values are almost constant in the examined configurations:
  is on average
 , while
 is on average
 . It is noteworthy, however, that the value of
  in the “toward” vertical-aluminum supports configuration is
 . In this case, average effective
  achieves the value of 52.0 mV, which is the maximum detected in the presented set of experiments. Evidently, the Al sample holder promote an increase in
  without affecting the heat transfer across the solid state TEC-PG device: indeed the effective
  is
is , very close to the average of
 . The lack of correlation between
  and
and  with the Al sample holders is supported by the existence of a bump followed by a decay in the
  data of the “toward” vertical-aluminum support configuration in Figure 6(b). This feature does not exist in the
  data in Figure 6(a). This finding implies that, given the causal relationship between
  and
and , the anomaly is located solely in the
  production. Thus, the effective Seebeck coefficient
  can be modified by the geometrical and environmental configurations in which the solid state TEC-PG device is activated. Testing other settings, such as the distance of the TEC-PG from the surface of the hot plate and its inclination on it, with the aid of either insulating or conducting sample holders, could further support this conclusion. To ascertain the role of heat transfer in explaining the described phenomena, the experimental results are compared to calculations. The hypothesis is that sample holders made of materials with different
  in the “toward” configuration illustrated in Figure 1(c) produce a different rate of heat loss
 . A larger heat loss rate
  would determine, in a certain time interval, a smaller effective temperature difference
  across the solid state TEC-PG device, and a smaller effective voltage difference
  due to the SE. The calculation of the heat loss rate
  across the sample holders in the “toward” configuration is carried out through resistance equations [16] , and assuming Al and wood as sample holder materials. The model system is illustrated in Figure 8. If an increase in heat loss rates
  through the sample holder exists and the corresponding voltage difference
  decreases, then heat transfer enables the understanding of the observed phenomena. The
  values achieve a steady state value in Region 2, which is larger for the Al than for the wood sample holder, as summarized in Table 2 and Table4
To calculate the heat loss rate  through the sample holder [16] in the steady state condition in Region 2, first the total resistance
  of the isolated solid state TEC-PG device depicted in Figure 8 without considering the sample holders in the right corner of the figure, is calculated as follows:
 (1)
(1)
In Equation (1),  is the thickness of the material in the solid state TEC-PG device depicted in Figure 8,
  is its surface area, and
  its thermal conductivity. The factors 2 in the first and second term of the equation appear because there are two alumina-ceramic and two Cu plates in the solid state TEC-PG device depicted in
Figure 8. The factor  in the third term of Equation (1) appears because there are 142 pillars of a Bi2Te3based alloy in the solid state TEC-PG devices used for this experiment. The values of the thermal conductivity and of the geometrical parameters are summarized in Table7 The heat transfer rate across the solid state TEC-PG device is:
 , (2)
, (2)
This quantity is 0.5 W, assuming a  of
of  (where K is degree Kelvin), as experimentally determined and previously discussed.
The second step is the calculation of the heat loss rate  in Region 2 due to the different sample holders in the right corner of Figure 8. The sample holder’s (SH) resistance is:
 (3)
(3)
where the  factor is due to the parallel resistance determined by the sample holders in contact with the solid state TEC-PG device. The values of the thermal conductivity and of the geometrical parameters of the wood and Al sample holders are reported in Table7 Assuming isotropic heat diffusion, the heat loss rate
  across the sample holders in Figure 8 is:
 , (4)
, (4)
where  is the temperature difference across the sample holder: 2 K across Al, and 5 K across wood. The calculated values of
  are reported in Table 7, and are compared with the trends of the average effective
  values in the steady state in Region 2. It can be seen that the
  decreases and the average effective
  values also decrease, in order, from the Al to the wood sample holders, which is contradictory according to our hypothesis. In addition, with the Al sample holder, the heat loss rate
  (2.5 W) is larger than the heat transfer rate
  across the solid state TEC-PG device (0.5 W).The lack of correlation between the heat loss rates
  and the effective average
  values, suggests that heat transfer does not completely explain the effective voltage production in the examined cases.
 production might be determined by factors other than heat transfer. One of these factors could be of electrical nature. Indeed, Figure 8 suggests that in the “toward” vertical-aluminum supports case, the 142 pillars of doped Bi2Te3-based alloy in the solid state TEC-PG device are embedded between two capacitors in series: one is C1, with air and one of the Cu plates as electrodes, and the alumina-ceramic plate (Al2O3) as dielectric layer. The other capacitor is C2, with
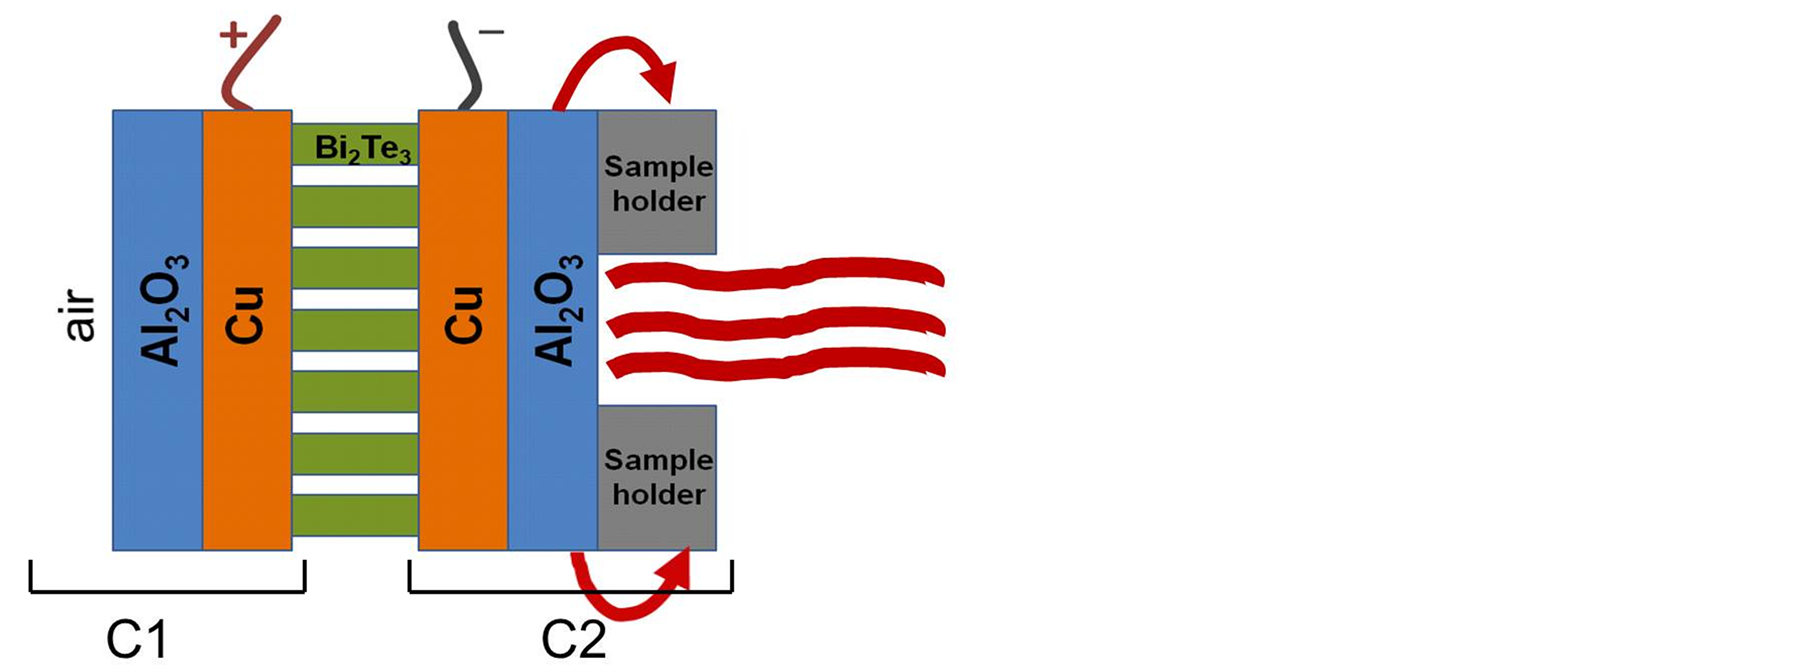
Figure 8. Model of the solid state TEC-PG device mounted to the sample holder used in the calculations of heat transfer rates across the solid state TEC-PG device and heat loss rates through the sample holders. Aluminum and wood are considered as materials of the sample holders. The arrows indicate the direction of flow of the heat lost through the sample holders. C1 indicates the capacitor with air and a Cu plate as electrodes, and the alumina-ceramic plate (Al2O3) as dielectric layer. C2 indicates the capacitor with the other Cu plate, and the Al sample holder as electrodes, and the Al2O3 plate as dielectric layer.
Table 7. Thermal conductivity ( ) and specific physical dimensions (length
 , width
 , and thickness
 ) of the materials involved in the heat transfer rate
  across the solid state TEC-PG device, and heat loss rate
  through the sample holders. For the two different sample holder’s materials considered (Al and wood) the heat loss rate
  is calculated through resistance equations [16] . The temperature differences across the sample holders are:
 , and
, and . The
. The  values are the average effective voltage difference in the steady state condition in region 2 for the wood and Al cases, and correspond to those in Table 2 and Table4
 produced by such a system of capacitors in series can be approximated as:
  , (5)
, (5)
 is the contribution of capacitor C1 and
  is the contribution of capacitor C2. The
  voltage difference influences the effective voltage difference
  produced by the solid state TEC-PG device. Wood is an insulator, thus not a good electrode material. Therefore no C2 capacitor can be considered with the wood sample holder. Thus in the case of the Al sample holder, the existence of the two capacitors in series could explain the average effective
  value in the “toward” vertical-aluminum supports case, which is larger than the average effective
  value in the “toward” vertical case with wood sample holders.
5. Summary and Significance
In a solid state thermoelectric power generator (TEC-PG) device, the effective temperature difference between the “hot” and “cold” junctions produces an effective voltage difference
 . This work focuses on the effective Seebeck coefficient
 , which refers to a device, not just to a material’s performance. The results show that effective Seebeck effect
  holds over a long time of activity of the solid state TEC-PG device in an insulated compartment, and over several geometrical and environmental configurations. Within the systematic errors in the temperature measurements and the possible temperature instabilities, the relationship between the effective
  and
and  is always causal and linear. However, the effective Seebeck coefficient
  can be affected by the geometrical and environmental configurations. In particular, contributions to
 , related to the motion of the charge carriers in the semiconducting pillars of the TEC-PG and not due to
 , are discovered. Calculations based solely on heat transfer are not sufficient to explain the observed phenomena. However, the used experimental set-up involving the solid state TEC-PG device can be viewed as a system of two capacitors in series. This view aids in the understanding of the
  production of solid state TEC-PG devices. Other configurations with different distances or inclinations of the solid state TEC-PG device with respect to the heat source should be considered to support this conclusion. The available results underline that, while materials engineering efforts are necessary to improve applications exploiting the Seebeck effect, efforts are also needed to maximizing the effective performance of thermoelectric devices. To this end, in the future experiments are planned to understand the effect of the size of the heating area, and will be accompanied by finite element analysis.
Acknowledgements
This work was supported by the US Office of Naval Research (award # N000141410378), JMU 4-VA Consortium (2013), Thomas F. Jeffress and Kate Miller Jeffress Memorial Trust (grant # J-1053), JMU College of Science and Mathematics for the Summer 2014 Faculty Assistance Grant, the JMU Center for Materials Science, and the JMU Department of Physics and Astronomy. The authors thank Profs. K. Giovanetti, J. Zimmerman, S. Whisnant, D. Lawrence, K. Feitosa, and K. Fukumura (JMU) for fruitful discussions. Thanks to Dr. X. Hu, A. Fovargue, T. Benns, and J. Jarrell, for technical support and help in the construction of the insulated sample compartment.
References
- Tritt, T.M., Bottner, H. and Chen, L. (2008) Thermoelectrics: Direct Solar Thermal Energy Conversion. MRS Bulletin, 33, 366-368. http://dx.doi.org/10.1557/mrs2008.73
- Tritt, T.M. (2011) Thermoelectric Phenomena, Materials, and Applications. Annual Review of Materials Research, 41, 433-448. http://dx.doi.org/10.1146/annurev-matsci-062910-100453
- Qu, D., Huang, S.Y., Hu, J., Wu, R. and Chien, C.L. (2013) Intrinsic Spin Seebeck Effect in Au/YIG. Annual Review of Materials Research, 110, Article ID: 067206. http://dx.doi.org/10.1103/PhysRevLett.110.067206
- Zhou, C., Birner, S., Tang, Y., Heinselman, K. and Grayson, M. (2013) Driving Perpendicular Heat Flow: (p × n)-Type Transverse Thermoelectrics for Microscale and Cryogenic Peltier Cooling. Physical Review Letters, 110, Article ID: 227701. http://dx.doi.org/10.1103/PhysRevLett.110.227701
- Zhang, G.Y., Zheng, H.R., Zhang, X.Y., Gao, D.L., Zhang, P.X. and Habermeier, H.U. (2012) Time-Integral Type Strongly Correlated Electronic Thin-Film Laser Energy Meter. Applied Physics B, 108, 649-655.http://dx.doi.org/10.1007/s00340-012-5028-3
- Leonhardt, U. (2013) Cloaking of Heat. Nature, 498, 440-441. http://dx.doi.org/10.1038/498440a
- Bell, L.E. (2008) Cooling, Heating, Generating Power, and Recovering Waste Heat with Thermoelectric Systems. Science, 321, 1457-1461. http://dx.doi.org/10.1126/science.1158899
- Vining, C.B. (2009) An Inconvenient Truth about Thermoelectrics. Nature Materials, 8, 83-85.http://dx.doi.org/10.1038/nmat2361
- Hicks, L.D. and Dresselhaus, M.S. (1993) Thermoelectric Figure of Merit of a One-Dimensional Conductor. Physical Review B, 47, 16631-16634. http://dx.doi.org/10.1103/PhysRevB.47.16631
- Wang, G., Endicott, L., Chi, H., Lo?t’ák, P. and Uher, C. (2013) Tuning the Temperature Domain of Phonon Drag in Thin Films by the Choice of Substrate. Physical Review Letters, 111, Article ID: 046803.http://dx.doi.org/10.1103/PhysRevLett.111.046803�
- Parise, R.J. and Jones, G.F. (2004) Prototype Data from the Nighttime Solar Cell?. Collection of Technical Papers, 2nd International Energy Conversion Engineering Conference, 1172-1182.�
- Vincent-Johnson, A.J., Masters, A.E., Hu, X. and Scarel, G. (2013) Excitation of Radiative Polaritons by Polarized Broadband Infrared Radiation in Thin Oxide Films Deposited by Atomic Layer Deposition. Journal of Vacuum Science Technology A, 31, Article ID: 01A111.
- Schwab, Y., Mann, H.S., Lang, B.N., Lancaster, J.L., Parise, R.J., Vincent-Johnson, A.J. and Scarel, G. (2013) Infrared Power Generation in an Insulated Compartment. Complexity, 19, 44-55. http://dx.doi.org/10.1002/cplx.21484
- Suter, C., Tome?, P., Weidenkaff, A. and Steinfeld, A. (2010) Heat Transfer and Geometrical Analysis of Thermoelectric Converters Driven by Concentrated Solar Radiation. Materials, 3, 2735-2752.http://dx.doi.org/10.3390/ma3042735�
- Vincent-Johnson, A.J., Vasquez, K.A., Bridstrup, J.E., Masters, A.E., Hu, X. and Scarel, G. (2011) Heat Recovery Mechanism in the Excitation of Radiative Polaritons by Broadband Infrared Radiation in Thin Oxide Films. Applied Physics Letters, 99, Article ID: 131901. http://dx.doi.org/10.1063/1.3643464
- Lenz, M., Striedl, G. and Frohler, U. (2000) Thermal Resistance, Theory and Practice. Infineon Technologies AG, Munich.
- ?ivcová, Z., Gregorová, E., Pabst, W., Smith, D.S., Michot, A. and Poulier, C. (2009) Thermal Conductivity of Porous Alumina Ceramics Prepared Using Starch as a Pore-Forming Agent. Journal of the European Ceramic Society, 29, 347-353. http://dx.doi.org/10.1016/j.jeurceramsoc.2008.06.018�
- Parker, W.J., Jenkins, R.J., Butler, C.P. and Abbott, G.L. (1961) Flash Method of Determining Thermal Diffusivity, Heat Capacity, and Thermal Conductivity. Journal of Applied Physics, 32, 1679-1684.http://dx.doi.org/10.1063/1.1728417
- Goldsmid, H.J. (1956) The Thermal Conductivity of Bismuth Telluride. Proceedings of the Physical Society, B69, 203-209. http://dx.doi.org/10.1088/0370-1301/69/2/310
NOTES

*Corresponding author.