Atmospheric and Climate Sciences
Vol.3 No.2(2013), Article ID:30786,11 pages DOI:10.4236/acs.2013.32024
Influence of Land Use Activities on Spatial and Temporal Variation of Nutrient Deposition in Mwanza Region: Implication to the Atmospheric Loading to the Lake Victoria
1Department of Chemistry, College of Natural and Mathematical Sciences,
The University of Dodoma, Dodoma, Tanzania
2Department of Humanities, Busoga University, Uganda
3Department of Crop Science, Egerton University, Kenya
Email: *said@udom.ac.tz, saidhamadv@yahoo.co.uk
Copyright © 2013 Said Ali Hamad Vuai et al. This is an open access article distributed under the Creative Commons Attribution License, which permits unrestricted use, distribution, and reproduction in any medium, provided the original work is properly cited.
Received November 23, 2012; revised January 2, 2013; accepted January 13, 2013
Keywords: Nutrient; Landuse; Lake Victoria; Precipitation; Atmospheric Pollution
ABSTRACT
Increase in population growth and the associated activities have increased the nutrient input to the Lake Victoria through atmosphere and river discharge. Atmospheric input of nutrient is believed to exceed that of river discharge due to relatively higher contribution of water mass to the Lake from atmosphere. However, precipitation characteristics with respect to nutrients have not been well studied to allow qualification and quantification of atmospheric contribution to the Lake Victoria. This study was conducted to investigate influence of land use activities on spatial and temporal variation of nutrient inputs from atmosphere and to estimate atmospheric loading to the Lake Victoria. The results revealed that there is significant spatial and temporal variation of nutrient deposition in the study area. High concentrations of nutrients were observed during short rains starting from September to December. This was attributed to dissolution of nutrients from soil particals and ash residues due to biomass burning accumulated in the atmosphere during dry season of June to August. Spatial variation of nutrients reflects land use activities. Urban and peri-urban areas showed very high concentration of nitrate nitrogen due to industrial and vehicle emission while rural area showed high concentration of phosphorous species and reduced forms of nitrogen species reflecting agricultural activities and animal keeping. Generally, nutrient deposition load was higher in rural area compared to urban with respective values of 15.5 and 13.9 kg·ha−1·y−1 for total nitrogen and 6.1 and 2.8 kg·ha−1·y−1 for total phosphorous. These results suggest that in order to realize significant reduction of nutrient input to the Lake Victoria, measures should be taken to control agricultural activities through proper land use planning. The measure may be directed to reduce biomass burning, emission from industries and vehicle as well as animal residue.
1. Introduction
Rapid growth of population, urbanization and intensified agricultural activities have increased mobilization of nitrogen and phosphorous to the aquatic ecosystem, which have been attributed to active functioning of aquatic systems [1]. Wastewater from sewerage and industries in urban areas, which is often discharged untreated to the environment, is a major source of nutrients causing eutrophication [2,3]. Eutrophication is associated with ecological changes including strong increase in phytoplankton primary production, replacement of diatoms by cyanobacteria, rapid growth of phytoplankton and aquatic microphytes, alteration of the ecological integrity of freshwater and depletion of dissolved oxygen. Lakes are particularly vulnerable to nutrient loading and its consequences because of long water retention time.
Importance of atmospheric deposition as source of nutrients has well been documented. This is particularly important for the Lake Victoria, in which the water input by rainfall is more than four times greater than that from river flow and hence direct atmospheric deposition of nutrients on the lake may be significant. There is sufficient information to suggest that atmospheric deposition contributes significant nutrient loads to the African Great Lakes including Lake Victoria [4,5]. However, there is inadequate information to determine the qualitative and quantitative significance of this source to the lakes, possible source locations, processes and trajectories of atmospheric contaminants. The large scale deforestation and biomass burning occurring in the Lake region [6,7] can also influence nutrient deposition through atmosphere. Therefore estimation of nutrient loading is crucial to environmental management and planning.
The objective of this study was to investigate influence of land use activities on spatial and temporal variation of nutrient inputs from atmosphere and to estimate atmospheric contribution to the lake nutrient budget, which are affecting the lake productivity and fisheries that are of great economic importance on the livelihoods of the residents in the basin.
2. Materials and Methods
2.1. Study Site
The study was conducted in Mwanza and Magu Tanzania. The area is located in the southern part of the Lake Victoria Basin, the second largest lake by area in the world, with surface area of 68,800 km2 (Figure 1). The short rains occur during September-December and long rains between March-May, resulting in a total annual rainfall of 700 to 1000 mm [8]. The lake receives inflows from 17 tributaries, which contribute less than 20% of the water entering the lake, the rest being provided by rainfall [9]. The catchment has a warm tropical savannah climate
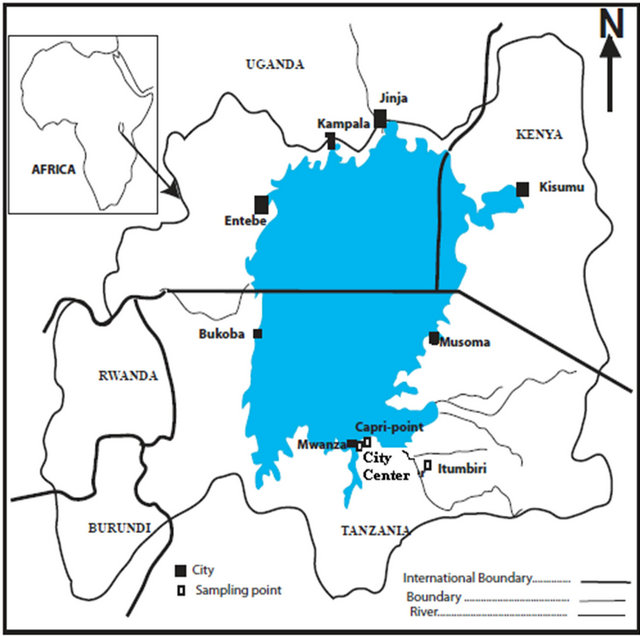
Figure 1. Map of East Africa showing Lake Victoria and sampling points.
with an average temperature of about 23˚C. Wind and rainfall patterns in the region are associated with an atmospheric belt of low pressure inter-tropical convergence zone (ITCZ). Sandy loam soil covers about 60% of the total catchment area [8].
The main land use/land cover of Mwanza is typical of urban settlement with urban population of 1.2 million and a metropolitan population of 2 million. It contains both formal and informal settlement. Main land use/land cover for Magu consists of mixed bare land and short grasses, dense and tall grass land, bush land, cultivated land and medium size grass land. A very small area is covered by surface water [8]. The most frequently grown crops are cotton and maize. Due to rainfall uncertainties most cropping systems practiced in this area are staggered planting (planting crops on different dates), inter cropping and flat cropping [10]. Forest cutting followed by burning is a common practice of land preparation for agriculture. Communal grazing is the most practiced livestock management system in Magu. Mwanza region hold a large proportion of the country’s livestock of about 13%.
2.2. Sample Collection and Analysis
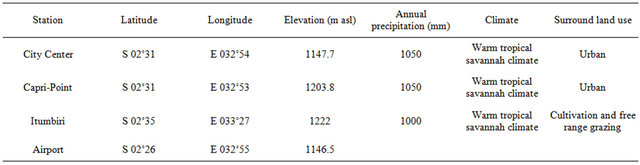
Rainwater samples were collected on monthly basis from three sites in Mwanza, Tanzania from January 2010 to January 2011. The three sampling locations were selected to reflect urban, peri-urban and rural activities. The characteristics of sampling sites are presented in Table 1.
The samples were collected from City Centre (Urban), Capri-Point (Peri-urban) in Mwanza and from Itumbiri in Magu (rural area). Rainwater samples were collected using a 23 cm diameter high density polyethylene funnels surrounded by sharp sticks to avoid birds from resting on the samplers, which were set at 1.2 m above the ground or surface of a flat roof. The funnel was connected to 20 L high density polyethylene container. During dry months the containers were rinsed with 1000 ml of de-ionized water to collect nutrients deposited by precipitation of dry matters. The water volume, temperature, TDS and pH were measured in situ before filtration. The filtered samples (0.45 µm) were analyzed for dissolved species ( ,
,  ,
,  and
and ), while the unfiltered samples were analyzed for total nitrogen and total phosphorous. The samples were stored by freezing for later analysis. The unfiltered samples were digested with potassium persulfate (30 min) under pressure and their total phosphorous contents were determined colorimetrically at 885 nm wave length using ascorbic method [11] by a bench-top spectrophotometer. Soluble reactive phosphorous (SRP;
 ) was analyzed from filtered and undigested samples by the same method.
The samples were digested with sulphuric acid and
Table 1. Characteristics of sampling sites.
hydrogen peroxide and analyzed for total nitrogen contents. Ammonium concentration was determined by indophenols method, which involved oxidation with sodium hypochlorite and addition of phenol solution in alkaline condition. Nitrite contents were also determined spectrophotometrically as diazo compounds, formed by the addition of sulphanilamide in the presence of naphthalene ethylenediamine reagent. Nitrate-nitrogen was analyzed by cadmium reduction method and detected as diazo complex. Results were computed using Microsoft Excel and figures were plotted using Kaleidal graph software.
3. Results
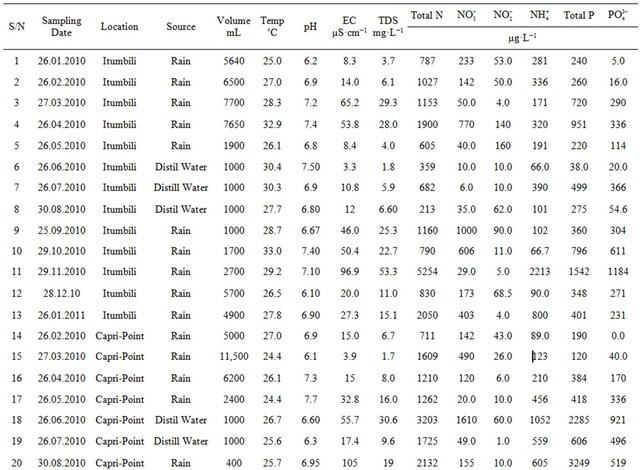
The results of analyzed parameters are presented in Table 2. Rainfall measurements as recorded by Tanzania metrological Agency (TMA) at Mwanza Airport Station showed that the rain events throughout the year followed a bimodal trend. Heavy rains were recorded from February to May. The volume of rainfall recorded by our samplers generally followed the trend of total rainfall. The water samples could not be collected in June and July when the total monthly rainfall documented were 0.6 and 6.7 mm, respectively.
The sample gadgets used in this study recorded annual rainfall as 956.4, 966 and 1083.9 mm for Itumbiri, CapriPoint and City Center, respectively. The values compared very well with the rainfall measurements recorded by Tanzania Meteorological Agency (1161.4 mm) and also the average rainfall (1095.8 mm) during the past thirty years. The total rainfall collected represented 82 to 93% of the total rain falling during the study period. Rainwater temperature in Mwanza ranged from 24.4 to 32.9˚C with general high temperature at rural area of Itumbiri and low temperature (cool water) close to the Lake Victoria at Capri-Point. The consequences of higher temperature at Itumbiri were reflected by lower collection of water volumes as well as complete evaporation in the month of August, in comparison with the other sampling sites. Rainwater pH is a good indicator of atmospheric pollution. When the pH is below 5.6, a pH value of distilled water equilibrated with carbondioxide [12], it is associated with anthropogenic pollution caused by excess concentration of hydrogen ions derived from the hydrolysis of NOx and SOx from combustion of fossil fuel. When the neutralizing materials are not enough, water tend to show pH below 7. The measured pH values indicated no sign of acid rain. In all the sampling sites, the rain water pH was above acid rain limit of 5.6, with the range between 5.82 and 8.1. The volume weighted mean pH value at each sampling location was close to neutral with value of 6.7, 6.5 and 6.6 for City Centre, Capri-Point and Itumbiri, respectively. Solute content of the precipitation as indicated by electrical conductivity (EC) and total dissolved solids (TDS) measurements showed very wide rage with inverse relationship with logarithm of water volume indicating the effect of dilution. The EC ranged from 3.3 µS·cm−1 to 170 µS·cm−1 while TDS range from 1.7 to 93.5 mg·L−1.
Total nitrogen concentration in the precipitation ranged from 190 µg·L−1 to 9086 µg·L−1 while nitrate nitrogen ranged between 5 µg·L−1 and 1822 µg·L−1. Nitrite nitrogen concentration ranged from 1 µg·L−1 to 174 µg·L−1 while ammonium nitrogen ranged between 6.0 µg·L−1 and 2213 µg·L−1. Total phosphorous found ranged from 38 µg·L−1 to 3248 µg·L−1 while  -P ranged from under detection to 1593 µg·L−1.
4. Discussion
4.1. Temporal Variation
Temporal variation of nutrients and other precipitation components may be affected by a number of factors including meteorological factors such as wind speed and direction, rainfall intensity, proximity to the source and human activities [13]. Rainfall intensity may affect the concentration of nutrients due to dilution. However it may also increase the nutrient concentration if the particular species is very soluble. The concentration may also vary within the rainy season with high concentration at the beginning of rainy season. Our results showed that the volume of rainwater collected during our sampling
Table 2. Physico-chemical and nutrient contents in the precipitation from Lake Victoria basin Tanzania.

campaign and the rainfall followed bimodal trend (Figure 2).
The first peak was in February to May with a maximum in March and the second was in September to December with maximum collection in October and December. This bimodal trend had significant influence in the quality of precipitation. For example, electrical conductivity showed the highest peak in August and September for urban and peri-urban areas while in rural area, Itumbiri, it showed two peaks in March and April and in November. Nutrient concentration also showed similar influence (Figure 3). Concentrations of all nutrients were
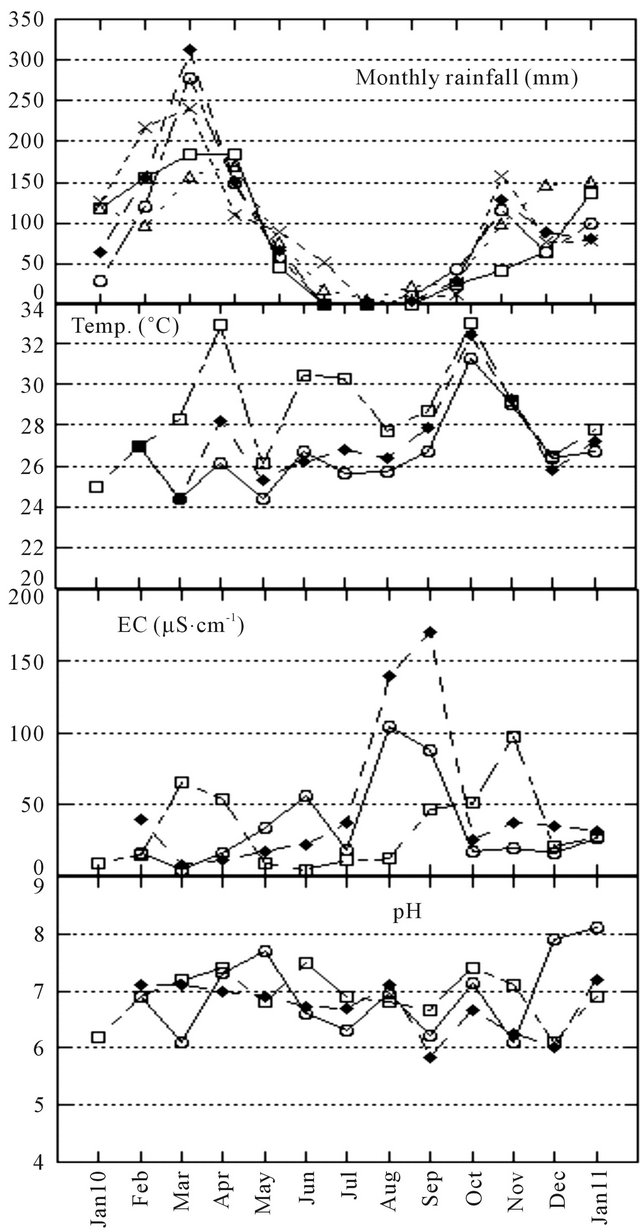
Figure 2. Temporary variation of physico-chemical parameters. Closed square: City centre (Urban), Open circle Capri-Point (Peri-urban), Open square: Itumbili (rural), Cross: Rainfall data as measured by TMA and open traingle: average monthly rainfall from 1980-2010.

higher during short rain season starting from August to December with maximum peaks in September, October and November for Urban, Peri-Urban and Rural areas, respectively. Three factors can be attributed to this trend. First is the rainfall pattern, as it has been previously explained, the rainfall intensity during this period of high peaks of nutrients was relatively low compared to the heavy rain season in February to May. This implies that dilution is relatively low leading to the highest concentrations of nutrients and other chemical species. Inverse trend between chemical species and rainfall intensity has been widely documented. Generally, heavy precipitation causes low concentrations of nutrients and their related components. For example [14,15] reported low concentration of chemical species in rainwater during heavy precipitation. Second factor attributed to high concentration during short rain might be due to accumulation of nutrients in the atmosphere during dry seasons of June to August. Consequently first rainfall of September responds to atmospheric washout which is usually accompanied with high concentration of dissolved species. This phenomenon has also been reported by [16] in their study of external source of nutrients for Lake Tanganyika. They found that dissolved inorganic nitrogen was the highest at the beginning of the rain season. In addition, land preparation for cultivation is actively pursued during this dry period in the study area.
Land preparation involves tree cutting followed by biomass burning, resulting into accumulation of atmospheric particles containing nutrients and other chemical species. Moreover, the soil is bared during this period which can easily be blown up by prevailing wind. Soil dust and particulate matters from biomass burning are expected to be washed out at the very initial onset of the wet season [13]. Dissolution of these species by first rain events could results into elevation of the concentration of nutrients in the precipitation. This was also supported by the presence of black residue deposited on the sampler funnel in the period of August and September. The third factor that may explain the seasonal trend is wind direction and speed. Wind has been reported as a very important factor for transportation and dispersion of atmospheric nutrients. The average ten year wind measurements showed that the frequency of maximum wind speed (5.7 - 8.2 m·s−1) from land side to the Lake Victoria through the sampling points reached maximum during August to December (Figure 4). It is possible that this turbulent wind carries nutrients from anthropogenic activities to the atmosphere which is then dissolved by falling rain.
4.2. Spatial Variation in Atmospheric Input
Sampling of precipitation was conducted to reflect urban area, peri-urban and rural environment of the Lake Victoria basin in Tanzania side of Mwanza. This selection was carried out to qualify and quantify the effect of respective activities on atmospheric pollution around the Lake. Volume of rainwater recorded was different among sampling sites hence the comparison of atmospheric inputs was done using volume weighted mean values calculated as shown in Equation (1).
 (1)
(1)
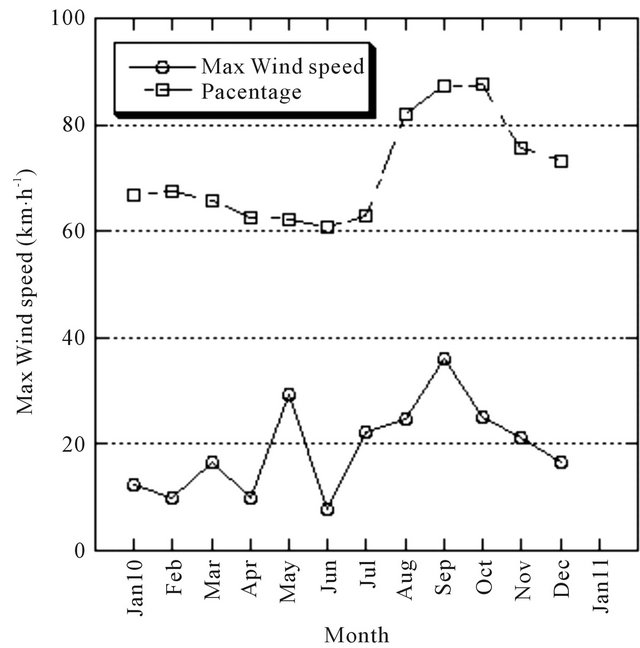
Figure 4. Average monthly variation of wind characteristics in Mwanza Region from 2000-2010.
where Ci is the measured concentration of individual specie and Vi is the Volume of rainwater during that sampling date.
The spatial variations of atmospheric inputs are shown in Figures 5(a) and (b). Rainwater from Rural area (Magu) was more concentrated with total dissolved solid reaching almost two times that of Capri-Point. This may partly be contributed by the difference in elevation which may affect atmospheric soil dust input at low elevation. In Itumbiri, samples were collected at 1.2 m above the ground while in Capri-Point the collection was done on the top of a building at about 20 m above the ground which was constructed at the top of a hill. On the other hand, volume weighted mean pH values were almost the same in all three sampling sites with values close to neutral, despite relatively high concentration of  in the urban area. This might be due to the neutralization process involving basic components such as
  and carbonate containing species. Sakihama et al. [12] showed that pH of precipitation was controlled by neutralization process in Okinawa Island.
The spatial variation of nutrients showed the following trend for TP: Rural > Peri-urban > Urban; : Rural > Peri-uban > Urban; TN: Peri-urban > Rural > Urban;
 : Urban > Peri-uban > rural;
 : Rural > Periuban > Urban and
 : Rural > Peri-uban > Urban as shown in Figure 5(b). The spatial variation of nutrients suggests importance of land use/cover in the atmospheric pollution around the Lake Victoria Basin. Urban and peri-urban areas where industrial and vehicle emission due to burning of fossil fuel are dominant, the concentration of nitrate nitrogen is high. Mwanza is the second
 (a)
(a)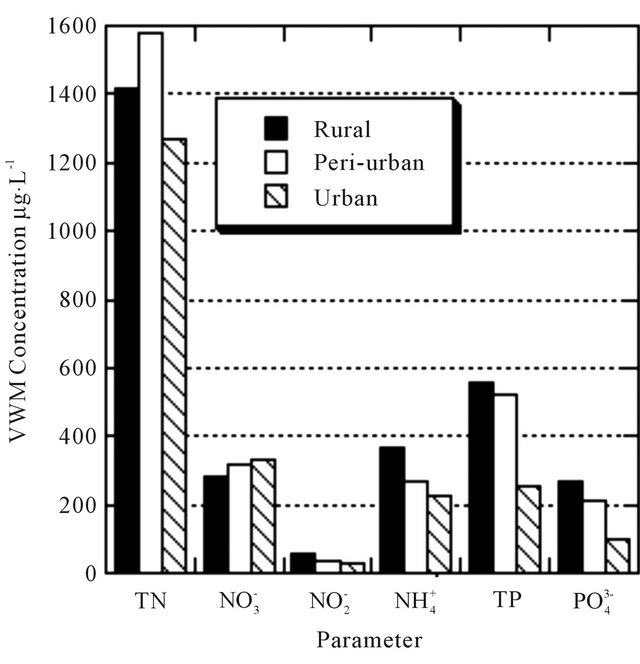 (b)
(b)
Figure 5. (a) Spatial variation of pH and TDS (mg·L−1) in precipitation; (b) Spatial variation of nutrients in the precipitation.
largest city in Tanzania hosting about 2 million peoples and number of medium and small scale industries. It is also a centre for connecting other Lake regions neighbouring all other East African countries. These activities might be responsible for high concentration of nitrate in the urban area.
On the other hand, the rural area are characterized by high concentration of phosphorous and reduced forms of nitrogen species due to the agricultural activities coupled with animal keeping by free range grazing. Phosphorous species are less volatile compared to nitrogen and therefore are not transported to a far distance and hence are of local origin. Phosphorous may also enter to the atmosphere through windblown soil and ash particles from forest burning. The results suggest that agricultural activities are major sources of phosphorous pollution to the atmosphere. This may be more important since burning is a common practice of land preparation for agriculture in the Lake Victoria Basin. Delmas et al. [6] and Hao and Liu [7] reported occurrence of large scale deforestation and biomass burning in the Lake Victoria basin. Crutzen and Andreae [17] attributed savannah fire as major source of P in the atmosphere and Artaxo et al. [18] found that 56% of the aerosol mass including that of P measured in the Amazon tropical forest was associated with biomass burning. It is likely that this phenomenon also takes place in the Lake Victoria Basin. Moreover, Itumbiri is a typical rural area in which dominant land uses are the cultivation and free range grazing of cattle and sheep. High concentrations of reduced forms of nitrogen are the signature of the agricultural area with intensive poultry activities [19]. These activities are characterized by emission of NH3 through fertilizer and livestock by-products. Increase in  concentration in rain water has been correlated with number of livestock in LA USA [19]. On particular importance to the lake ecosystem, higher concentration of reduced form of nitrogen species may have significant importance in lake ecological functioning since they are more readily assimilated by most aquatic organisms and thus may rapidly or effectively induced a community response than oxidized form[20].
4.3. Source of Nutrients
Nutrients in the atmosphere may be contributed by natural and anthropogenic sources. However, in the presence of high anthropogenic activities the concentration is usually high. Source of nutrients in the atmosphere could be due to burning of fossil fuels which produce among other pollutants NOx, lightning, biomass, soil particles from agricultural activities which may contain fertilizer residues, emission from soil bacterial process and ammonia volatilization from animal and human excreta, soil and senescing vegetation. Examination of correlation coefficient among the nutrients species indicate statistically significant correlation at 99% confidence interval according to Pearson correlation with the exception of  against
  (Table 3).
Strong correlation indicates common sources of the nutrient or similar scavenging mechanism involving nutrient species below cloud. Very strong correlation between phosphorus species and TN as well as  indicated possible influence of NPK fertilizers as sources of nutrients in the atmosphere around Lake Victoria basin on Tanzania side. The correlation may also be due to emission and dissolution of residue as a result of biomass
Table 3. Correlation coefficents of nutrients species in precipitation.
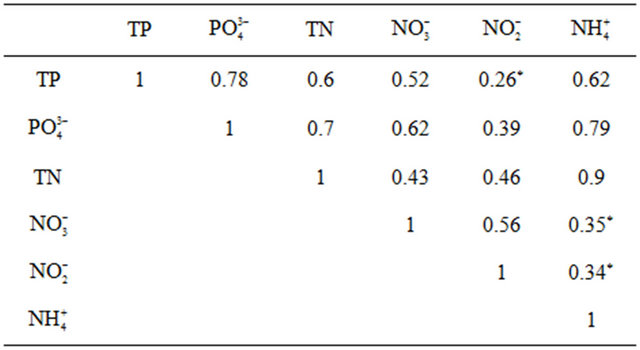
*Not significant at P > 0.005, No of sample 34.
burning. Bootsma et al. [21] attributed biomass burning with elevated concentration of nitrogen in the atmosphere while Artaxo et al. [18] found that 56% of the aerosol mass including that of P measured in the Amazon tropical forest was associated with biomass burning. The strong correlation at all sampling sites suggest that these activities are wide spread around the Lake basin. Peter and Reese [22] also found strong relationship of nitrogen species with total phosphorous and associated with common sources or depositional process. Zhang et al. [14] also attributed volatilization of ammonia from agri- cultural activities as an important source of N in rural area.
4.4. Nutrients Depositional Load
Volume weighted mean of nutrient deposition in three sampling sites ranges between 1.3 and 1.6 mg·L−1 and 0.3 and 0.6 mg·L−1 for total nitrogen and for total phosphorous, respectively. These values correspond to an average volume weighted mean of 1.4 and 0.44 mg·L−1 for total nitrogen and total phosphorous, respectively for the whole studied area. The annual depositional fluxes are calculated using Equation (2).
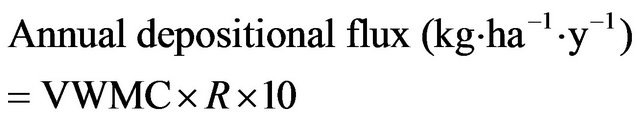 (2)
(2)
where VWMC (mg·L−1) is volume weighted mean concentration averaged for the whole studied area and R (m) is the 30-year average annual rainfall.
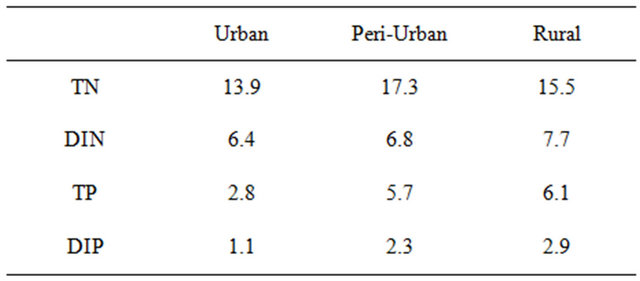
The Calculations give the annual flux of 15.3 kg·ha−1·y−1 and 4.8 kg·ha−1·y−1 for nitrogen and phosphorous, respectively (Table 4).
Dissolved inorganic nitrogen contributed about 45% while dissolved inorganic phosphorous contributed 43% of total nitrogen and phosphorous fluxes, respectively. The low percentage of dissolved inorganic phosphorous is predictable since there is no known gaseous form of phosphorous in the atmosphere. Phosphorous in the atmosphere exist mainly as small dust particals which can
Table 4. Annual nutrient flux (kg·ha−1·y−1) in the Lake Victoria Basin, Tanzania.
be precipitated as dry fallout or scavenged by falling rain drops. Therefore, it is likely that insoluble forms contribute to greater percentage of total phosphorous. Tamatamah et al. [5] reported that dry deposition was dominated by insoluble form of phosphorous contributing greater than 70% while in wet deposition they contributed about 50%. Bootsma et al. [21] also reported that dissolved inorganic phosphorous represented only 30% of total phosphorous in precipitation around Lake Malawi. Unlike phosphorus, nitrogen in atmosphere is mainly present as  and
and  [23]. The low percentage of the dissolved inorganic nitrogen found in our study suggest additional source of nitrogen input. The possible source of insoluble nitrogen might be ash and dust from biomass burning. This common source of nitrogen and phosphorous can also explain the strong relationship between TP and TN observed in this study (Table 3). The nutrients fluxes for the Simiyu-Duma river cathment where the study was carried out as estimated from data presented by [4] are 1.3 and 0.4 kg·ha−1·y−1, for total N and total phosphorous, respectively. The values are more than 10 times lower compared to atmospheric deposition. The results support the previous studies that atmospheric deposition is an important route for transporting nutrients to the Lake Victoria [4,5].
In comparison with other reported studies with similar precipitations amount (Table 5), nitrogen deposition in this study is lower than that reported for the Lake Taihu, China, but greater than that reported for the Lake Tanganyika, Tanzania, Sierra de Gata, Spain and Delaware Inland bay USA. Phosphorous deposition reported in this study is higher than that for Lake Malawi, previously reported value for the Lake Victoria, Lake Tanganyika and Lake Taihu.
Currently Lake Victoria is undergoing intensive ecological changes. Massive invasion of water hyacinth poses great challenges in economic, environmental and ecological sustainability of the lake. Phytoplanktonic biomass is now dominated by nitrogen fixing cyanobacteria (Anobaena and Cylindrospermopsis) coupled with non-fixing Microxystis and Planktolyngbya. This is attributed to the low TN:TP ratio as a results of high concentration of phosphorous which is at 2.5 µmol·L−1 [26].
Table 5. Annual nutrient depositional load (kg·ha−1·y−1).

The significant values of dissolved nutrients suggest that precipitation can stimulate primary production in the Lake Victoria. Interpreting these value, with regards to the primary production assuming that nutrient molar ratios in phytoplankton are C:N:P = 168:19:1 [27], dissolved inorganic nitrogen deposition will stimulate new primary production of 5.4 g·cm−2·y−1. Considering phosphorous which is usually considered as limiting nutrient [22,25], production is even greater 13.5 g·cm−2·y−1. The production may be even greater than our estimation because consideration of other soluble forms of nutrients such as dissolved organic nitrogen which has shown to be an important fraction in atmospheric deposition, has been ignored in this estimation [21]. For example at Lake Malawi dissolved organic nitrogen contributed between 30% and 50% of total dissolved nitrogen while [28] reported that dissolved organic nitrogen accounted for 30% of total dissolved nitrogen in tropical precipitation. In addition to that, the undissolved fraction can be mineralized depending on the aquatic condition. However the actual primary production may depend on other factors such as water depth. Moreover the estimation assumes linear dependency between primary production and nutrients which is not likely to happen.
5. Conclusions
The study was conducted to investigate temporal and spatial variation of nutrient input through atmosphere as influenced by land use activities in order to estimate the nutrient loading to the Lake Victoria. The results revealed both temporal and spatial variation. Temporal variation showed higher concentration during short rain season of September to December. This was due to soil and ash residue particles brought to the atmosphere by strong wind during dry period of June and August. The accumulated particles are then scavenged by relatively low intensity rain and hence released high concentrations of nutrients. Spatial variation was strongly influenced by land use activities. Urban and peri-urban where industrial activities are wide spread, is characterized by elevated concentration of nitrate-nitrogen and overall low nutrient loading while in rural area where agricultural activities accompanied with animal husbandry are dominate land use, is characterized by high concentration of phosphorous, reduced form of nitrogen species and high overall nutrient loading.
Nutrient species showed strong correlation among themselves suggesting common sources or scavenging mechanism. The major source of nutrient to the lake basin was suggested to be agriculture and their related activities. Therefore in order to have significant reduction of nutrient the measures should be directed to improve land use practices such as overland clearing, land preparation, forest burning and conservation of wetland and reduce industrial and vehicle emission. Nutrient deposition through atmosphere in Tanzania side of the Lake Victoria is significant high that can stimulates significant ecological functioning.
6. Acknowledgements
We are grateful to the Lake Victoria Research Initiative (VicRes) through the Inter-University Council for East Africa for financial support. We acknowledge The University of Dodoma and The State University of Zanzibar for allowing me to participate in this research. We are also grateful to assistance given by Mr. Allen Stafford and Mr. Azeria Maketu for sample collection and analysis. The revision done by Prof. R. V. Raju is highly acknowledged.
REFERENCES
- R. K. Turner, S. Georgiou, I. M. Gren, F. Wulff, B. Scott, T. Soderqvist, I. J. Bateman, C. Folke, S. Langaas, T. Zylicz, K. G. Maler and A. Markowska, “Managing Nutrient Fluxes and Pollution in the Baltic: An Interdisciplinary Simulation Study,” Ecological Economics, Vol. 30, No. 2, 1999, pp. 333-352. doi:10.1016/S0921-8009(99)00046-4
- N. R. Kulabako, M. Nalubega and R. Thunvik, “Phosphorus Transport in Shallow Groundwater in Peri-Urban Kampala, Uganda: Results from Field and Laboratory Measurements,” Environmental Geology, Vol. 53, No. 7, 2008, pp. 1535-1551. doi:10.1007/s00254-007-0764-0
- A. Beyene, W. Legesse, L. Triest and H. Kloos, “Urban Impact on Ecological Integrity of Nearby Rivers in Developing Countries: The Borkena River in Highland Ethiopia,” Environmental Monitoring and Assessment, Vol. 153, No. 1-4, 2009, pp. 461-476. doi:10.1007/s10661-008-0371-x
- COWI Consulting Engineers, “Integrated Water Quality/Limnology Study for Lake Victoria Environmental Management Project,” Part II Technical Report, 2002.
- R. A. Tamatamah, R. E. Hecky and H. C. Duthie, “The Atmospheric Deposition of Phosphorus in Lake Victoria (East Africa),” Biogeochemistry, Vol. 73, No. 2, 2005, pp. 325-344. doi:10.1007/s10533-004-0196-9
- R. A. Delmas, P. Loudjani, A. Podaire and J. Menaut, “Biomass Burning in Africa,” In: J. S. Levine, Ed., Global Biomass Burning. Atmospheric, Climatic and Biospheric Implications, The MIT Press, Cambridge, 1991. pp. 126-132.
- W. M. Hao and M. H. Liu, “Spatial and Temporal Distribution of Tropical Biomass Burning,” Global Biogeochemical Cycles, Vol. 8, No. 4, 1994, pp. 495-503. doi:10.1029/94GB02086
- J. Rwetabula and F. De Smedt, “Landuse and Land Cover Mapping of the Simiyu Catchment (Tanzania) Using Remote Sensing Techniques,” FIG Working Week 2005 and GSDI-8, Cairo, 16-21 April 2005.
- X. Yin and S. E. Nicholson, “The Water Balance of Lake Victoria,” Hydrological Sciences Journal, Vol. 43, 1998, pp. 789-811.
- H. C. C. Meertens and P. M. Lupeja, “A Collection of Agricultural Background Information for Mwanza Region,” Kilimo/FAO Plant Nutrition Programme in Tanzania, Field Document No. GCPF/URT/106/NET, Mwanza, 1996, 74 p.
- T. R. Parsons, Y. Maita and C. M. Lalli, “A Manual of Chemical and Biological Methods of Seawater Analysis,” Pergamon, Oxford, 1984.
- H. Sakihama, M. Ishiki and A. Tokuyama, “Chemical Characteristics of Precipitation in Okinawa Island, Japan,” Atmospheric Environment, Vol. 42, No. 10, 2008, pp. 2320-2335. doi:10.1016/j.atmosenv.2007.12.026
- M. O. Andreae, “Global Distribution of Fires Seen from Space,” Eos, Transactions American Geophysical Union, Vol. 74, No. 12, 1993, pp. 129-135. doi:10.1029/93EO00166
- Y. Zhang, X. J. Liu, A. Fangmeier, K. T. W. Goulding and F. S. Zhang, “Nitrogen Inputs and Isotopes in Precipitation in the North China Plain,” Atmospheric Environment, Vol. 42, No. 7, 2008, pp. 1436-1448. doi:10.1016/j.atmosenv.2007.11.002
- N. Rastogi and M. M. Sarin, “Chemical Characteristics of Individual Rain Events from a Semi-Arid Region in India: Three-Year Study,” Atmospheric Environment, Vol. 39, No. 18, 2005, pp. 3313-3323. doi:10.1016/j.atmosenv.2005.01.053
- V. T. Langenberg, S. Nyamushahu, R. Roijackers and A. A. Koelmans, “External Nutrients Source for Lake Tanganyika,” Journal of Great Lakes Research, Vol. 29, No. 2, 2003, pp. 169-180. doi:10.1016/S0380-1330(03)70546-2
- P. J. Crutzen and M. O. Andreae, “Biomass Burning in the Tropics: Impact on Atmospheric Chemistry and Biogeochemical Cycles,” Science, Vol. 250, No. 4988, 1990, pp. 1669-1678. doi:10.1126/science.250.4988.1669
- P. Artaxo, R. C. de Campos, E. T. Fernandes, J. V. Martins, Z. Xiao, O. Lindqvist, M. T. Fernandes-Jimenez and W. Maenhaut, “Large Scale Mercury and Trace Element Measurements in the Amazon Basin,” Atmospheric Environment, Vol. 34, No. 4, 2000, pp. 4085-4096. doi:10.1016/S1352-2310(00)00106-0
- J. R. Scudlark, J. A. Jennings, M. J. Roadman, K. B. Savidge and W. J. Ullman, “Atmospheric Nitrogen Inputs to the Delaware Inland Bays: The Role of Ammonia,” Environmental Pollution, Vol. 135, No. 3, 2005, pp. 433- 443. doi:10.1016/j.envpol.2004.11.017
- H. W. Pearl and D. R. Whitally, “AnthropogenicallyDerived Atmospheric Nitrogen Deposition, Marine Eutrophication and Harmful Algal Bloom Expansion: Is Thre a Link?” Ambio, Vol. 28, 1999, pp. 307-311.
- H. A. Bootsma, M. A. Bootsma and R. E. Hecky, “The Chemical Composition of Precipitation and Its Significance to the Nutrients Budget to Lake Malawi,” In: T. C. Johnson and E. Odada, Eds., Limnology Climatology and Paleoclimatology of the East African Lakes, Gordon and Breach Publishers, 1996, pp. 251-256.
- N. E. Peter and R. S. Reese, “Variation of Weekly Atmospheric Deposition for Multiple Collectors at a Site on the Shore of Lake Okeechobee, Florida,” Atmospheric Environment, Vol. 29, No. 2, 1995, pp. 179-187. doi:10.1016/1352-2310(94)00233-B
- K. M. Russel, J. N. Galloway, S. A. Macko, J. L. Moody and J. R. Scudlak, “Sources of Nitrogen in Wet Deposition to the Chesapeake Bay Region,” Atmospheric Environment, Vol. 32, No. 14-15, 1998, pp. 2453-2465. doi:10.1016/S1352-2310(98)00044-2
- G. M. Marcos and J. F. G. Lancho, “Atmospheric Deposition in Oligotrophic Quercus Pyrenaica Forest: Implications for Forest Nutrition,” Forest Ecology and Management, Vol. 171, No. 1-2, 2002, pp. 17-29. doi:10.1016/S0378-1127(02)00458-9
- Y. W. Chan, C. X. Fan and M. Dokulil, “Changes of Nutrients and Phytoplankton Chlorophyll-a in a Large Shallow Lake, Taihu, China: An 8-Years Investigation,” Hydrobiologia, Vol. 506-509, No. 1-3, 2003, pp. 273-279. doi:10.1023/B:HYDR.0000008604.09751.01
- S. J. Guildford and R. E. Hecky, “Total Nitrogen, Total Phosphorus and Nutrient Limitation Inlakes and Oceans: Is There a Common Relationship?” Limnology and Oceanography, Vol. 45, No. 6, 2000, pp. 1213-1223. doi:10.4319/lo.2000.45.6.1213
- M. Järvinen, K. Salonen, J. Sarvala, K. Vuorio and A. Virtanen, “The Stoichiometry for Particulate Nutrients in Lake Tanganyika—Implications for Nutrient Limitation of Hytoplankton,” Hydrobiologia, Vol. 407, 1999, pp. 81- 88. doi:10.1023/A:1003706002126
- T. J. Eklund, W. H. Mcdowell and C. M. Pringle, “Seasonal Variation of Tropical Precipitation Chemistry: La Selva, Costa Rica,” Atmospheric Environment, Vol. 31, No. 23, 1997, pp. 3903-3910.
NOTES
*Corresponding author.