International Journal of Astronomy and Astrophysics
Vol.4 No.3(2014), Article
ID:48869,5
pages
DOI:10.4236/ijaa.2014.43043
Optical Luminosity Function of the QSOs Observed with the Sloan Digital Sky Survey Data Release Seven (SDSS DR7)
Salam Ajitkumar Singh1, Irom Ablu Meitei2, Kangujam Yugindro Singh1
1Department of Physics, Manipur University, Imphal, India
2Department of Physics, Pettigrew College, Ukhrul, India
Email: ajitkumarsalam@gmail.com, ablu.irom@gmail.com, yugindro361@gmail.com
Copyright © 2014 by authors and Scientific Research Publishing Inc.
This work is licensed under the Creative Commons Attribution International License (CC BY).
http://creativecommons.org/licenses/by/4.0/


Received 19 June 2014; revised 15 July 2014; accepted 10 August 2014
ABSTRACT
We have determined the Optical Luminosity Function (OLF) of a sample of 80946 Quasi Stellar Objects (QSOs) taken from the Sloan Digital Sky Survey Data Release Seven (SDSS DR7) with redshift range  and absolute magnitude
 . The Monte Carlo Technique of numerical integration is used. The sample of QSOs is divided into seven sub-samples with redshift in the ranges:
 ,
,  ,
,  ,
,  ,
,  ,
,  , and
, and . Each redshift interval is binned in absolute magnitude with bin width
 . A flat universe with cosmological parameters
 ,
,  , and Hubble constant
  is used. From the optical luminosity function a clear evidence of AGN downsizing is observed, i.e. the number density of the less luminous AGNs peaks at lower redshift than the number density of the more luminous AGNs.
Keywords:Quasi Stellar Objects (QSOs), Luminosity Function

1. Introduction
The present paper describes a study of the optical luminosity function of Quasi Stellar Objects (QSOs). The luminosity function is defined as the number of QSOs per unit comoving volume of the universe [1] . A correct luminosity function of QSOs can describe the space and luminosity distributions of the objects. The study of the luminosity function may provide a tool for estimating the acceptable value of the cosmological constant [2] . It provides a basis for determining the amount of matter in different forms in the universe [3] . In the study of Active Galactic Nuclei (AGN), the accurate measurement of the luminosity function of QSOs is very important. One of the key goals of studying AGN is to characterize and understand their strong evolution [4] . In particular, the study of the luminosity function of QSOs as a function of redshift provides essential constraints on how the population characteristics of the QSOs have changed with time and also provides strong constraints for the physical models and evolutionary theories of QSOs. The QSO optical luminosity function and its evolution with redshift provide fundamental information on the demographics of the QSO population, in particular and AGN population in general [2] [5] .
In Section 2, we present a brief description of Sloan Digital Sky Survey Data Release Seven (SDSS DR7). In Section 3 determination of the optical luminosity function of QSOs is described. Results and discussion are given in Section 4.
2. The Data
The Sloan Digital Sky Survey (SDSS) [6] is a major multi-filter imaging and spectroscopic redshift survey carried out with a dedicated 2.5 m wide-angle optical telescope at Apache Point Observatory (APO) near Sacramento Peak in Southern New Mexico, USA. The telescope’s camera is made up of thirty CCD chips each with a resolution of 2048 × 2048 pixels, totally approximately 120 Megapixels. The chips are arranged in five rows of six chips. Each row has a different optical filter with average wavelengths of 3551 Å , 4686 Å , 6165 Å, 7481 Å and 8931 Å with 95% completeness in typical seeing to magnitudes of 22.0, 22.2, 22.2, 21.3 and 20.5 for ,
,  ,
,  ,
,  ,
,  respectively. The filters are placed on the camera in the order
 ,
,  ,
,  ,
,  ,
,  [7] . The SDSS survey covers more than one-quarter of the entire sky which performing photometry and spectroscopy for galaxies, stars and quasars [8] .
In this work, we use the Sloan Digital Sky Survey Data Release Seven (SDSS DR7) which contains a total of 105783 QSOs [6] . The SDSS DR7 represents the completion of SDS-II phase (2005-2008). It provides imaging data for 357 million distinct objects in the five bands (ugriz), as well as spectroscopy over  steradians in the North Galactic cap and 250 square degrees in the South Galactic cap [8] . This catalog covers an area of ≈9380 deg2. The quasar redshift range of this catalog is from 0.065 to 5.46 and the absolute magnitudes in i-band are in the range of
 . The redshift distribution of QSOs (redshift bins = 0.1) is shown in Figure 1. In this graph dips are found in the QSO count at
  and
and . This is due to incompleteness of the SDSS Quasars Survey at redshifts between 2.5 and 3.0. The majority of QSOs are found in redshift below two
  [9] . This means that either the density of quasars was higher in the past or they were brighter or any combination of these two effects [1] . Detailed information about the SDSS DR7 can be found in Donald P. Schneider et al. (2010) [6] .

Figure 1. The redshift distribution of QSOs in SDSS DR7 catalog.
3. The Optical Luminosity Function
Figure 2 shows the absolute magnitude,  versus redshift distribution of QSOs of our sample. The redshift range
  is used for determining the luminosity function due to uniformity of QSOs found within this redshift range (Figure 2). Using the sample of SDSS DR7, we calculate the binned luminosity function of QSOs over
  and absolute magnitude
 , using the binned estimate of the luminosity function devised by Page & Carrera [10] ; the binned estimate of the luminosity function is given by

where  is the number of objects of luminosity
  found in comoving volume
  at redshift
 . The sample of QSOs in the given redshift range (i.e.
 ) are divided into seven sub-samples with redshift in the ranges:
 ,
,  ,
,  ,
,  ,
,  ,
,  , and
, and . Each redshift interval is binned in absolute magnitude with bin width
 . The resulting optical luminosity function, calculated for
 ,
,  and
and  , is shown in Figure 3. The values of log φ shown in Table 1 are for the first four redshift sub-samples. The numbers of QSOs contributing to the luminosity functions
  for each sub-sample are also listed in Table1
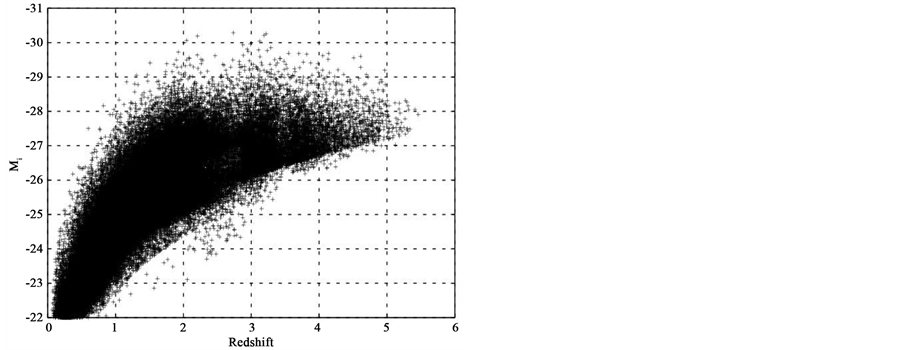
Figure 2. The Absolute Magnitude-Redshift distribution of QSOs in SDSS DR7 catalog.
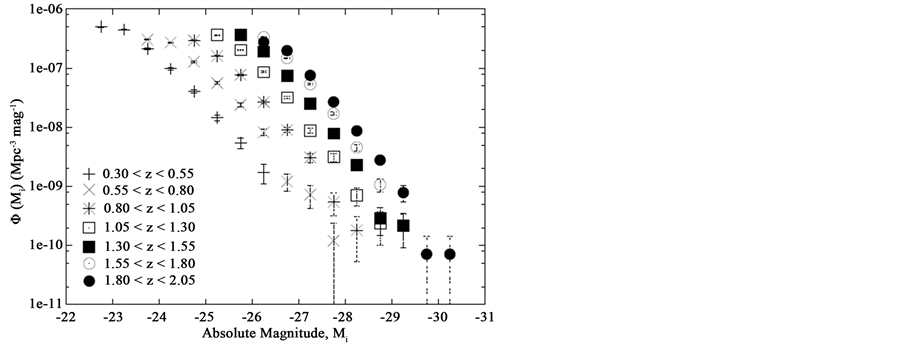
Figure 3. Luminosity functions of QSOs for the SDSS DR7 ( ,
, ,
, ).
).

Table 1. Optical luminosity function of QSOs in the SDSS DR7.
4. Results and Discussion
We have studied the optical luminosity function for 80,946 QSOs in the SDSS DR7 catalog with redshift  and
and . The QSOs have been divided into seven redshift bins. It is observed that the shapes of the luminosity functions are similar in the seven bins, with a very steep high-luminosity tails at bright magnitudes and the luminosity function at fainter magnitudes approaches towards a simple power-law form with rather flat slope. From Figure 3 it is observed that there is signature of AGN downsizing that is, the number density of fainter AGNs peaks at lower redshift as compared to the number density of the more luminous AGNs. This is in agreement with the results of Croom et al. 2009 [4] .
Acknowledgements
Funding for the SDSS and SDSS-II and distribution of the SDSS Archive has been provided by the Alfred P. Sloan Foundation, the Participating Institutions, the National Aeronautics and Space Administration, The National Science Foundation, the U.S. Department of Energy, the Japanese Monbukagakusho and the Max Planck Society. The SDSS Web site is http://www.sdss.org/. We are indebted to the SDSS Survey team.
One of the authors (S. Ajitkumar Singh) is grateful to the Indian Space Research Organization, Department of Space, Government of India for providing him a JRF under a RESPOND Project (ISRO/RES/2/385/2013-14).
References
- Kembhavi, A.K. and Narlikar, J.V. (1999) Quasars and Active Galactic Nuclei. Cambridge University Press, Cambridge. http://dx.doi.org/10.1017/CBO9781139174404
- Meitei, I.A. and Singh, K.Y. (2013) The Evolution QSOs—The Optical Luminosity Function. International Journal of Astronomy and Astrophysics, 3, 87-92. http://dx.doi.org/10.4236/ijaa.2013.32009
- Osmer, P. (2006) Quasistellar Objects: Overview from Encyclopedia of Astronomy and Astrophysics. P. Murdin. IOP Publishing Ltd., London.
- Croom, S.M., et al. (2009) The 2dF-SDSS LRG and QSO Survey: The QSO Luminosity Function at 0.4 < z < 2.6. Monthly Notices of the Royal Astronomical Society, 399, 1755-1772. http://dx.doi.org/10.1111/j.1365-2966.2009.15398.x
- Fontanot, F., et al. (2006) The Luminosity Function of High-Redshift Quasi-Stellar Objects. A combined Analysis of GOODS and SDSS. Astronomy & Astrophysics, 461, 39-48. http://dx.doi.org/10.1051/0004-6361:20066073
- York, D.G., et al. (2000) The Sloan Digital Sky Survey: Technical Summary. The Astronomical Journal, 120, 1579-1587. http://dx.doi.org/10.1086/301513
- Abazajian, K.N., et al. (2009) The Seventh Data Release of the Sloan Digital Sky Survey. The Astrophysical Journal Supplement Series, 182, 543-558. http://dx.doi.org/10.1088/0067-0049/182/2/543
- O’Mill, A.L., et al. (2010) Photometric Redshift and K-Correction for Sloan Digital Sky Survey Seven Data Release. Monthly Notices of the Royal Astronomical Society, 1-14.
- Schneider, D.P., et al. (2010) The Sloan Digital Sky Survey Quasar Catalog V. Seven Data Release. arXiv:1004.1167v1 [astro-ph.CO].
- Page, M.J. and Carrera, F.J. (2000) An Improved Method of Constructing Binned Luminosity Functions. Monthly Notices of the Royal Astronomical Society, 311, 433-440. http://dx.doi.org/10.1046/j.1365-8711.2000.03105.x