International Journal of Astronomy and Astrophysics
Vol.4 No.1(2014), Article ID:43527,16 pages DOI:10.4236/ijaa.2014.41007
Optical to Mid-Infrared Analysis for the Galaxy Group RSCG 44
J. A. Pérez-Grana1,2, S. N. Kemp2, J. P. Phillips2
1Instituto Tecnológico Superior de Chapala, Ajijic, México
2Instituto de Astronomía y Meteorología, Guadalajara, México
Email: arturopg@astro.iam.udg.mx
Copyright © 2014 by authors and Scientific Research Publishing Inc.
This work is licensed under the Creative Commons Attribution International License (CC BY).
http://creativecommons.org/licenses/by/4.0/


Received 15 November 2013; revised 15 December 2013; accepted 23 December 2013
ABSTRACT
We present the detailed Optical to Mid Infrared (MIR) analysis on the compact group of galaxies RSCG44. The optical analysis comprehends both photometric and spectroscopic studies for six galaxies in this group. The overall Optical to MIR data provide maps, spectra, profiles and images to analyse galaxy properties (structure, line-strength features, etc.) of each member searching for signatures of star formation and nucleus activity. In the photometric analysis, we study $BVR$ surface brightness and colors calculated for regions such as galaxy centers, possible bridges, tails and optical knots. Optical direct image also presents residual images (after subtracting isophotal models) and unsharp masked images in order to uncover any hidden structure in the system. The inclusion of maps, profiles and images from the Spitzer Space Telescope (SST) was made in order to provide a complementary outlook for the optical colors and the environment in which the group evolves, hence, a better explanation of the photospheric component and possible photdissociation regimes in polycyclic aromatic hydrocarbon (PAH) emission at 5.8 and 8 µm have provide a disentangled view of dust properties in the interstellar medium (ISM) at MIR. Optical spectra for the group are also provided to establish a more fond comparison between optical to mid infrared properties. The color gradients were compared with the optical spectra of both galaxies, showing in general similar trends for star formation. Globally, color maps, color tables and optical spectra indicate predominant stellar populations from classes I, III and V corresponding to spectral types of K-M stars with ages of at least in the order of 10 Gyr for models using metallicity ranges with solar and non solar abundances. These results lead us to the conclusion of a moderate star formation rate and a tranquil evolving state of the system.
Keywords:Galaxy; Photometry Galaxy; Spectroscopy Galaxy; Interactions Galaxies; Evolution

1. Introduction
Among the investigation for the global picture of the star formation history in the local Universe, one of the key questions on the subject arises when asking the question: what drives the changes in the star formation rates (SFR’s) in individual galaxies? Diversal causes, such as interactions and environment dependency, point the SFR as a function of different variables (like mass, time, lumnosity, chemical composition, etc.). In order to investigate the evolution of SFR’s in galaxies, it is necessary to have a large range of galaxy properties obtained with accurate photometric and spectorscopic data.
Groups of galaxies in different environments provide us with unique characteristics for the study of each individual member in the group and the evolution of the group itself. A well known specific characteristic is the low-velocity dispersions of the group, and this characteristic leads to slow encounters between galaxy members. The phenomena of galaxy encounter were predicted to cause star formation episodes [1] and active galactic nucleus (AGN) activity.
Interactions between galaxies in groups were predicted to be more frequent on compact groups of galaxies by theoretical models [2] -[4] where tidal forces are the main reason for appeared tails and bridges and a subsequent triggered star formation, hence, an expectation of bluer colors and emission lines at the Balmer Hβ was predicted at observations.
The updated observations (ever since the first mentioned models) revealed that the interaction rate in compact groups, was larger than clusters, and gave evidence on how the encounter (collision) process also alters the group galaxy population (in the case of galaxy mergers, for example) and the properties of the intergalactic medium (IGM). However, the rate of star formation was not as high as predicted by the first models in some group samples [4] , while others, like the study made by Severgnini & Saracco [5] with a sample of 95 galaxies in 31 HCG’s, suggested that higher levels of star formation (measured by Hα emission) are associated with slower interactions between the group members.
The study of compact groups in the local universe is of great interest within the context of galaxy evolution, where good examples of candidates for fossil groups have been found at low redshifts [6] , these kind of empirical studies contribute to the recent interest in trying to identify the mechanisms driving galaxy evolution on different environments [7] .
Another example of galaxy group evolution are the HI observations in 70 HCG’s by Verdes-Montenegro et al. [8] were the proposed scenario, is a loose group that first contracts into a compact group and then further sequences of evolution trigger merger events for at least a couple of the members of the group where the final product exhibits an early type galaxy within a fossil group. After this stage, galaxy morphology tends to evolve to that of an early type, in which HI gas is extracted, dispersed and X-ray gas is created. Here, the gas is redistributed from the quiescent interstellar medium to fuelstar formation, power AGN activity, and produces different observable processes such as bridges and tidal tails (which also contributes to the enriched intracluster medium).
Thermal infrared observations with the Infrared Space Observatory (ISO) have also showed how star formation, AGN activity and the presence of cold/warm dust related to the group environment, where signatures in the infrared emission of the group members have been already found [9] [10] .
It is possible to study galaxy groups as being part of galaxy clusters within an infalling frame theory where they must first interact with the environment before even coming close to the center of the cluster [11] [12] . The study of galaxy groups in clusters could be also a possibility to address cluster evolution in earlier epochs than the evolution observed in the local universe where the structures involved in cluster evolution are often subclusters with a mass of ~5 × 10⁴ M⊙, higher than the typical mass of a compact group (~1013 M⊙).
In a multi-wavelength study from optical to NIR, we have made a pilot test to analyze and present a single group of galaxies that could be referred as a group infalling into a cluster. RSCG 44 compact group of galaxies at a = 11h44m00s, d = 19˚56'44" (Epoch 2000), at z = 0.021 or 84 Mpc in calculated distance with H0 = 75 kms−1Mpc−1 (Figure 1), part of Abell 1637 (z ~ 0.0216), was observed as part of a larger sample of galaxy groups for an environment type study. However, similar characteristics found in this group makes it comparable to those groups presented by Cortese et al. [11] , hence, we present this single case as an option to provide more information rewarding previous results.
The paper is divided as follows: Section 2 presents the group of galaxies and its previous literature, Section 3 presents and describes the techniques used for the data, Section 4 shows the results obtained and finally section 5 gives our discussion and conclusions of this group of galaxies.
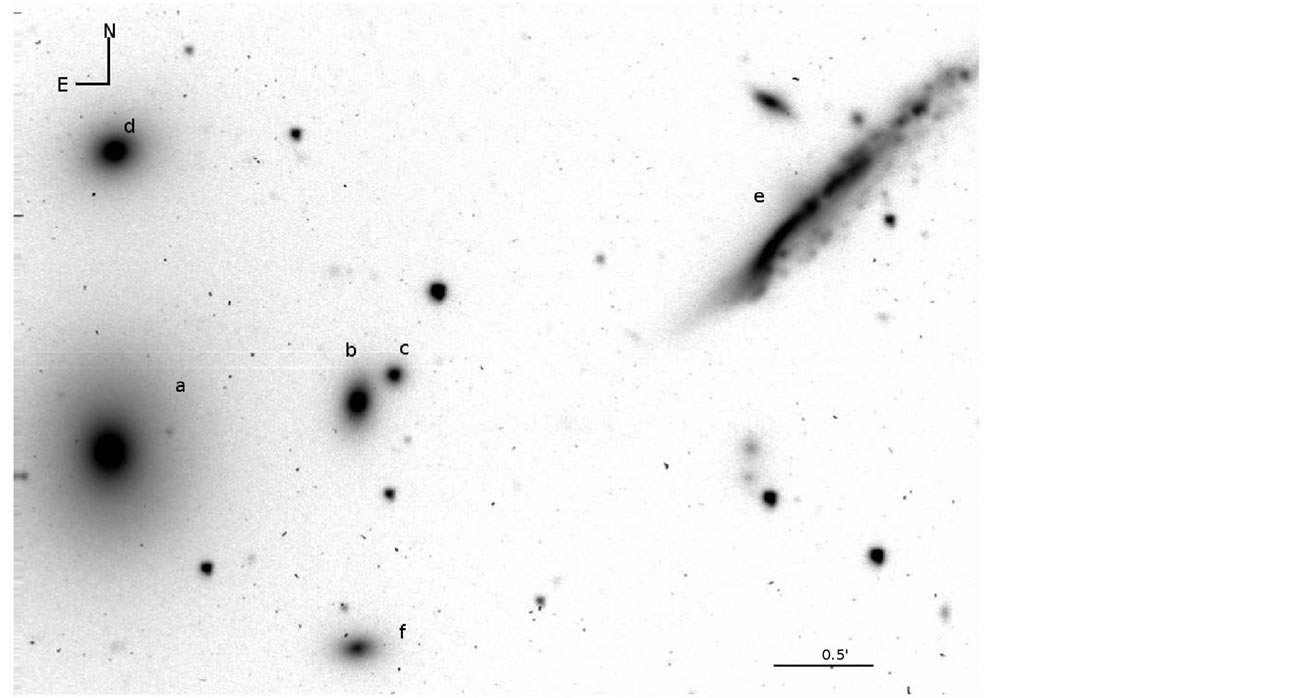
Figure 1. Image from the 1.5 m telescope showing the RSCG 44 in B filter showing the 6 members of the group denoted as a, b, c...f respectively.
2. RSCG44 in the Literature
The RSCG 44 group is in fact a compact group of galaxies (whose main properties are comparable to that of Hickson Compact Groups) with 6 identified members, this group is part of the Abell 1367 cluster. The Abell 1367 cluster, contains 4413 confirmed members [13] , however, the apparition of the RSCG 44 nomenclature for the compact group is first mentioned by Barton et al. [14] in their magnitude-limited red shift survey based on projected separation and association in red shift alone. All six members of the RSCG 44 group are embebed in a ~52 kpc radius with velocity dispersions ranging from s = 300 - 600 kms−1. As seen in Figure 1 there is a small companion NE of RSCG E, however its measured radial velocity (approximate 7500 kms−1, [15] leaves it out of the compact group membership (as defined by Barton et al. [14] ).
The identification of thegroup alone is made trough a group-finding algorithm with the Ramella et al. [16] codes from the CFA2 [17] and the Southern Sky Red shift Survey (SSR2) [13] magnitude limited redshift survey for HCG-like systems. In chronological order the RSCG nomenclature is used in this paper for this compact group.
A year later from the same group of authors of Barton et al. [14] , Ramella et al. [16] applies their same codes for a more extensive catalog also based on redshift surveys. The codes were based on the Friends-of-Friends Algorithm (FOFA) originally made by Geller et al. [17] . This algorithm identifies regions which exceeds a specific threshold galaxy density. In this new catalog, the RSCG 44 compact group is identified as part of a larger group of 65 galaxies, with the nomenclature RPG97. The last mention of this group as such is made in Ramella et al. [18] on an application of Ramella et al. [16] algorithms to the Updated Zwicky Catalog [8] and the SSR2 catalog in this last paper the compactgroup is part of a new larger group of 72 galaxies.
The fact that the Barton et al. [14] and Ramella et al. [16] [18] catalogs used a selection criteria similar to those of HCG’s (≥3N, mG ≤ 26Dr/r ≥ 80, V0 ≥ 320 kms−1 etc.) provide us with the advantage that this compact group should be in principle isolated and distinct from its surroundings as are HCG’s, the RSCG’s have an isolation criteria of g = qN/qG [14] , were qGis the smallest circle including all galactic centers andqN is the largest concentric circle which contains no galaxies within 1200 kms−1, this isolation criteria being distinct from Hickson’s were qG < q < 3qG can cause bonafide systems to fail.
Different results have been thrown up for environments in HCG’s Rubin, Hunter & Ford [19] , Ramella et al. [16] [18] , Severgnini & Saracco [9] , they reveal that some HCG’s are embedded in denser environments. Even when the environment selection of RSCG 44 was chosen by in such way that the system is ‘isolated’ as HGC’s most of RSCG’s are indeed part of loose groups or larger structures, henceour motivation to perform this analysis still tries to complement the answers for whether or not compact groups are gravitationally bound systems affected by their environment.
Recent similar analysis than ours have appeared with Walker et al. [19] who used this compact group as part of a larger sample to compare Hickson compact groups properties as well as environment properties of RSCG’s with MIR colors, however, this paper provides a more indetailed analysis of the RSCG 44 group using a different approach than that made by Walker et al. [19] . There is also an analysis performed by Iglesias-Paramo et al. [6] where a r’-band luminosity function for the Abell 1367 cluster were a list of members includes RSCG 44 and measures R-band magnitudes is shown.
3. Observations and Data Reduction
The data include two observational periods from the different telescopes, direct image from the 1.5 m Telescope and spectra from the 2.1 m Telescope of the Observatorio Astronómico Guillermo Haro (OAGH, Cananea, Hermosillo). We also took spectra from the SDSS public archive and the Spitzer Telescope public archives.
3.1. The 1.5 m SPM Telescope
We have taken direct image with the SITeI Charge Couple Device (CCD) with the BVR Jhonson filters in the Italian filter wheel. The observations were taken during the 18 - 20 of march 2009. We obtained total combined exposure times of 1.5, 1 and 0.5 hr in BVR respectively. The scale for the data was of 0.27” pixel−1 and the CCD field of view was 5.1’ × 5.1’ with a typical seeing of ~2.5”. We use a Hubble constant of H0 = 75 kms−1 and calculate a distance of 84 Mpc Sky brightness during these observations were μB,sky ~ 22 mag/arcsec2.
3.2. The 2.1 m SPM Telescope Spectra
Spectra from the 2.1 SPM telescope was obtained during the 14 - 19 of may 2009, the spectra comprehends1.5 hr of total combined expositions. A Boller & Chivens spectrograph with a SITe1 CCD was used. We had a pixel size of 0.61” pixel−1 with a grating of 150l/mm, a blaze angle of 5000, the slit aperture at 160 µm, 2.38 pixel−1 of dispersion and a mean spectral resolution of 9.79 - 10. This resolution was chosen in order to calculate Lick spectral indices for the members, hence, a set of 15 Lick stars contemporary to the observations were taken in order to make an appropriate calibration. The conditions in the observations made only possible to obtain four (members, A, B, C, F) out of six total spectra of the compact group. In order to complete the sample we used the archives from the Sloan Digital Sky Survey (SDSS).
3.3. The Sloan Digital Sky Survey Spectra
The Sloan Digital Sky Survey is a digital photometric and spectroscopic survey that cover one quarter of the sky using a 2.5 m at the Apache Point Observatory. The only available spectrum from our incomplete sample was that of galaxy member RSCG 44D, written as file spSPec-54180-2509-432 from the SDSS website Data Release 6 [20] . One spectrum is missing from the SDSS archives, this is identified by us as member E. The SDSS spectra cover a wavelength range of 3800 - 9200 Å with a mean resolution of 3 - 3.6 Å. (see www.sdss.org/dr6/products/spectra/index.html for more details about the spectra) In order to have the same resolution as the rest of the sample, the spectrum was smoothed with a Gaussian function as indicated in Section 3.
3.4. The Spitzer Space Telescope Data
Data from the Infrared Array Camera (IRAC, [8] ) were taken from the SST web page for the RSCG 44 group in the archives SPITZER-I1-3558688-0000-5-E2023541,SPITZER-I2-3558688-0000-5-E2024156, SPITZER-I3- 3558688-0000-5-E2024438 andSPITZER-I4-3558688-0000-5-E2025087, for the 3.5 µm (filter bandwidth dl = 0.75 µm), 4.5 µm (dl = 1.90 µm), 5.8 µm (dl = 1.45 µm) and 8 µm (dl = 2.91 µm) respectively.
3.5. Data Reduction
Photometric Reduction
The standard bias-dark-flat process to reduce the data in IRAF1. We have produced a color image (Figure 2)
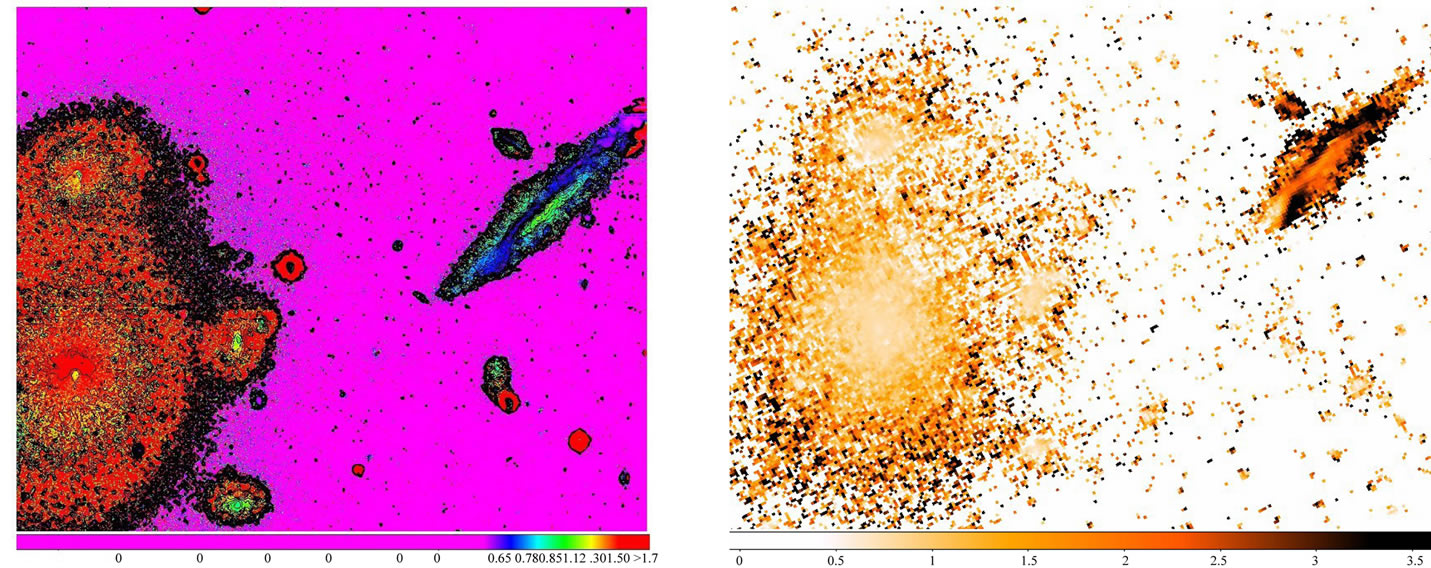
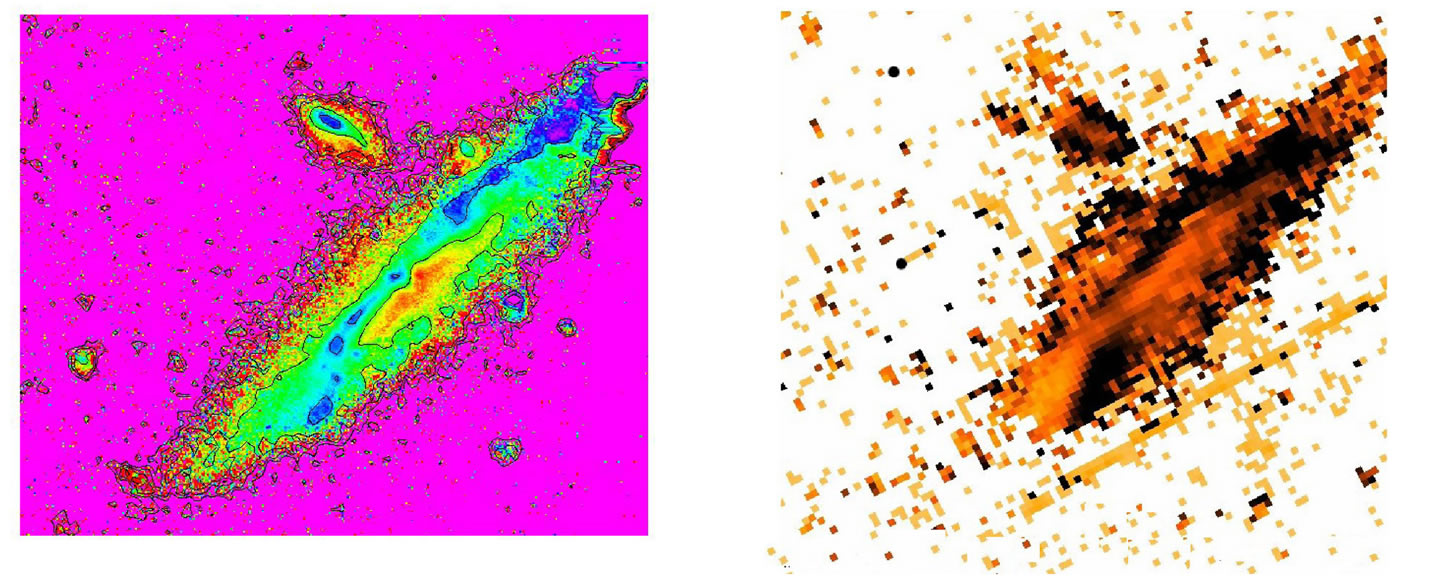
Figure 2. From left to right, above: (B-V) color map of the group, (red zones correspond to redder colors while bluer zones correspond to bluer colors), (5.8 µm/4.5 µm) color map where darker colors correspond to bluer zones. Below, from left to right: (B-V) color map of galaxy member E (same scale of colors as first optical color map), d) (5.8 µm /4.5 µm) color map of galaxy member E, where darker colors correspond to bluer zones.
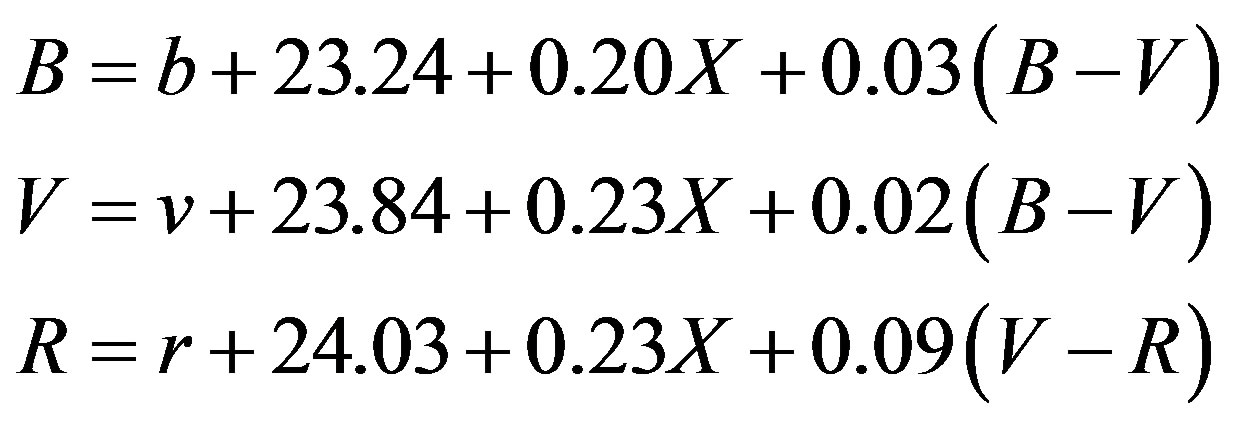
with the three combined filters were the colors respectively correspond to the three filters: red R, green V and blue B. Along with sky subtraction we made a seeing correction to BV images applying a convolution function in order to smooth the image. The standard photometric equation used in [21] was applied in the same manner in this work. In each run observations of Landolt standard fields containing Palomar Green stars were performed during the night at a range of air-masses. Instrumental magnitudes were obtained using IRAF’s phot task. Estimates of the extinction coefficients were obtained by plotting instrumental magnitudes against air-mass for multiple observations of the same field of standard stars, and these estimates of the extinction coefficients were used to derive values for the photometric zero points and color terms. Using the standard format for the linear calibration equation:
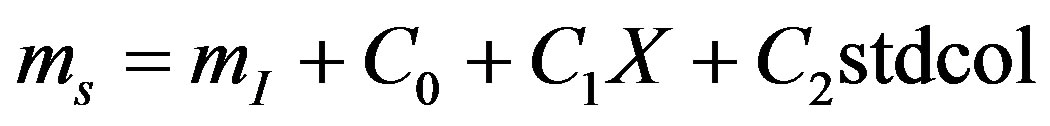
mS: standard catalog magnitude of the objectmI: instrumental magnitude of the objectC0: photometric zero pointC1: extinction coefficientX: effective air massC2: color termstdcol: color indexOur resulting equations are:
1 m JKT Telescope (La Palma) 1999 February 16:
A seeing correction between variations from images was applied with a Gaussian function to filters B and V in respect to filter R. The method consist in comparing both flux and full width at half maximum (FWHM) of neighbouring stars between filters, thus, scarifying a good resolution images for a more broadened image similar to the mean FWHM found in the more broadened image (the R filter in this case).
Surface photometry was performed on the galaxies using the final images in counts with the stars removed. Radial color profiles were generated by subtraction of the individual calibrated surface brightness profiles. Corrections for Galactic extinction correspond to AB ~ 0.02 - 0.06 following Schlegel et al. [1] and Iglesias-Paramo et al. [6] in their r’-band luminosity function for Abell 1367. The redshift K corrections were calculated according with the tables of Poggianti [22] . All magnitudes and tables in the paper are corrected according to these values.
3.6. Residual and Unsharp-Masked Images
Ellipse fitting was carried out using the program ellipse in the IRAF isophote package and starts from the isophote corresponding to 25.6 mag/arcsec2 in B (2% of sky level). The best fit isophotal models generated can be subtracted from the final reduced image (in counts) to produce residual images. These images show no asymmetric structures besides an optical NO of IC3481. Another method for uncovering hidden structures is the unsharp masking method. We use the IRAF gauss task to smooth the image with a gaussian function (we use a Gaussian with different values of sigma value of s = 3, 5, 10, 20, 40, 50 (pixels) and then subtract this smoothed image from the original generating the “unsharp masked” image. This process was also carried out with the images for images of both telescopes.
3.7. Spectral Reduction
The spectra obtained in OAGH was reduced by applying a standard reduction in IRAF with the twodspec and the onedspec package, we used the program splot in IRAF.
For the calculation of Lick indices we used our own routinein the IDL software, the indices were calculated in terms of magnitudes or angstroms as indicated by Worthey [23] for either molecular bands or atomic features respectively.
In order to have the same resolution in the SDSS data we smoothed our data convolving each spectrum with a wavelength-dependent Gaussian kernel with widths given by the formula in Rampazzo et al. [24] :
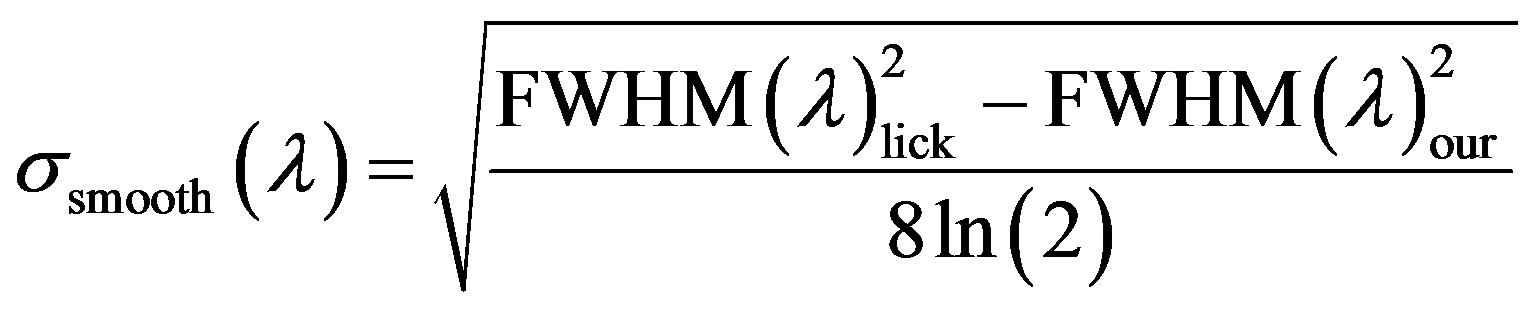 (2)
(2)
as for the lick stars, in order to transform our line strength indices into the LIck system we followed the description on [23] , once the spectra has been degraded, we compared our measures with the Lick-IDS indices reported by Worthey [23] in a linear regression.The main form of this linear regression is:
 (3)
(3)
3.8. Spitzer Data Reduction
We have produced a color image showed in Figure 2, were red colors correspond to 5.8 µm emission, green colors to 4.5 µm emission and blue colors to 3.5 μm emission. We also have produced contour maps of the group, were the lowest mapping contour corresponds to 5σ background noise levels. The intrinsic flux En corresponding to contour n is given trough En = 10A(n−1) + B MJysr−1 were A and Bare constants which vary with the band and source of consideration (see [21] ). The mid-infrared colors of the group will be dependent on the temperature of the dust, the strength of the stellar blackbody emission and polycyclic aromatic hydrocarbon emission (PAH emission) that can contribute to three of the four IRAC bands. These three dominant components of the mid-infrared emission can be disentangled (to some extent) by 3.6/4.5 µm, 5.8/4.5 µm and 8/4.5 µm flux ratio mapping of the sources, a procedure similar tothe one applied in [21] and applied again in this paper. The strongest PAH contribution is expected to happen in the 8/4.5 µm flux ratio, hence, for example galaxies with emission dominated by stellar light and little dust or PAH should present low values of 8/4.5 µm flux ratio.
4. Results
4.1. Optical Images
The resultant images are shown in Figures 3 to 4. Figure 3(a) shows our rgb combined color image from the R, V, B filters. Figure 2(a) shows the (B − V) color map, the nuclei of members A, B, C, D are in general slightly bluer regions than the rest of the galaxy (approximate 0.26 redder in B − V color). As for member E, even when this galaxy correspond to a late Hubble type and hence, bluer than the rest, a similar optical color gradient is seen from the nucleus towards its disc.
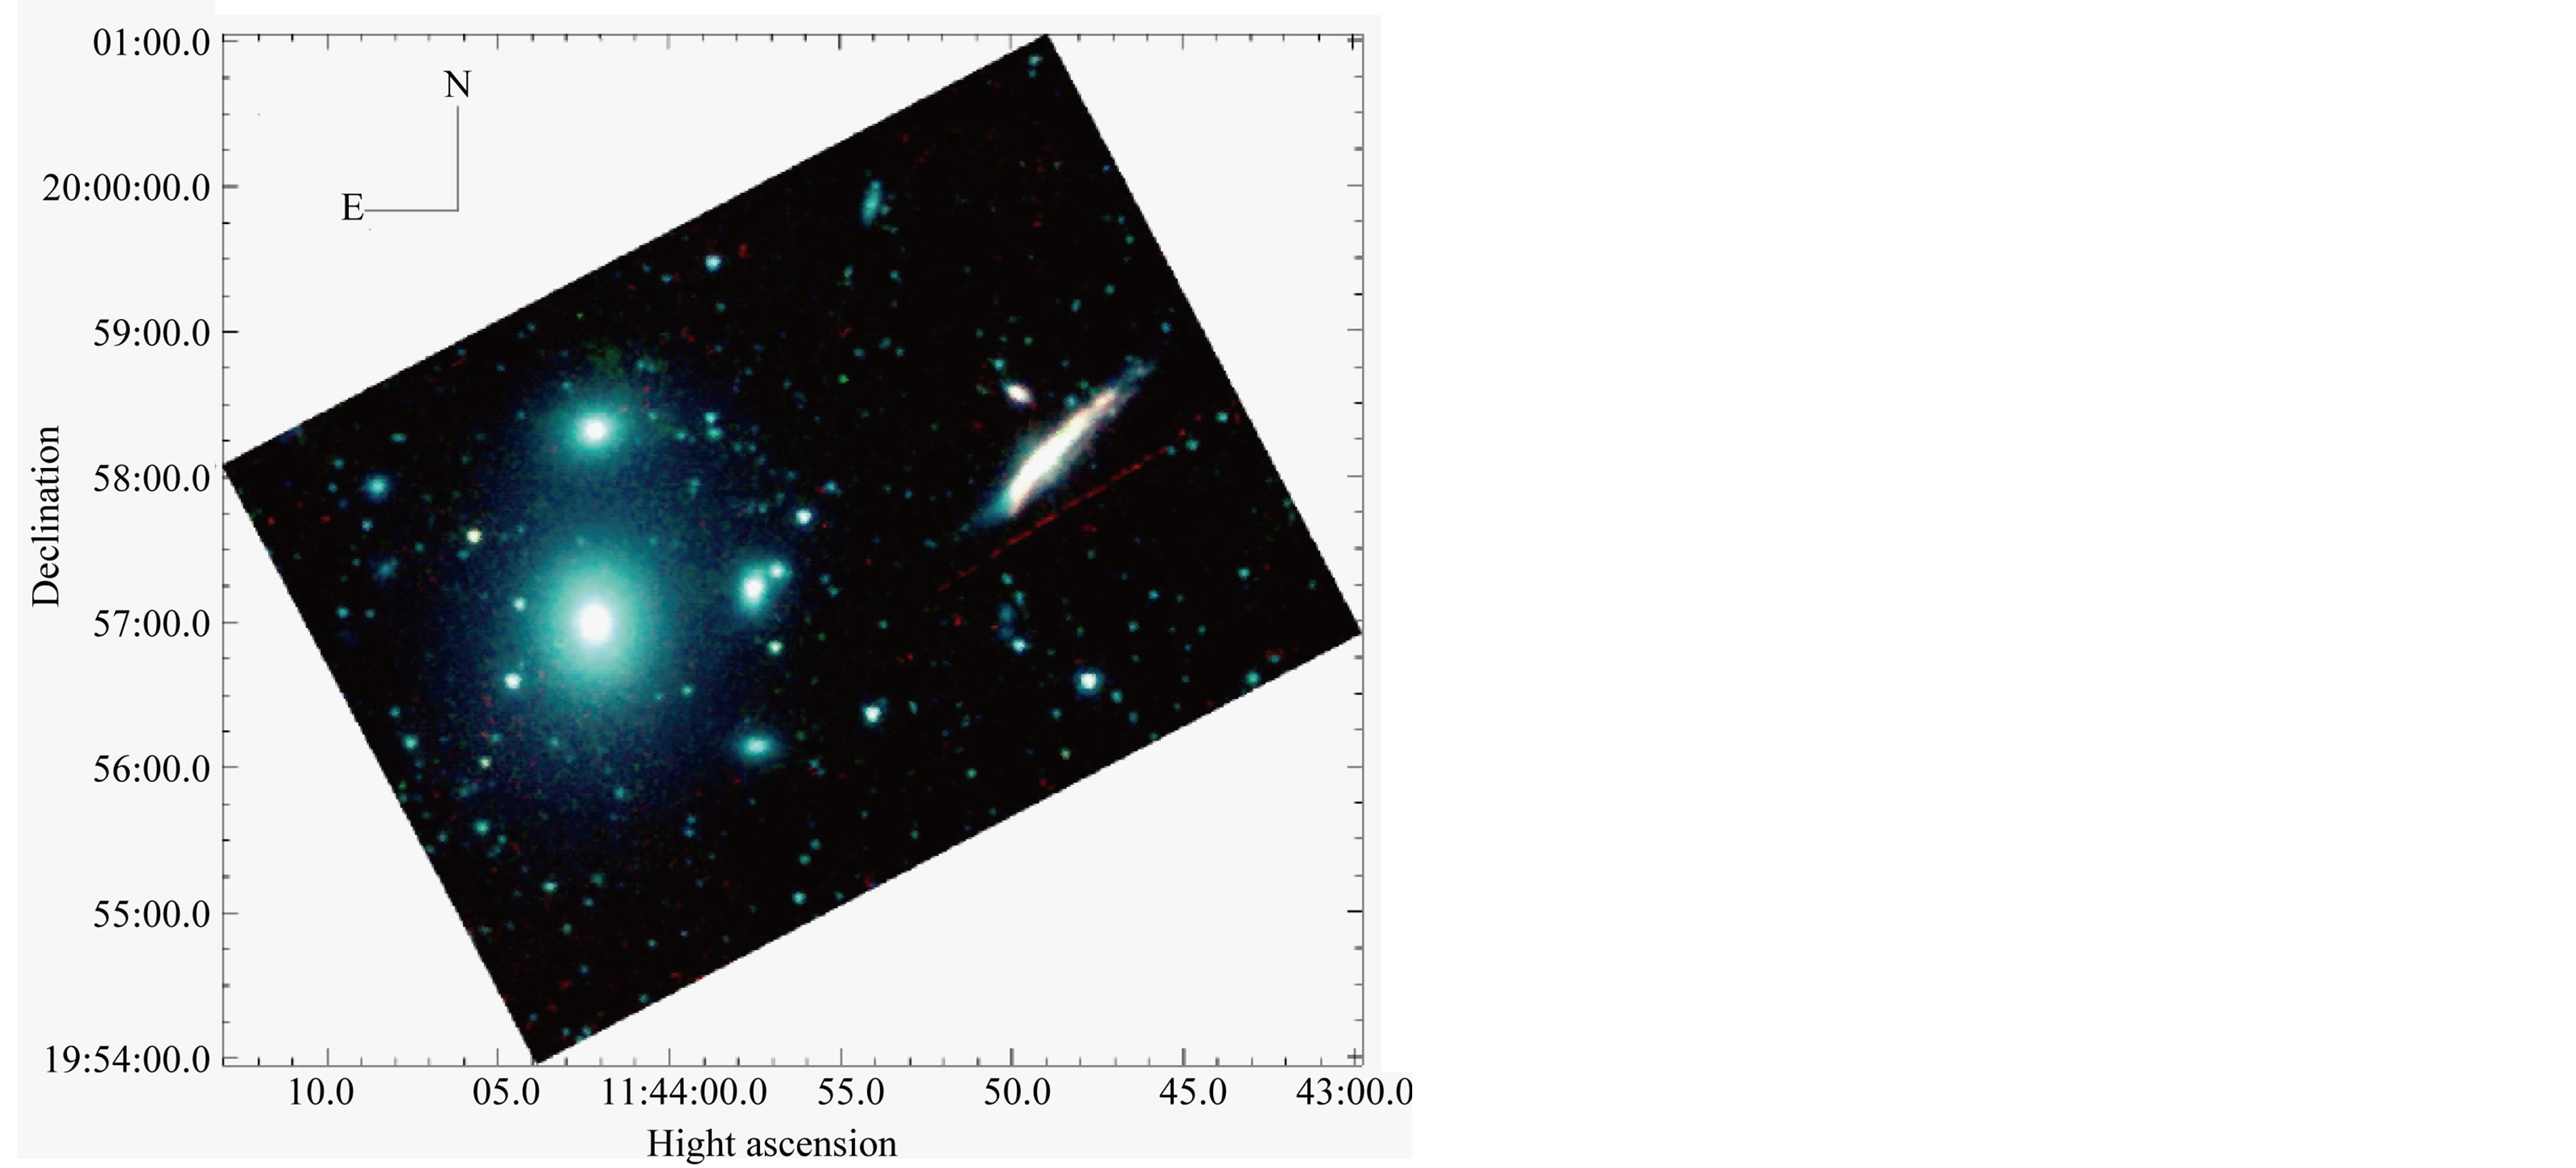
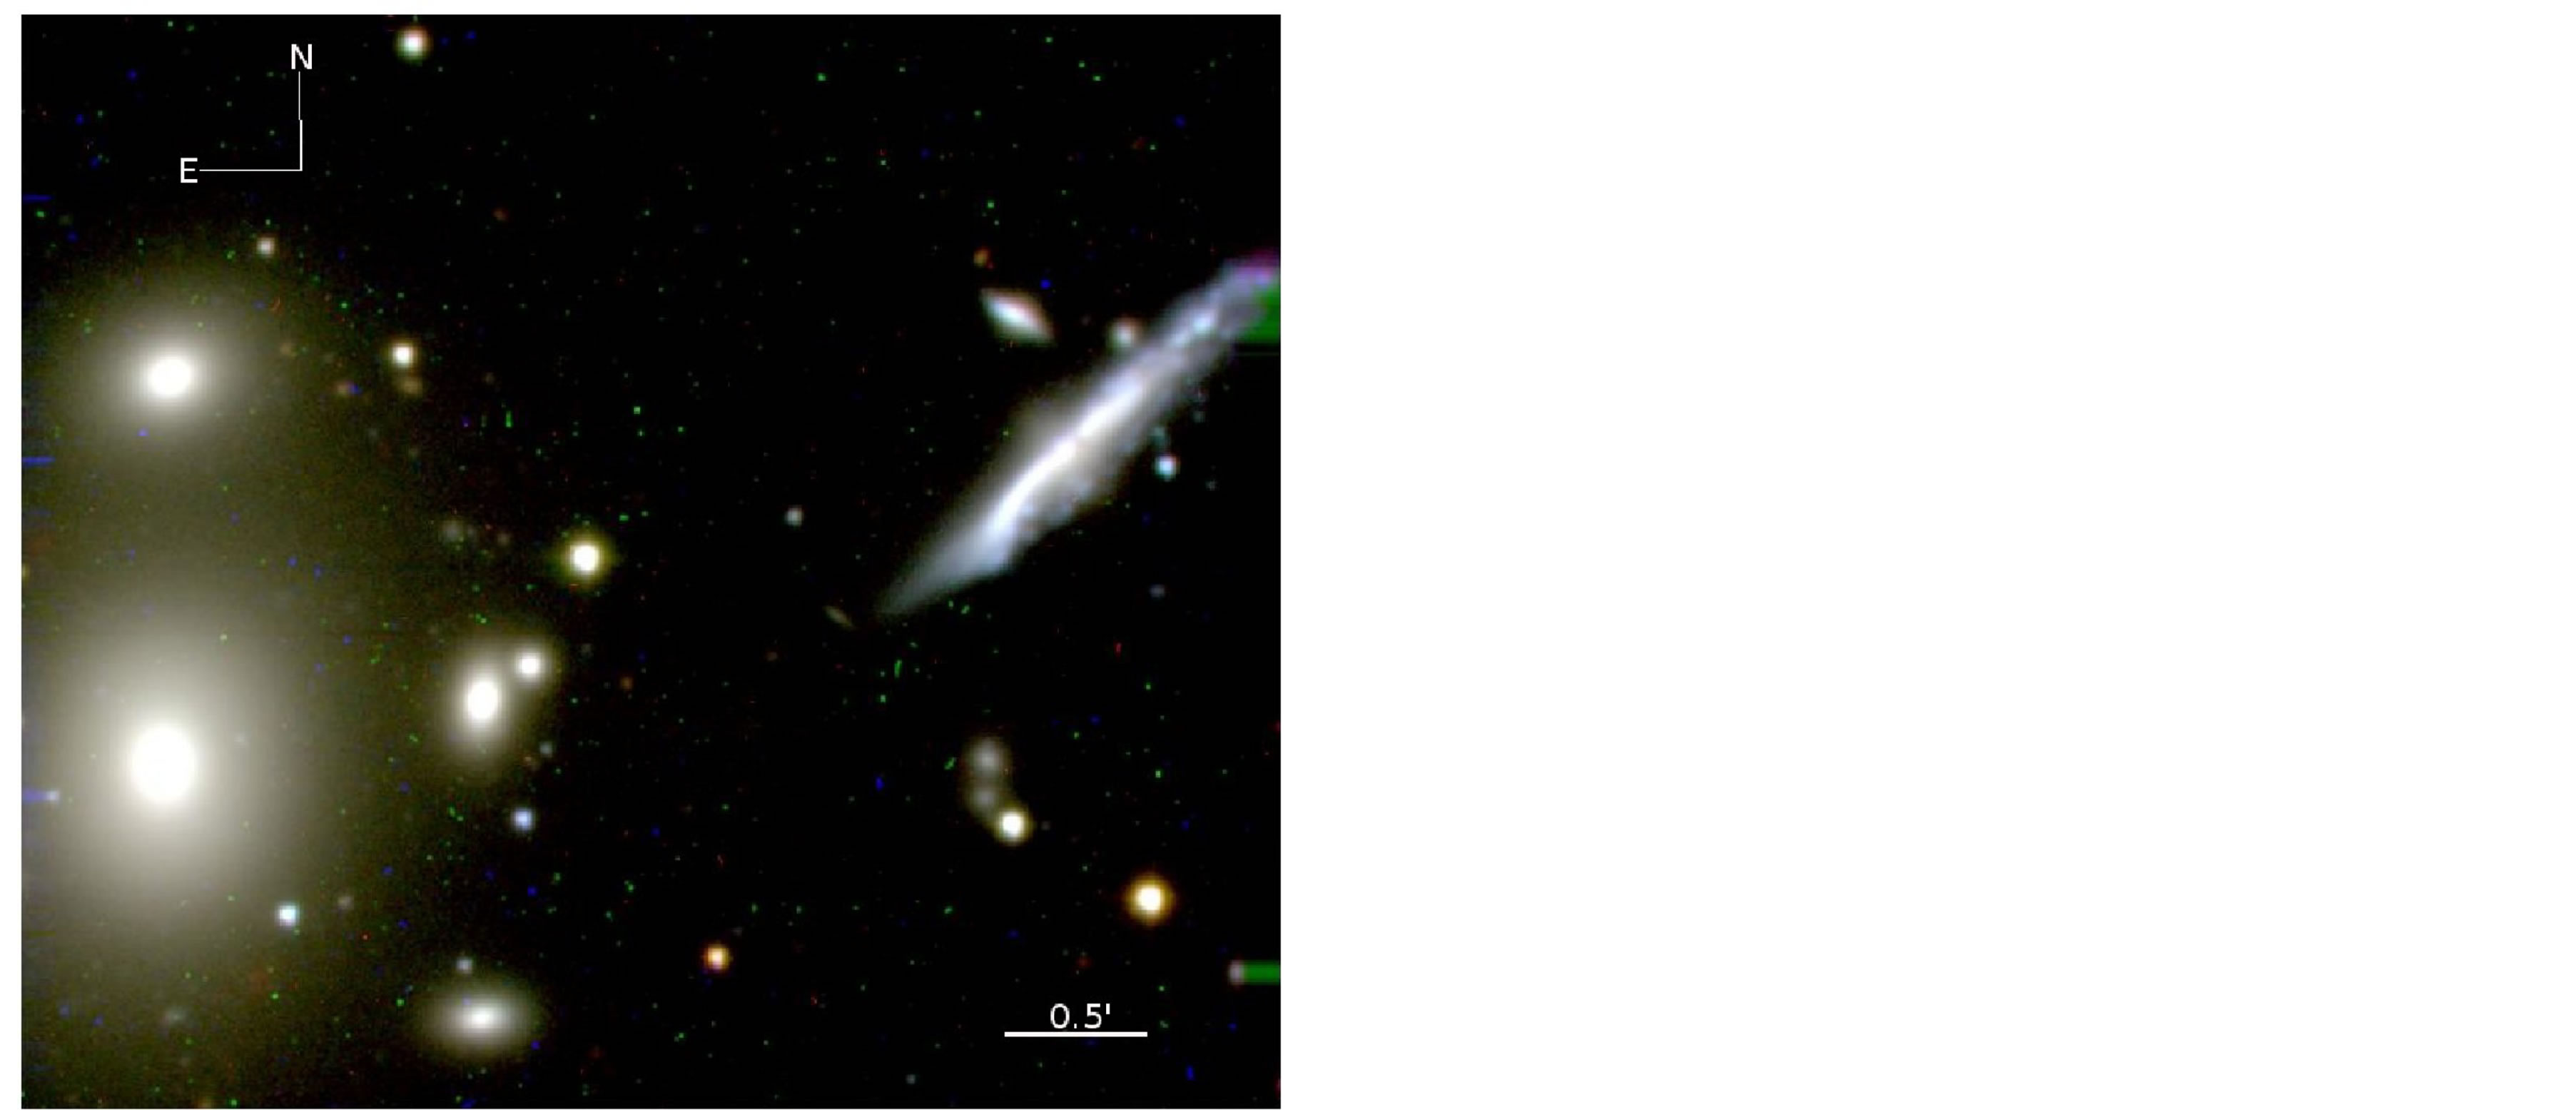
Figure 3. Left: optical rgb color image from 1.5 m Telescope. Right rgb color image from the Spitzer images using the 3.5, 4.5 and 5.8 μm bands.
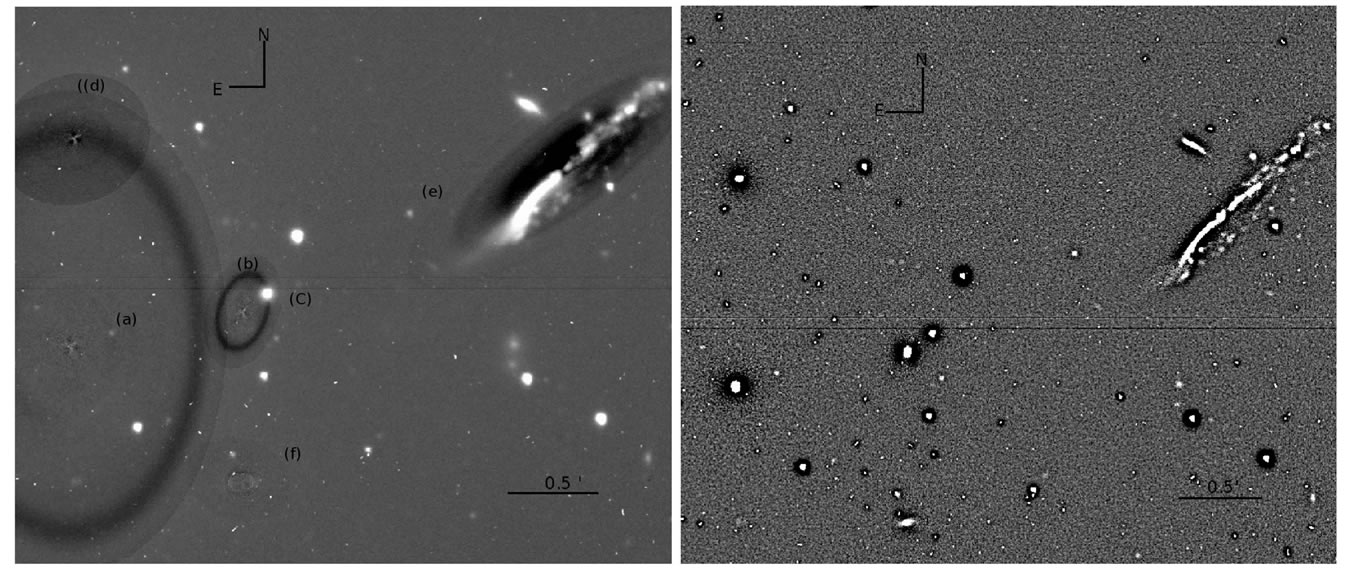
Figure 4. Left: residual image of RSCG 44 in B filter. Right: the unsharp masked image of rscg 44 in B filter from the 1.5 m telescope.
RSCG44 A and D shows red regions towards the north of the image, these regions, at first impression it seems to be an artifact of either small misalignments of the images or a seeing variation between these. In order to prove the later hypothesis, we performed a seeing correction for both filters and compared the alignment processes with the star in the field, the methods seem to be accurate and do not reveals a reduction artifact responsible for such gradient effect in the color map, hence, we believe this zones to be real in our images.
Along with color maps Figures 4(a), (b) shows the unsharp masked images and the residual images for RSCG 44. As mentioned before, we used different values to broaden the image (but only show the image with σ = 3, where s relates here to the Gauss function term,) and then subtract it from the original, and in exception for the bars present in members E and F there is not a trace for internal structure within the rest of the group.
4.2. Optical Profiles and Spectra of the Individual Members
The main surface brightness of each galaxy members and its optical colors are plotted against the r1/4 radius in Figures 5-7. These plots also exhibit the a4/a component of the Fourier Series which indicates the boxines or disckyness factor of the mean isophotes of each member, the position angle (PA) of the mean isophotes and ellipticity (ELLIP) for a better morphological analysis (Section 4) are also shown along as well.
In Table 1 the corresponding global optical and Mid-IR colors, as the observed apparent and absolute magnitudes for the galaxy members are shown, the corresponding ABand K magnitude corrections for these are displayed in Table 2. Tables 3 and 4, show the calculated radial distance, luminosity and main physical parameters for the members of the group.
Globally, the optical color profiles of galaxy members in (B − V), (V − R) seem to have a red gradient from thenucleus to the outskirts of each galaxy. The color gradient remains somewhat steady further out (reaching (B − V) ~ 1.45 at 20”). These colors correspond mainly to K and M type of stars.
Galaxies C, E have a4/a > 0 for about 20” indicating that these isophotes are dominated by a small disk component (the mean values of a4/a in disk galaxies are reported as a4/a > 2, see Pérez-Grana et al. [21] , Grutzbauch et al. [7] , Jerjen et al. [25] ) this indicative is also found in our unsharp masked images and residual images.
Regarding the obtained spectra, the absorption lines present within this group seems to coincide with typical E/SO spectra excepting for galaxy RSCG44 E which exhibits line emission. The emissión lines at RSCG 44E can be used to trace any nuclear activity in it, following Martinez et al. [26] , we have analyzed the O[III]/Hbvs. O[I]/Ha ratiosto find out that this is in fact the case of and AGN occurrence.
Mid-IR Profiles
The Mid-IR profiles are shown in Figure 7 these profiles show a similar trend as that observed in the optical color profiles. In general, MIR color indicates that these are not dominated only by the amount of dust within each member of the group, but also due to dust temperature and PAH contributions to the measured color. We applied MIR color ratios in order to differentiate between dust temperature and PAH contribution. Our obtained color values are shown in Figure 7. Comparing the resulting profiles it is possible to notice how at the (3.5/4.5) µm profile for example, is quite comparable to that obtained in previous literature matching early K stars [12] .
5. Discussion
5.1. The Star Formation in RSCG 44
5.1.1. Optical Colors and Stellar Populations of RSCG 44
Regarding optical profiles it is possible to notice how V band profiles in Figures 5, 6, are very similar to those on Figures 6, slope changes in the profiles are occur nearly at the same radii, meaning how, this is an indicator of how the radial surface density of stars are the same in different stellar populations within the galaxies.
In the comparison of optical color (B − V) images to near infrared color images in (5.8/4.5 µm) also indicates a similar trend were bluer regions are the reddest regions for a NIR color image. The occurrence of how NIR (5.8/4.5 µm) color can be an indicator of star formation was noticed by Riffato et al. [27] were a correlation of PAH emission with star formation rate suggests that the stars that ionize the gas also heat the PAHs.
Although cool stars can heat PAHs too [8] [28] , and most of PAH emission at NIR is detected at 8.0 µm the (4.5/8.0 µm) ratio provides a better estimation to discern the PAH emission from hot dust and then compare with the (B − V) profiles that are dominated by relative young stars. In this manner, having a comparison of the opti-
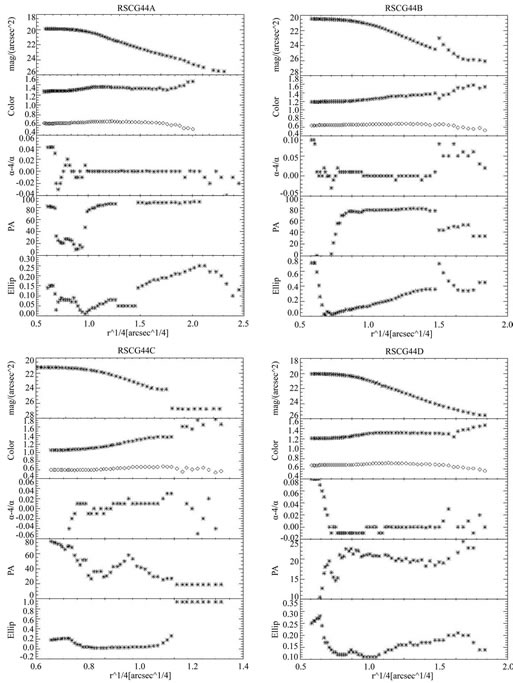
Figure 5. Optical profiles of RSCG 44 A, B, C and D. Each profile from top to bottom is arranged as follows: a) V magnitude profile b) (B − V) and (V − R) color profiles, c) α/α4 Fourier term profile, d) position angle profile, e) ellipticity profile. 1” = 440 pc. H = 75 kms−1Mpc−1.
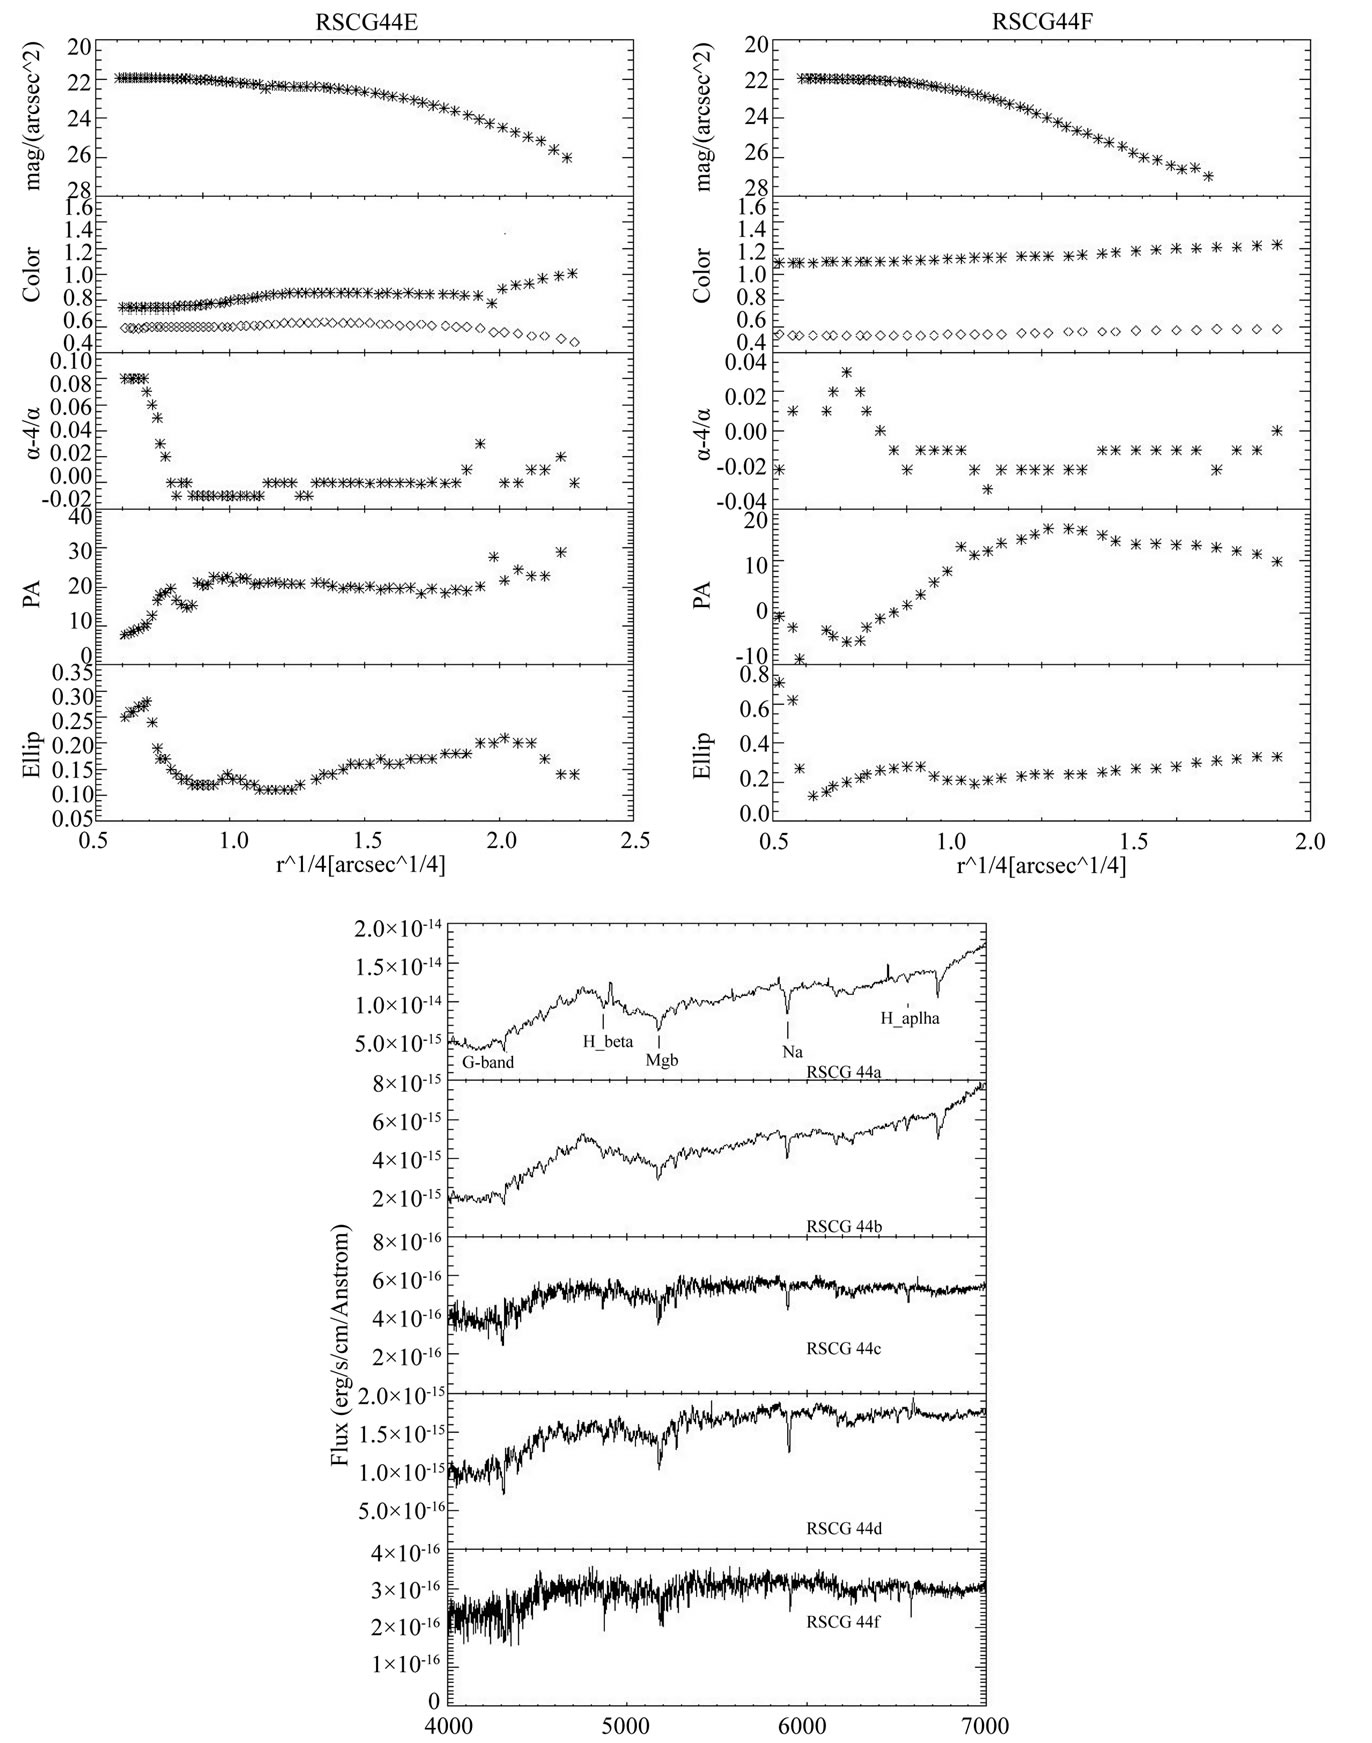
Figure 6. Optical profiles of RSCG 44 E, F and optical spectra for members A, B. C, D, F. The photometric profiles are arranged as presented in the previous figure.
cal profiles at (B − V) and the NIR-profiles it is possible to infer that PAH emission can be triggered by heating of young massive stars.
Even when it has been found that star formation is statistically enhanced in close pairs [29] and recent observations by Marcum et al. [30] suggests that at least four of their eight E/SO samples of isolated galaxies are indeed
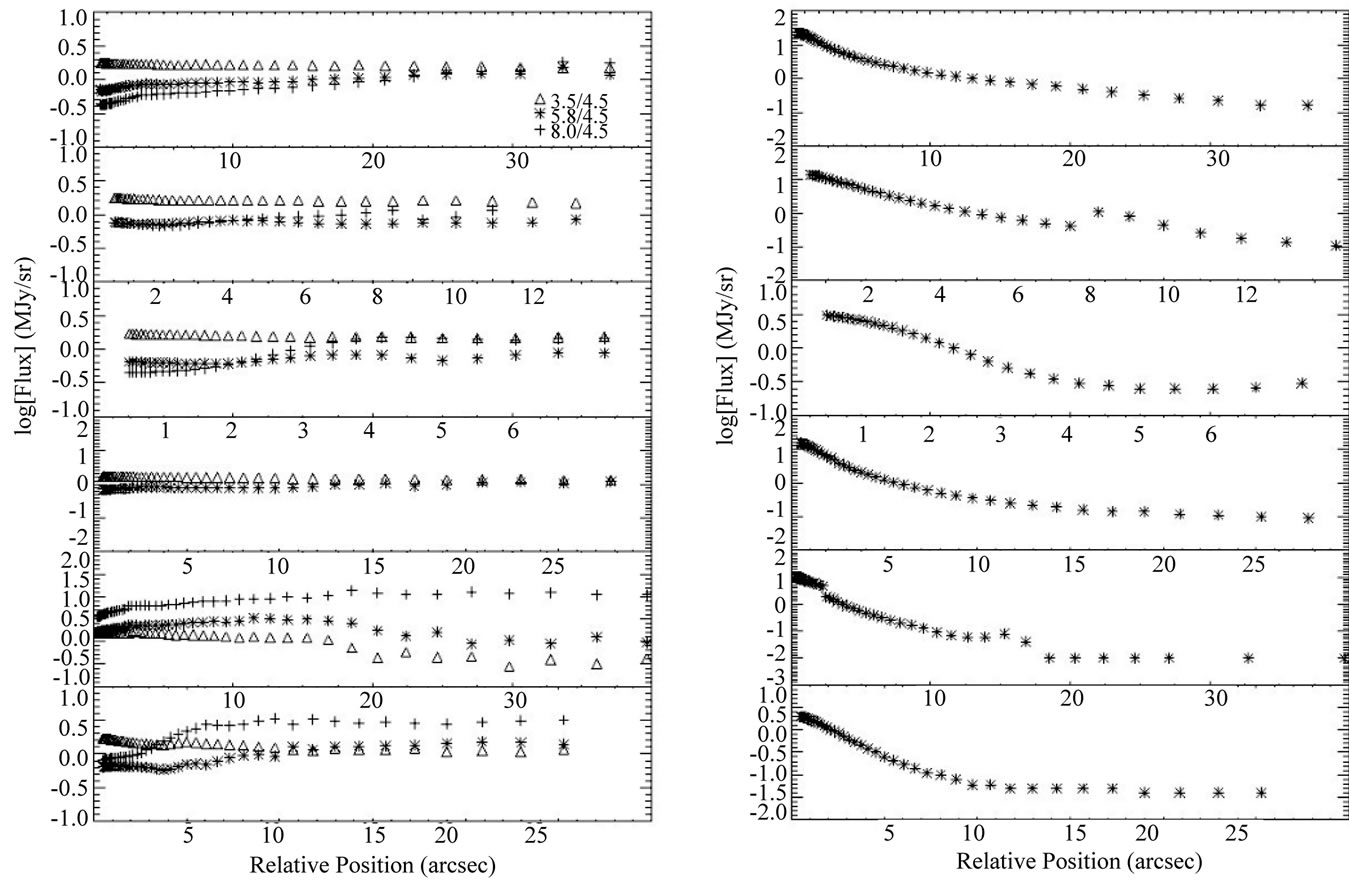
Figure 7. Left: Mid-IR color profiles of RSCG 44. Right: (3.5 m profiles of RSCG 44 (A, B, C, D, F, from above to below).

Table 1. Optical colors for the group RSCG 44. Values in the second and third columns correspond to our measurements corrected according to the data provided in the next table.
Table 2. Magnitude correction table. The AB for the total magnitudes and the reddening for the color from the extinctions of Schlegel et al. [1] are shown in the first line. The second line contains the K-correction from Poggianti.
Table 3. Physical parameters of the galaxies within RSCG 44.
Table 4. Velocity dispersion, viral radius, viral mass and cross section time of the galaxy group RSCG 44.
fossil groups (having a (B − R) ≤ 1). We applied a comparison of colors with the models of Bressan et al. [31] in early-type galaxies for age and metallicities of the predominant stellar populations. This models strongly indicate the case of old stellar populations with low metallicity. This fact in which the colors for IC 3481 correspond to ages of ~10 - 11 Gyr (Z = 0.02 and Z = 0.004), is in accordance with old ages and low metallicities found by de la Rosa et al. [32] and Mendes de Oliveira et al. [33] for E galaxies in Hickson compact groups. The redder colors found in this pair coincides also with results found by Perez Grana et al. [21] and Gruztbauch et al. [7] in both cases the authors present a photometric and morphologic study of galaxy groups and does not only have a sample with predominant early type galaxies but late types as well.
Thus, the mixture of young and old stars is the same throughout the galaxy disks. Both BCDs with these colors show a gradient, at least in the galaxy center, getting redder with distance from the center of the galaxy. This is consistent with the central concentration of intense star formation in these systems. For 123:6À 124:5Ã, the color is constant with radius in85% (11 of 13) of the Im galaxies and all three of the BCDs.
5.1.2. The Spectra
In general, the overall ranges of the a and bcoefficients in our linear regression (Section 2) applied to calibrate from our observed indices to those of Lick go from 0.959 < a < 1.083 and 0.107 < b < 0.184 which establish a reliable calibration with no significant deviation from a one-to-one relation, except for some indices such as Fe 4531, TiO1, TiO2, Mgb, whose corresponding deviation where greater than the above and where not included in our results.
As described before, once the calibration process produced a reliable one-to-one relation a series of Lick indices were obtained for the analysis of the group early tipe galaxies, such results are presented in Table 5. Having a set of Lick indices, we selected the Hb, Mgb, and Fe5270 and Fe5335 as the leading indices to be used in a comparison study with previous literature that use single stellar population (SSP’s) models to disentangle age and metallicity effects. Here, our first two selected indices, respond to changes in age and have a small variation in changes of a/Fe, while indices Fe5270 and Fe5335 respond well to changes in metallicity while maintaining also a small variation in a/Fe.
The previous data were used to measure the [MgbFe]’ (described in [34] ) versus the Hbindices (Table 6) and compare it with current SSP model in order to disentangle age and metallicity factors. In this manner, we compared our results to model used by Sharina et al. [35] in which a setting for α/Fe = 0.0 is employed. Finally, it was estimated how in the later mentioned model, the early types member of RSCG 44 indicate to be located within a range of 10 - 17 Gyr in age and 0.0 ≤ Z ≤ 0.35 in metallicity.
As for the spectrum which exhibits emission lines wehave employed the Gavazzi et al. [34] method tocalculate the star formation rate where the corresponding flux of Hαλ6563 are transformed into ranges of SFR. We measured a LHα = 10.6 × 1040 [ergs−1] which turned into a SFR of 0.09 M⊙yr−1. It is also possible to classify this galaxy by means of its optical spectrum and locate it whether as AGN or SF galaxy. In order to do this we applied the Martinez et al. [26] method measuring emission lines such as [OIII]l5007, [OI]l6300 and [NII]l6584, and [SII] in order to establish a discriminating ratio of [OIII]/[Hb], [OI]/[Ha], [NII]/[Ha] and [SII]/[Ha]. Corresponding values are shown in Table 7. Having estimated the main ratios, the resulting information suggests to classify RSCG 44E as an SF galaxy.
Using the resulting spectra of the group, it is also possible to perform a similar qualitative analysis of that done by Walker et al. [19] where a correlation of color space both optical and MIR is applied to show how redder galaxies contain the largest PAH contribution while bluer galaxies contain little PAH features.
5.1.3. Mid-IR Profiles
As is known the interstellar dust plays an important role in galaxies where dust grains absorb the stellar light and re-emit the absorbed energy at infrared wavelengths. It was estimated that the energy emitted by a galaxy resembling physical characteristics of the Milky Way can range to an amount of approximate 30% of its total emission, while in ultra-luminous infrared galaxies it can range up to 90%.
Table 5. Obtained Lick index from the observed spectra.
Table 6. [MgbFe]’ and Hb estimated values for the obtained indices.
Table 6. Calculated values of logarithmic ratios for the main emission lines in RSCG 44E.
Dust grains that range from 10 Å < a < 200 Å and (even smaller particles, Boselli et al. [35] ) seem to be responsible for the Aromatic Infrared Bands (AIBs). In this manner IRAC’s channel 1 (3.6 µm) centered at 3.6 µm probes the stellar population; channel 2 (4.5 µm) centered at 4.5 µm contains emission from hot dust as well as stars; and channel 3 (5.8 µm) at 5.8 µm and channel 4 (8.0 µm) at 7.8 µm are dominated by thermal emission from PAHs in the interstellar medium (ISM), along with emission from hot dust. The 8.0 µm image in particular contains the 7.7 and 8.6 μm emission bands [19] . Generally, PAH emission is low in dwarf galaxies, and this may be related to the low metallicity and intense stellar radiation field in these systems relative to those of spiral galaxies [35] [40] .
It has been proved how the occurrence of [3.6 µm] images offers can correlate to the stellar populations of a galaxy compared to optical images and profile analysis [16] .
Since the MIR is mostly dominated by old stars and low-mass stars of all ages there is a better approach to discern star population by using NIR colors. The color 3.5/4.5 Ã, on galaxies (especially IR galaxies, [7] ) has been observed to be rather constant and un-fluctuating among at an average of different observations at MIR between galaxies [41] . In this manner, the overall analysis of MIR colors show that the compact group ISM is not simply dominated due to varying amounts of dust between galaxies but also due to dust temperature and PAH emission.
5.2. Morphological Classification and Residual Structures
NIR Morphology and Structure
In some spiral galaxies, stellar structures, such as bars, become more recognizable in the IR, perhaps because they are formed from old stars or dust obscures their features in the optical.
In our compact galaxy group, however, the large-scale morphology that we see in the [3.6] or [4.5] μm stellar images is the same as that we see in the optical. It has been noted how to some extent, morphology and MIR color are expected to correlate; here early-type galaxies expected to have bluer MIR colors [41] .
We found no hidden bars for this compact galaxy group, and those bars that are present look the same in the IR as in the optical (DDO 154, NGC 3738, NGC 4214, NGC 4449, and NGC 6822).
The stellar populations that are emphasized may be different in distinct pass-bands, but the structure of the galaxy is the same for different stellar populations in IR galaxies. One exception is IC 10, which lies at low Galactic latitude; a Galactic dust lane obscures the western part of the galaxy in the optical, and the stars both in IC 10 and in the Milky Way behind the dust lane become apparent in the 3.6 µm image (see Figure 3). Another exception is NGC 3738, a galaxy with intense central star formation that looks similar in V and [3.6] but is less round in J at outer isophotes [7] .
6. Summary and Conclusions
The optical to MIR properties of the compact group RSCG 44 prove to be another example of how this type of galaxy association is different from clusters or regular groups of galaxies, the environment at which RSCG 44 evolves not only occupies a different range of color space but also has specific MIR properties that differentiate amounts of dust in the environment from dust properties such as dust temperature and PAH occurrence.
Another evidence of why the RSCG 44 can be cataloged as a compact group, is the fact that it also exhibits how its members present a bluer core, hence, hosting moderate star formation, the later is a common characteristic in compact groups that separates them from clusters (having legible star formation) [41] .
This might be the case of a compact group infalling into the Abell cluster in a similar manner as a galaxy group described by Cortese et al. [11] , in which a case of an infalling group is proposed as an evolved compact group whose sequence begun with at least three galaxies in which a massive early type galaxy plus a late type and a small gas-rich galaxy started infalling at the outskirts of the cluster, and then galaxy interaction was triggered by gravitational effects creating, tidal tails and bridges as well as galaxy formation.
Acknowledgements
We thank PROMEP for providing financial help for the project “Research into the nature of faint light inclusters of galaxies” under its program “Help in the incorporation of new, full-time lecturers”, which aids researchers in state universities in Mexico. We thank the staff of the UKST for obtaining the Schmidt films between 1991 and 1994, the APM group for scanning the films, and Mike Irwin for helpful advice. The co-addition of the APM scans of the Schmidt films was carried out at the Manchester STARLINK node with the help of Dave Berry. We also thank all the staff in Observatorio Astronómico Nacional de San Pedro Martir (OAN, SPM) for all their technical support. Pérez Grana acknowledges support from CONACyT (México SNI grant).
References
- Schlegel, D., Petre, R. and Loewenstein, M. (1998) ROSAT observations of X-ray-faint S0 galaxies—NGC 1380. Astronomical Journal, 115, 525-534.
- Tanvuia, L. and Pompei, E. (2004) Star Formation Activity and Nuclear Activity in Compact Groups of Galaxies. ENS, 325, 53.
- Mihos, J.C. (1999) Gasdynamics and Starbursts in Interacting Galaxies. IAUS, 186, 205.
- Moles, M., del Olmo, A., Perea, J., Masegosa, J., Marquez, I. and Costa, V. (1994) Star Formation and Merging in Compact Groups of Galaxies. Astronomy & Astrophysics, 285, 404.
- Schweizer, F. (1996) Colliding and Merging Galaxies. III. The Dynamically Young Merger Remnant NGC 3921. Astronomical Journal, 111, 195.
- Iglesias-Paramo, J., Boselli, A., Gavazzi, G., Cortese, L. and Vilches, J. (2003) The R-Band Luminosity of Abell 1367: A Comparision with Coma. Astronomy & Astrophysics, 406, 25.
- Grutzbauch, R., Annibali, F., Bressan, A., Focardi, P., Kelm, B., Rampazzo, R. and Zeilinger, W. (2005) Optical Properties of the NGC 5328 Group of Galaxies. Astronomical Journal, 129, 1832.
- Verdes-Montenegro, L., Del Olmo, A., Yuin, M. and Perea, J. (2003) The evolution of HCG 31. Optical and High Resolution HI Study. Astronomy & Astrophysics, 430, 443.
- Severgnini, P. and Saracco, P. (2001) H Luminosity and Star Formation of Galaxies in Hickson Compact Groups. Astrophysics and Space Science, 276, 749.
- O’Halloran, B., Metcalfe, L., McBreen, B., Laureijs, R., Leech, K., Delaney, M., Watson, D. and Hanlon, L. (2002) Infrared Space Observatory Observations of Hickson Compact Group 31 with the Central Wolf-Rayet Galaxy NGC 1741. The Astrophysical Journal, 575, 747. http://dx.doi.org/10.1086/341333
- Cortese, L., Gavazzi, G., Boselli, A., Franzetti, P., Kennicutt, R.C., O’Neil, K. and Sakai, S. (2006) Witnessing Galaxy Preprocessing in the Local Universe: The Case of a Star-Bursting Group Falling into Abell 1367. Astronomy & Astrophysics, 456, 857.
- Uchida, K.I., Sellgreen, K. and Wellner, M. (1998) Do the Infrared Emission Features Need Ultraviolet Excitation? The Astrophysical Journal, 493, 109. http://dx.doi.org/10.1086/311136
- Giovanelli, R.G. and Haynes, J. (1985) Gas Deficiency in Cluster Galaxies—A Comparison of Nine Clusters. The Astrophysical Journal, 292, 404. http://dx.doi.org/10.1086/163170
- Barton, M. (1998) Model Atmospheres Broadband Colors, Bolometric Correction and Temperature calibrations for O-M stars. Astronomy & Astrophysics, 333, 231.
- Godwin, J.V. and Peach, J.V. (1982) Photometry of the Cluster of Galaxies A 1367. Monthly Notices of the Royal Astronomical Society, 200, 733.
- Ramella, M., Pissani, A. and Geller, M. (1997) Groups of Galaxies in the Northern CfA Redshift Survey. The Astronomical Journal, 113, 483.
- Geller, M.J. and Hucra, J.P. (1989) The Center for Astrophysics Redshift Survey—Recent Results. Science, 246, 897-903. http://dx.doi.org/10.1126/science.246.4932.897
- Ramella, M., Geller, M., Pissani, A. and De la Costa, R. (2002) The UZC-SSRS2 Group Catalog. The Astronomical Journal, 123, 2976-2984.
- Walker, L.M., Fabian, A.C., Sanders, J.S. and George, M.R. (2012) Galaxy Cluster Outskirts: A Universal Entropy Profile for Relaxed Clusters? The Astrophysical Journal, 143, 69.
- Adelman-McCarthy, J., Agüeros, M.A., Allam, S., et al. (2008) The Sixth Data Release of the Sloan Digital Sky Survey. The Astrophysical Journal Supplement Series, 175, 297-313.
- Pérez Grana, J.A., Kemp, S.N., Katsiyannis, A.C., Franco-Balderas, A., de La Fuente, E., Meaburn, J. and Khosroshahi, H.G. (2008) BVRI Photometric Analysis for the Galaxy Group NGC 4410. Astronomy & Astrophysics, 485, 435-449.
- Poggianti, B. (1997) K and Evolutionary Correction UV to IR. Astronomy & Astrophysics, 122, 399-407.
- Worthey, G. (1994) Comprehensive Stellar Population Models and the Disentanglement of Age and Metallicity Effects. The Astrophysical Journal Supplement Series, 95, 107-149. http://dx.doi.org/10.1086/192096
- Rampazzo, R., Annibali, F., Bressan, A., Longhetti, M., Padoan, F. and Zeilinger, W.W. (2005) Nearby Early-Type Galaxies with Ionized Gas. I. Line-Strength Indices of the Underlying Stellar Population. Astronomy & Astrophysics, 433, 455-497.
- Jerjen, H., Binggeli, B. and Freeman, K. (2000) Surface BR Photometry of Newly Discovered Dwarf Elliptical Galaxies in the Nearby Sculptor and Centaurus A Group. The Astronomical Journal, 119, 593-608.
- Martinez, M., Del Olmo, A., Perea, J., Coziol, R. and Focardi, P. (2010) The influence of local environment on the emergence of AGN activity in Galaxies. Proceedings of the 9th Scientific Meeting of the Spanish Astronomical Society, 13-17 September 2010, Madrid, 252-258.
- Riffato, A., Long, G. and Capicciolli, M. (1995) The UV porpierties of normal Galaxies III. Standar Luminosity Profiles and Total Magnitudes. Astronomy & Astrophysics, 114, 527-536.
- Lu, N., Helou, G., Werner, M., Dinerstein, H.L., Dale, D., Silbermann, N., Malhotra, S., Beichman, C. and Jarrett, T. (2003) Infrared Emission of Normal Galaxies from 2.5 to 12 Micron: Infrared Space Observatory. Astrophysical Journal, 588, 199-217.
- Sulentic, J.W., Rosado, M., Verdes-Montenegro, L., Trinchieri, G., Xu, C. and Piescht, W. (2001) A Multiwavelength Study of Stephan’s Quintet. The Astronomical Journal, 122, 2993-3016.
- Marcum, P.M., Aars, C.E. and Fanelli, M. (2004) Early-Type Galaxies in Extremely Isolated Environments: Typical Ellipticals? The Astronomical Journal, 127, 3213-3234.
- Bressan, A., Chiosi, C. and Fagotto, F. (1994) Spectrophotometric Evolution of Elliptical Galaxies. 1: Ultraviolet Excess and Color-Magnitude-Redshift Relations. Astrophysical Journal, 94, 63. http://dx.doi.org/10.1086/192073
- de la Rosa, I.G., de Carvalho, R.R., Vazdekis, A. and Barbuy, B. (2007) Truncated Star Formation in Compact Groups of Galaxies: A Stellar Population Study. Astronomical Journal, 133, 330.
- Mendes de Oliveira, C., Coelho, P., González, J. J. and Barbuy, B. (2005) Ages, Metallicities, and Element Enhancement for Galaxies in Hickson Compact Groups. Astronomical Journal, 130, 55-64.
- Boselli Lequeux, J., Sauvage, M., Boulade, O., Boulanger, F., Cesarsky, D., Dupraz, C., Madden, S., Viallefond, F. and Vigroux, L., (2001) 1.65 Micron (H Band) Surface Photometry of Galaxies. VI. The History of Star Formation in Normal Late-Type Galaxies. Astrophysical Journal, 94, 63-115.
- Gavazzi, G., Mellier, Y., Fort, B., Cuillandre, J.-C. and Dantel-Fort, M. (2004) Mass and Light in the Supercluster of Galaxies MS0302+17. Astronomy & Astrophysics, 417, 499.
- Sharina, M.E., Karachentsev, I., Dolphin, A., Karachentseya, V., Tully, R., Karataeva, G., Makarov, D.I., Makarova, L.N., Sakai, S., Shaya, E.J., Nikolaev, E.Y. and Kuznetsov, A.N. (2008) Photometric Properties of the Local Volume of Dwarf Galaxies. Monthly Notices of the Royal Astronomical Society, 384, 1544-1562.
- Hunter, D.A. and Elmegreen, B.G. (2004) The Stellar Structure of Irregular Galaxies. Astrophysical Journal Supplement Series, 162, 49. http://dx.doi.org/10.1086/498096
- Madden, S.C. (2000) Effects of Massive Star Formation on the ISM of Dwarf Galaxies. New Astronomy Reviews, 44, 249-256.
- Sulentic, J. (2002) Compact Galaxy Groups in 3D. Astronomical Society of the Pacific (ASP), 282, 227.
- Luo, Z., Shu, C. and Huang, J. (2007) The Differences of Star Formation History between Merging Galaxies and Field Galaxies in the Early Data Release of the SDSS. Publications of the Astronomical Society of Japan (PASJ), 59, 541.
NOTES

1IRAF is distributed by the National Optical Astronomy Observatory which is operated by AURA, Inc., under contract.
to the NSF