Journal of Diabetes Mellitus
Vol.2 No.1(2012), Article ID:17307,7 pages DOI:10.4236/jdm.2012.21007
Effect of beverages with different protein profiles on postprandial blood glucose response in overweight and obese men
![]()
Department of Food Science and Human Nutrition, University of Illinois at Urbana Champaign, Urbana, USA; *Corresponding Author: edemejia@illinois.edu
Received 27 October 2011; revised 15 December 2011; accepted 30 December 2011
Keywords: Overweight men; Glycemic index; Low glycinin soymilk; Glycemic response; Glycemic load
ABSTRACT
Positive postprandial blood glucose responses have been related to low glycemic index (GI) and low glycemic load (GL) diets. The objective was to determine the effect of protein profile on glycemic response of low glycinin soymilk (high in β-conglycinin) (LGS) and conventional soymilk (S) in overweight and obese men. Twenty-four subjects, 23 - 45 years old, average BMI of 29 (26 - 38) with triglycerides <200 mg/dL consumed 250 mL of LGS, S with identical macronutrient content, with bovine milk (M) as reference. Fasting blood samples were followed by samples at 15, 30, 45, 60, 90, and 120 min after the milk consumption. One-day diet record, anthropometrics, and a demographic interview were completed. LGS and S presented a GI of (average ± standard deviation) 41.0 ± 29.9 and 40.4 ± 37.2, respectively. M showed a GI of 29.2 ± 25.3, however, treatment effect was not significant (P = 0.338). Similarly, GL for LGS (4.52 ± 3.29), S (4.44 ± 4.09) and M (2.33 ± 1.01) were not significantly different (P = 0.107). Postprandial glucose concentration curves for LGS, S and M presented the same tendency throughout 120 min (P = 0.331). Fasting blood glucose correlated with GI (r = −0.553; P = 0.032) and GL (r = −0.567; P = 0.028). LGS, S and M are low GI products and postprandial glycemic responses were not different. The high content of the protein β-conglycinin in LGS did not have an effect in postprandial blood glucose response in overweight and obese men.
1. INTRODUCTION
Obesity and diabetes are two health concerns that often have overlapping incidence and prevalence, with obesity being a major contributor to diabetes risk. In this regard, governmental institutions and the food industry have tried guide consumer decisions by educating them about the content and properties of healthier food products. The glycemic index (GI) is a tool used to classify foods based on the glycemic response, and is defined as the glucose response area under the curve after 25 - 50 g of carbohydrate consumption [1]. The Food and Agriculture Organization (FAO) of the World Health Organization (WHO) defined the GI in 1998 as the incremental area under the blood glucose response curve of a 50 g carbohydrate sample of food expressed as a percent of the response to 50 g of carbohydrate from a standard food in same subject [2]. However, low GI products may be tested with lower than a 50 g carbohydrate load [3]. The American Diabetes Association classifies food as low GI, medium GI and high GI food with GI’s of 55 or less, 56 - 69 and more than 70 respectively [4].
Several studies have claimed successful maintenance of glucose concentrations with the consumption of low GI foods [5]. In contrast to low GI foods, high GI food produces a higher postprandial blood glucose response after 2 h of consumption [6]. This reaction may be due to slower digestion and absorption rates [7]. Isken et al. [8] reported that only long-term (not short-term) consumption of high GI foods results in obesity, insulin resistance and metabolic complications. In contrast, Cocate et al. [3] failed to confirm different glycemic responses between low and high GI foods.
The determination of the GI is still controversial due to the variable responses observed in the same type of products. Measurement methods, food ingredients and food processing conditions must be taken into consideration when comparing GIs. For instance, larger degrees of processing yield higher GI responses [9]. Ripeness and storage time have a marked influence on GI measurements [4]. The methodology used also may influence the differences in those results, for instance, capillary blood samples are more reliable than venous blood samples to determine the GI [10].
Glycemic loads (GL) are also related to lower risk of cardiovascular disease and are calculated by multiplying the GI of a food by the available carbohydrate present in that food divided by 100 [11]. Low GI and GL diets have shown improvements in glycemic control, reduction in serum lipids, cardiovascular risk and diabetes risk [12]. Low GI diets have been also related to increments in satiety [13]. While some authors correlate high GL diets with elevated health risk of overweight individuals [14], others failed to correlate the GI and GL with insulin sensitivity and adiposity [15].
The effects that a low GI diet has on obese individuals are also debated. The consumption of low GI products in order to prevent the development of diabetes or other obesity-related issues may be achieved by replacing 1) energy from carbohydrates with energy from proteins, 2) energy from carbohydrates with energy from fat, or 3) high GI with low GI foods [7]. International tables of the GI of foods have been published and used by the scientific community as instruments to evaluate the relationship between the GI and human health; however the list is not yet comprehensive [6]. The objective of the present study was to determine the effect of the protein profile on the glycemic response of low glycinin soymilk (high in β-conglycinin) and conventional soymilk to increase the knowledge of the benefits of soy bioactive compounds as new healthy food alternatives for those who are overweight or obese.
2. MATERIALS AND METHODS
2.1. Subjects and Study Design
Participants were healthy overweight and obese men, non-vegetarian, non-athletes, and non-smokers, recruited voluntarily from the campus of the University of Illinois, Urbana-Champaign. Twenty-four subjects were recruited with a mean age of 31 (23 - 45) years with a mean body mass index (BMI) of 29 (26 - 38) and with normal serum triglycerides levels (<200 mg/dL). All procedures were conducted according to the principles expressed in the Declaration of Helsinki, under approval of the Institutional Review Board (IRB) of University of Illinois (IRB # 09454) amended on November 10, 2010. After signing consent, subjects were asked to watch a video with the procedures to be performed in the study. Participants were asked to participate in three repetitions of the glycemic curve assessments on three different days (at least one week apart). Subjects were asked to fast for 12 h prior each meeting and each subject consumed a different treatment per repetition [low glycinin soymilk (LGS), conventional soymilk (S) or bovine milk (M)]. Bovine milk was the control for soymilk, and conventional soymilk was the control for the low glycinin milk, thus assessing the effects of soy milk vs. bovine milk and glycinin levels.
They also participated in a BMI evaluation, a demographic interview, and completed a 24-h diet recall in every repetition. The 24-h diet recalls were reviewed with the participants in person by a trained dietitian to ascertain completeness of the records. Visual aides were used to assist in correct portion identification. Energy and nutrient intakes were determined using nutrient analysis software (Food Processor, Esha Research, Inc.). The Estimated Energy Requirement (EER) was obtained for each participant according to the Dietary Reference Intakes guidelines [16]. From the 24 subjects enrolled, 19 subjects finished the entire study and were considered for the analysis. The main reasons for withdrawal were inconveniences on work schedules and weather conditions.
2.2. Glucose Curve Assessment
Subjects received instructions on how to use the glucometer and were asked to wash and dry their hand before each prick. Subjects consumed 250 mL of milk within 10 - 15 min. Capillary finger-stick blood samples (1 µL/sample) were taken in the fasting state (0 min) and at 15, 30, 45, 60, 90, and 120 min after the start of the consumption of milk. Glucose levels were measured using a calibrated One Touch Ultra® glucometer. According to Solnica et al. [17] One Touch glucometers have acceptable performance and standard deviation from laboratory analysis <10%. The positive area under the curve (AUC) in blood glucose was calculated by using the trapezoidal method (GRAPHPAD PRISM, version 4.00; GraphPad Software, San Diego CA). Incremental AUC (iAUC) was considered as the AUC above baseline, the area beneath the fasting concentration was ignored; only the measurements with positive peaks (AUC) were considered. There were two subjects with negative areas under the curve. Only subjects with fasting blood glucose <110 mg/dL were included in the calculations. The glucose curve shapes were classified following the definition of Tschritter et al. [18]. When plasma glucose increases to the maximum after 30 - 90 min and decreases until 120 min it is considered to be a “monophasic” plasma glucose curve. If glucose shapes reach a nadir after an initial increase again > 0.25 mmol/L (4.5 mg/dL) until 120 min it is classified as “biphasic” plasma glucose curve. If three glucose peaks are observed (>0.25 mmol/L minimum increment) it is considered “triphasic”. Glycemic loads were calculated using the formula: GL = [(iAUC* g of carbohydrates)/100].
2.3. Statistical Analysis
Statistical analyses were conducted using SAS version 9.2. (SAS institute, Cary, NC). Data normality was analyzed with Shapiro-Wilks tests. Glycemic index was analyzed with multivariate analysis of variance (MANOVA) considering the effect of subjects, beverages, initial fasting glucose, type of curve, BMI, age, serum triglycerides and energy intake, dietary protein, dietary carbohydrate, and dietary fat. Incremental areas under the curve per treatment throughout the time were analyzed using analysis of variance for repeated measurements. Glycemic loads (GL) were calculated by multiplying the GI of a food by the available carbohydrate present in that food divided by 100 [11]. Glycemic loads among beverages were analyzed by one-way ANOVA tests. A correlation analysis was used to correlate GI, GL and fasting glucose with BMI, age, serum triglycerides, changes in body fat, waist-hip ratio (WHR), plasma adiponectin, plasma Creactive protein and plasma interleukin-6 obtained previously. All statistics are presented as mean ± Standard Error of the Mean (SEM) of the groups of individuals (beverages) or mean ± Standard Deviation (SD). A Pvalue < 0.05 was considered significant. A power analysis was performed in order to detect true differences 80% of the time at alpha = 0.05 and a medium effect size (Sample Power 2.0).
3. RESULTS
Chemical analyses of the beverages revealed no significant differences in total energy, carbohydrate (11 g), protein (14 g) and fat (7 g) (Table 1). The only chemical differences were the concentrations of β-conglycinin (LGS, 49.5%; S, 26.5%; and M, 0% of total protein) and glycinin (LGS, 6.0%; S, 38.7 %; and M, 0% of total protein). The total isoflavone content was similar in the two soymilk products (P > 0.05). As expected, bovine’s milk contained less that 1 ppm of isoflavones (data not shown). The LSG, S and M were processed and stored under the same conditions to eliminate bias due to treatment preparation and manipulation.
The two soymilks and the bovine milk were tested in the same subjects at different times which allowed us to have the same subject characteristics for each group. Participants were on average 30 ± 1.5 years old and had a BMI of 29 ± 1. Low glycinin soymilk and S presented a GI of 41.0 ± 29.9 and 40.4 ± 37.2 (mean ± standard deviation, respectively). The bovine milk used in this study as a reference showed a GI of 29.2 ± 24.3, however, the effect on GI was not significant (P = 0.338) (Table 2). Fasting blood glucose for LGS, S and M were 91.1 ± 5.5
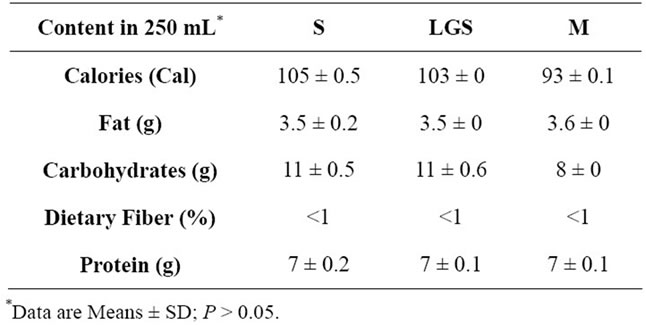
Table 1. Chemical composition of 250 mL of beverages conventional soymilk (S), low glycinin soymilk (LGS) and bovine milk (M).
mg/dL, 94.1 ± 7.7 mg/dL and 91.2 ± 8.2 mg/dL, respectively.
Most subjects presented biphasic curves with all beverages, and this fact did not influence the calculation of the area under the curve (P = 0.072). Energy intake (P = 0.219), dietary carbohydrate (P = 0.350), and dietary fat (P = 0.795) did not influence significantly the glycemic response. Dietary protein showed a slight significant influence in the glycemic response (P = 0.018). Energy intake/EER ratio showed that 9 out of 17 subjects reported having a lower calorie intake than the recommendation, and only 2 reported an energy intake that exceeded the recommendation (Table 3). Glycemic loads for LGS, S and M were 4.52 ± 3.29; 4.44 ± 4.09 and 2.33 ± 1.01 (average ± standard deviation, respectively) with no significant differences found among the beverages (P = 0.107). The postprandial glucose concentration curves for LGS, S and M are shown in Figure 1. Regardless of the lower glucose concentration in M at 60 min, the glucose curves among them did not present significant differences throughout the 120 min of analysis (P = 0.331).
No correlations were observed between GI or GL with BMI, age, serum triglycerides or previous changes in body fat, waist-hip ratio (WHR), plasma adiponectin, plasma C-reactive protein or plasma interleukin-6 (P > 0.05). Glycemic loads correlated with GI and fasting glucose (r = 0.975, P < 0.0001, and r = −0.567, P = 0.028, respectively). The GI also was correlated with fasting glucose (r = −0.553; P = 0.032).
4. DISCUSSION
According to the American Diabetes Association, all beverages used in the present study were low GI products [4] (GI of 55 or less). The international tables of GI also agree with this classification of low GI food products [6], and presented similar GI’s values with those observed in this study (44 ± 4 for soymilk and 32 ± 5 for bovine milk). Glucose maintenance [19,20], better glycemic responses [12], and increases in satiety have been associated with consumption of low GI products. In con-
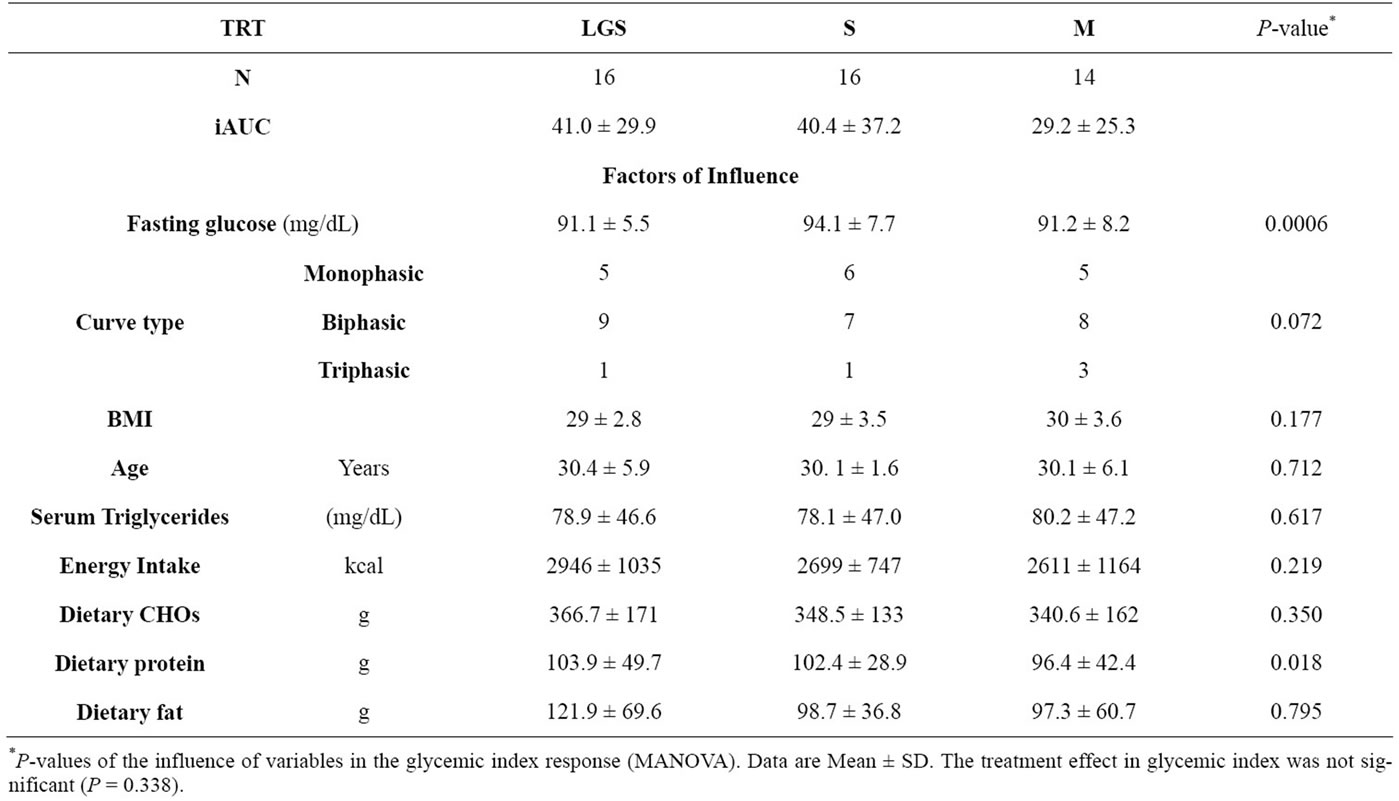
Table 2. Glycemic response analysis of low glycinin soymilk (LGS), conventional soymilk (S) and bovine milk (M).
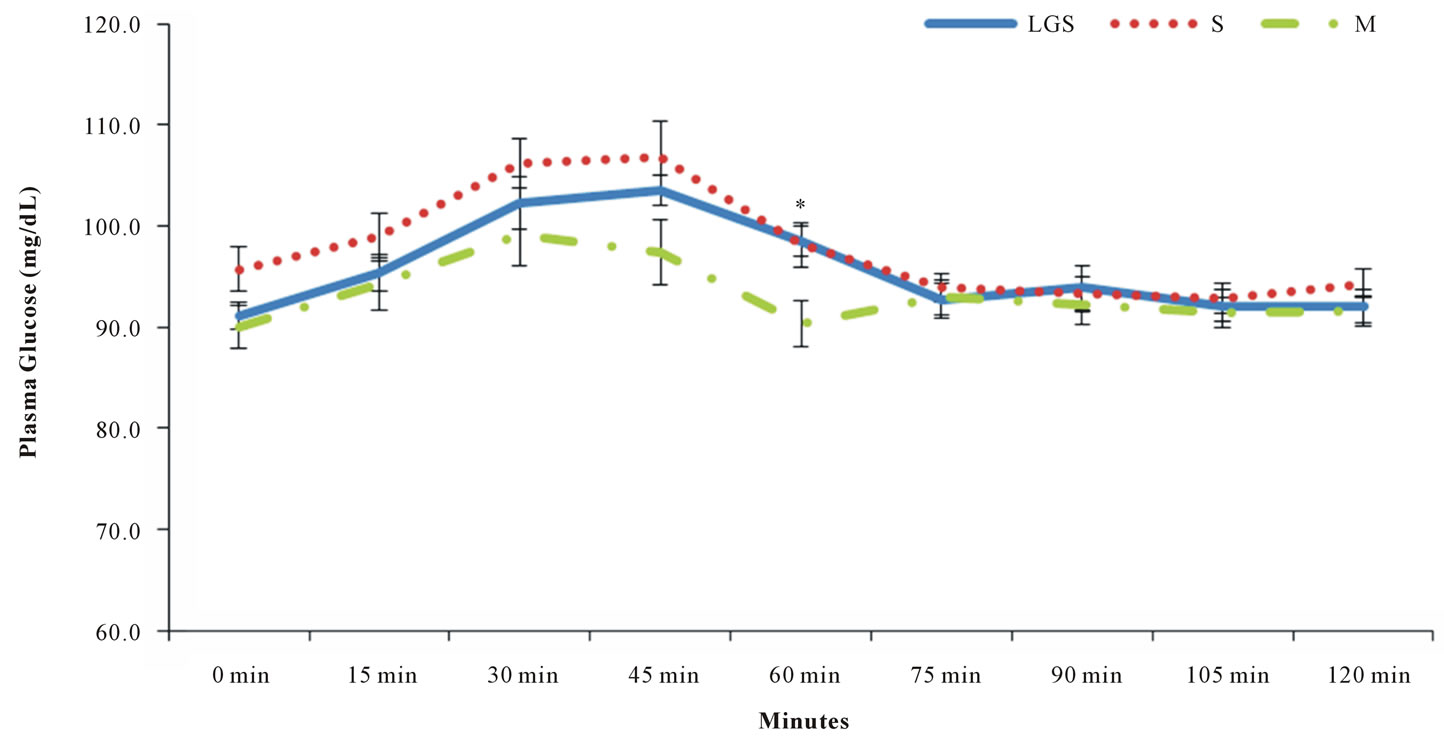
Figure 1. Glucose curves of low glycinin soymilk (LGS), conventional soymilk (S) and bovine milk (M). Data are: Means ± SEM. * (P < 0.05). Time*treatment effect P = 0.331.
trast, other authors did not find differences in the glucose response in short-term low GI food consumption [3,8, 21-23].
Animal studies developed by Tachibana et al. [24] and Moriyama et al. [25] affirmed that β-conglycinin improves glucose levels more than casein. Our results contradict such findings, with no differences in postprandial blood glucose response among the high, regular, and non-β-conglycinin beverages throughout the 120 min of the analysis in overweight and obese men (P = 0.338) (Figure 1). The maximum glucose peak was observed at 45 min after consumption for all beverages. Parillo et al. [26] proved that consumption of food products with similar carbohydrate content but different GI’s promote different postprandial blood glucose response. In the present study, there were no differences in postprandial blood glucose response. The only difference observed in the postprandial glucose response throughout the time among the different beverages, was a slightly lower blood glucose concentration at 60 min with bovine milk (P = 0.021). However, after 75 min, blood glucose levels tended to stabilize at 90 - 100 mg/dL with all beverages. Indeed, Liu et al. [27] recently reported no differences among soy protein or milk protein, with or without isoflavones, in fasting or 2-h postprandial glucose concentrations after a 3-month intervention.
Low glycinin soymilk and conventional soymilk showed fewer monophasic than biphasic glucose curves. However, the glucose curve type did not influence the glycemic response (Table 2). According to Tschiritter et al. [18] biphasic glucose curves are more often associated with normal glucose tolerance than monophasic curves, and most of the curves observed with soymilk consumption were biphasic. Dietary protein showed a slight influence; however, the difference of 6 g/day of protein intake was not enough to produce significant changes in glycemic responses among beverages (Table 2). The comparison between energy intake and energy requirement showed that most of the participants in the present study were at or below their requirement (Table 3).
Low glycinin soymilk, S and M presented average fasting blood glucose values of 91.1 ± 5.5 mg/dL, 94.1 ± 7.7 mg/dL and 91.2 ± 8.2 mg/dL, respectively. These small differences were influencing the postprandial blood glucose response (P = 0.0006, power of 96%). Fasting glucose concentrations positively correlated with GI, meaning that the higher the initial blood glucose concentration under fasting conditions, the higher the glycemic response will be.
The GL among beverages did not present significant differences. Our results are similar to the study developed by Torres and Torres et al. [28] who determined that soymilk has a GL of 4.8 and bovine milk has a GL of 2.0. Their study determined that soymilk beverages are low GI products and consumption of soymilk with low
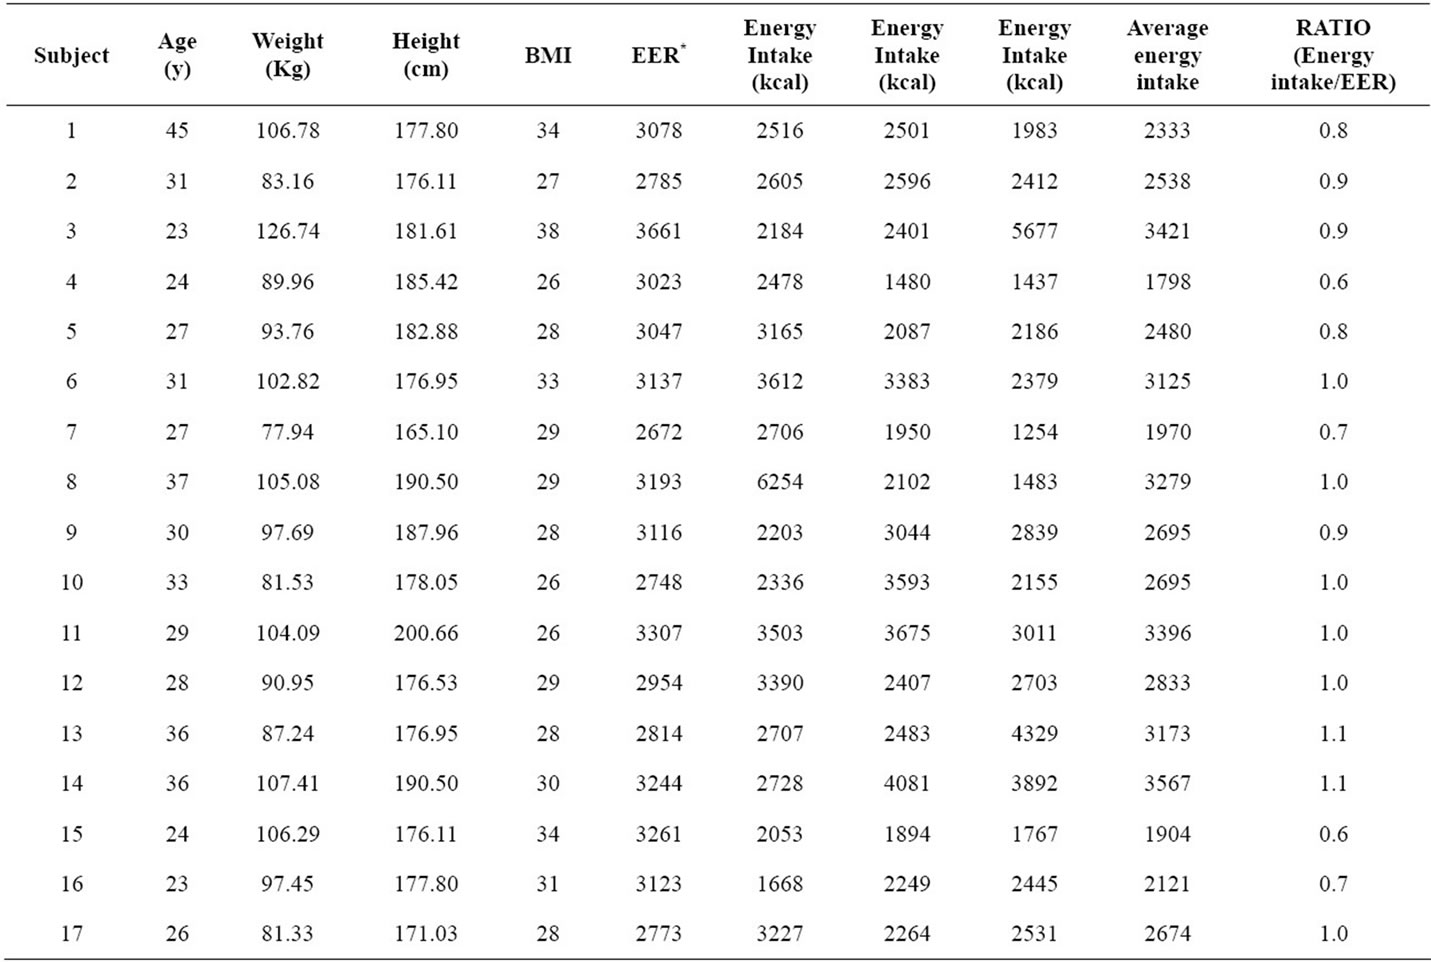
Table 3. Energy intake/estimated energy requirement ratio per subject.
*EER (Estimated Energy Requirement) was calculated based on the Dietary Reference Intakes guidelines http://www.nal.usda.gov/fnic/DRI//DRI_Energy/107-264.pdf. Total energy intake was calculated according to the energy consumption declared by participants in three different days using 24-h recalls.
carbohydrate concentrations reduced insulin secretion and can be recommended in obese and diabetic individuals. According to Murakammi et al. [14] low GL diets might be an effective strategy for preventing overweight in Japanese children and male adolescents and high GL diets may increase risks related with overweight. They also found an interesting association of low dietary GL with a decrease in highly refined grain intake and an increase in fruit and vegetable intake. These and other positive correlations determined in past studies, led us to hypothesize that the inclusion of low glycinin soymilk or conventional soymilk may contribute to a decrease in the total daily dietary GL, decreasing overweight-related risks and positively modify dietary patterns.
5. CONCLUSION
In conclusion, all beverages used in the present study are considered low GI foods. Postprandial glycemic responses were not affected by the consumption of LGS, S or M, and thus we can conclude that beverages with different protein profiles with similar GI values do not have different glucose responses in overweight men. Our results suggest that the high content of β-conglycinin in low glycinin soymilk did not have an effect in postprandial blood glucose response in overweight men.
6. ACKNOWLEDGEMENTS
EGM and KCN designed research; DFR, LKD, JL, KCN and EGM conducted research; DFR performed statistical analysis; DFR wrote the paper; EGM, LKD and KCN made revisions and additions to the manuscript. EGM had primary responsibility for final content. All authors read, critically reviewed and approved the final manuscript. Authors acknowledge the support of Archer Daniels Midland, Company, Decatur, IL, in particular of Tom Gottemoller for the production of soymilk powders and Russ Egbert and Joe Richardson for the processing of the soymilks; authors acknowledge the support of Dr. Neal Bringe for all the logistics and help in the development of the samples; and the Illinois Soybean Association for project funding. Subject’s participation in the study is also acknowledged.
USDA Cooperative State Research, Education and Extension Service (CSREES), AG548 2005-34505-15767 Future Foods IL to EGM, Illinois Soybean Association, IL to KC-N and EGM.
Author disclosures: DFR, LKD, JL no conflicts of interest. EGM and KCN received grant support from Illinois Soybean Association to conduct this study.
The study sponsors had no role whatsoever in the study design; in the collection, analyses, and interpretation of data; in the writing of the report; or in the decision to submit the report for publication.
![]()
![]()
REFERENCES
- Brounds, F., Bjorck, I., Frayn, K.N., Gibbs, A.L., Lang, V., Slama, G. and Wolever, T.M.S. (2005) Glycaemic index methodology. Nutrition Research Reviews, 18, 145-171. doi:10.1079/NRR2005100
- FAO and WHO (1998) Carbohydrates in human nutrition. Accessed March 2011. Available from http://www.fao.org/docrep/w8079e/w8079e00.htm#Contents
- Cocate, P.G., Pereira, L.G., Marins, J.C.B., Cecon, P.R., Bressan, J. and Alfenas, R.C.G. (2011) Metabolic responses to high glycemic index and low glycemic index meals: A controlled crossover clinical trial. Nutrition Journal, 10, 1. doi:10.1186/1475-2891-10-1
- American Diabetes Association (ADA) (2011) Food and fitness. Glycemic index and diabetes. Accessed March, Available from http://www.diabetes.org/food-and-fitness/food/planning-meals/glycemic-index-and-diabetes.html
- Stephenson, M.F., Mfuna, L., Dowd, S.E., Wolcott, R.D., Barbeau, J., Poisson, M., James, G. and Desrosiers, M. (2010) Molecular characterization of the polymicrobial flora in chronic rhinosinusitis. Journal of Otolaryngology and Head and Neck Surgery, 39, 182-187.
- Foster-Powell, K., Holt, S.A.H. and Brand-Miller, J.C. (2002) International table of glycemic index and glycemic load values: 2002. American Journal of Clinical Nutrition, 76, 5-56.
- Brand-Miller, J.C. (2004) Postprandial glycemia, glycemic index, and the prevention of type 2 diabetes. American Journal of Clinical Nutrition, 80, 243-244.
- Isken, F., Klaus, S., Petzke, K.J., Loddenkemper, C., Pfeiffer, A.F.H. and Weickert, M.O. (2010) Impairment of fat oxidation under high vs. low glycemic index diet occurs before the development of an obese phenotype. American Journal of Physiology and Endocrinoogy Metabolism, 298, e287-e295. doi:10.1152/ajpendo.00515.2009
- Fernandes, G., Velangi, A. and Wolever, T. (2005) Glycemic index of potatos commonly consumed in North America. Journal of the American Dietetic Association, 10, 557-562. doi:10.1016/j.jada.2005.01.003
- Wolover, T.M.S., Vorster, H.H., Bjorck, I., Brand-Miller, J., Brighenti, F., Mann, J.I., Ramdath, D.D., Granfeldt, Y., Holt, S., Perry, T.L., Venter, C. and Xiaomei, W. (2003) Determination of the glycemic index of foods: Interlaboratory study. European Journal of Clinical Nutrition, 57, 475-482. doi:10.1038/sj.ejcn.1601551
- Lacombe, A. and Ganji, V. (2010) Influence of two breakfast meals differing in glycemic load on satiety, hunger, and energy intake in preschool children. Nutrition Journal, 9, 53. doi:10.1186/1475-2891-9-53
- Jenkins, D.J.A., Kendall, C.W.C., Augustin, L.S.A., Franceschi, S., Hamidi, M., Marchie, A., Jenkins, A.L. and Axelsen, M. (2002) Glycemic index: Overview of implications in health and disease. American Journal of Clinical Nutrition, 76, 266S-273S.
- Ludwig, D.S. (2000) Dietary glycemic index and obesity. Journal of Nutrition, 130, S280-S283.
- Murakami, K., Miyake, Y., Tanaka, K. and Arakawa, M. (2011) Dietary glycemic index and glycemic load in relation to risk of overweight in Japanese children and adolescents: The Ryukyus child health study. International Journal of Obesity (Lond), 35, 925-936. doi:10.1038/ijo.2011.59
- Liese, A.D., Schulz, M., Fang, F. and Wolever, T.M.S. (2005) Dietary glycemic index and glycemic load, carbohydrate and fiber intake, and measures of insulin sensitivity, secretion, and adiposity in the insulin resistance atherosclerosis study. Diabetes Care, 25, 2892-2838.
- Institute of Medicine (2002) Dietary reference intakes for energy, carbohydrates, fiber, fat, protein, and amino acids (macronutrients). Panel on Micronutrients, Subcommittees on Upper Reference Levels of Nutrients and of Interpretation and Use of Dietary Reference Intakes, and the Standing Committee on the Scientific Evaluation of Dietary Reference Intakes. National Academy Press, Washington DC.
- Solnica, B., Naskalski, J.W. and Sieradzki, J. (2003) Analytical performance of glucometers used for routine glucose self-monitoring of diabetic patients. Clinical Chimica Acta, 331, 29-35. doi:10.1016/S0009-8981(03)00079-2
- Tschritter, O., Fritsche, A.,Shirkavand, Machicao, F., Haring, H. and Stumvoll, M. (2003) Assessing the shape of the glucose curve during an oral glucose tolerance test. Diabetes Care, 26, 1026-1033. doi:10.2337/diacare.26.4.1026
- Barclay, A., Gilbertson, H., March, K. and Smart, C. (2010) Dietary management in diabetes. Australian Family Physician, 39, 579-583.
- Stevenson, E., Williams, C. and Nute, M. (2005) The influence of the glycaemic index of breakfast and lunch on substrate utilization during the postprandial periods and subsequent exercise. British Journal of Nutrition, 93, 885-893. doi:10.1079/BJN20051430
- Jenkins, D.J., Srichaikul, K., Kendall, C.W., Sievenpiper, J.L., Abdulnour, S., Mirrahimi, A., Meneses, C., Nishi, S., He, X., Lee, S., So, Y.T., Esfahani, A., Mitchell, S., Parker, T.L., Vidgen, E., Josse, R.G. and Leiter, L.A. (2011) The relation of low glycaemic index fruit consumption to glycaemic control and risk factors for coronary heart in type 2 diabetes. Diabetologia, 54, 271-279. doi:10.1007/s00125-010-1927-1
- Kurotobi, T., Fukuhama, K., Inage, H. and Kimura, S. (2010) Glycemic index and postprandial blood glucose response to Japanese strawberry jam in normal adults. Journal of Nutritional Sciences and Vitaminology, 56, 198-202. doi:10.3177/jnsv.56.198
- Nuttal, F.W., Gannon, M.C. and Hoover, H. (2011) Glycemic response to ingested Dreamfields pasta compared with traditional pasta. Diabetes Care, 34, e17-e18.
- Tachibana, N., Iwaoka, Y., Hirotsuya, F.H. and Kohn, O.M. (2010) β conglycinin lowers very-low Density Lipoprotein-Triglycerides levels by increasing adiponectin and insulin sensitivity in rats. Biosciences, Biotechnology and Biochemistry, 74, 1250-1255. doi:10.1271/bbb.100088
- Moriyama, T., Kishimoto, K., Nagal, K., Urade, R., Ogawa, T., Utsimi, S., Maruyama, N. and Maebuchi, M. (2004) Soybean β conglycinin diet suppresses serum triglyceride levels in normal and genetically obese mice by induction of β oxidation, downregulation of fatty acid synthase and inhibition of triglyceride absorption. Biosciences, Biotechnology and Biochemistry, 68, 352-359. doi:10.1271/bbb.68.352
- Parillo, M., Annuzzi, G., Rivellese, A.A., Bozzetto, L., Alessandrini, R., Riccardi, G. and Capaldo, B. (2011) Effect of meals with different glycaemic index on postpandrial blood glucose response in patient with type 2 diabetes treated with continuous subcutaneous insulin infusion. Diabetes Medicine, 28, 227-229. doi:10.1111/j.1464-5491.2010.03176.x
- Liu, Z.M., Chen, Y.M., Ho, S.C., Ho, Y.P. and Woo, J. (2010) Effects of soy protein and isoflavones on glycemic control and insulin sensitivity: A 6-mo double-blind, randomized, placebo-controlled trial in postmenopausal Chinese women with prediabetes or untreated early diabetes. American Journal of Clinical Nutrition, 91, 1394- 1401. doi:10.3945/ajcn.2009.28813
- Torres Torres, N., Palacios-Gonzalez, B., Noriega-Lopez, L. and Tovar-Palacio, A.R. (2006) Indice glicemico, indice insulinemic y carga glicemica de bebidas de soya con un contenido bajo y alto de hidratos de carbono. Revista Investigacion Clinica, 58, 487-497.