Journal of Behavioral and Brain Science
Vol.3 No.5(2013), Article ID:36666,8 pages DOI:10.4236/jbbs.2013.35045
Classification of Masseter Activity Patterns during Chewing in Healthy Young Adults: The Effect of Taste Signals
1Department of Health and Nutrition, Niigata University of Health and Welfare, Niigata, Japan
2Department of Health and Nutrition, University of Niigata Prefecture, Niigata, Japan
Email: miyaoka@nuhw.ac.jp
Copyright © 2013 Yozo Miyaoka et al. This is an open access article distributed under the Creative Commons Attribution License, which permits unrestricted use, distribution, and reproduction in any medium, provided the original work is properly cited.
Received July 1, 2013; revised August 5, 2013; accepted August 15, 2013
Keywords: Taste; Chewing; Surface Electromyogram; Masseter Activity Pattern; Cluster Analysis; Human
ABSTRACT
This study examined the effects of the textural properties and chemical components of foods on masseter activity patterns. Ten healthy young participants (seven men and three women) were asked to chew four gummy candies with different flavors while their masseter activities were recorded by a surface electromyogram. The masseter activity patterns during chewing were analyzed quantitatively using a TP technique, generating three TP values (T25, T50 and T75). The textural analysis included four representative properties, and six sugars and four organic acids were tested in the chemical analysis. The hierarchical cluster analysis classified the T25 and T75 values into four subclusters and classified the T50 values into three subclusters. Two T75 subclusters differed significantly in the combined amounts of the two predominant sugars (sucrose and maltose); however, these T75 subclusters did not differ in their organic acid contents or textural properties. Therefore, sucrose and maltose affect masseter activity patterns during chewing, particularly in the later stage of masseter activity.
1. Introduction
Previous studies in rats and humans have examined the effects of taste signals [1-3] and textural signals [3-5] on masticatory and facial muscle activities by measuring various physiological parameters. These studies used not only parameters describing the entire chewing sequence, such as the number of chews and chewing time, but also parameters concerning the muscle activity of each chew, such as the mean voltage and cycle duration of each chewing burst. These studies revealed important findings regarding the amplitude and duration of chewing muscle behaviors in response to textural and taste signals from the orofacial region.
As we reported previously [6], muscle activities possessing the same amplitude and duration can nevertheless exhibit completely different patterns, e.g., one muscle may exhibit an incrementing burst pattern of activity, while another muscle exhibits a decrementing pattern. Accordingly, muscle activity patterns must be assessed independently of amplitudinal and durational parameters (see [6] for details). To permit this assessment, we developed the TP technique to quantify activity patterns [7]. This technique calculates several TP values that are independent of amplitudinal and durational parameters [6]. The TP values enable the comparison of two activity patterns that differ in amplitude and duration, elevating the activity pattern analysis from qualitative to quantitative.
The present study first applied the TP technique to masseter activity during the chewing of test foods, i.e., gummy candies, to examine whether textural and taste signals affect masticatory muscle activity patterns. Few studies have used specific parameters to quantitatively assess activity patterns. The present study also applied a cluster analysis to the masseter data to determine which food properties affected the activity patterns, while separate instrumental and chemical analyses determined the textural and taste properties of the test foods, respectively.
2. Materials and Methods
2.1. Participants
Ten healthy young adults (seven men and three women, average age of 20 years) participated in this study after providing informed consent. The experiments were approved by the Ethics Committee of the Niigata University of Health and Welfare.
2.2. Test Foods
Four gummy candies (GC; Meiji Co., Ltd., Tokyo, Japan) with different fruit flavors (apple, grape, orange, and pear) served as the test foods. The candy shapes differed slightly as the candies were produced to imitate the original fruits (e.g., the orange-flavored GC was shaped to resemble a small orange), but the dimensions of the candies were similar. The approximate candy heights, widths, and thicknesses were 9.5 mm, 23.6 mm, and 15.0 mm, respectively.
2.3. Textural Analysis
Four textural properties of the GCs, namely hardness, cohesiveness, adhesiveness, and gumminess, were measured at approximately 25˚C using a Texture Profile Unit (TPU-2S, Yamaden Inc., Tokyo, Japan). A cylindrical plunger (8 mm in diameter) was used to measure the texture. Each candy sample was placed into a cylindrical stainless steel container (50 mm in diameter and 15 mm in height) that was then placed under the plunger of the Texture Profile Unit. The sample was compressed twice at a speed of 2.5 mm/s with a 2.0 mm clearance.
2.4. Chemical Analyses
The sugars and organic acids in the four GCs were extracted by cutting the GCs into pieces, adding a protease solution, and then incubating the extracts at 25˚C for 16 hours to dissolve the gelatin. To analyze the sugars, ethanol was added to the extracts to a final concentration of 80%, and the samples were centrifuged for 10 min at 7000 rpm. The resulting supernatants were filtered through a 0.45-µm pore membrane filter (GE Healthcare, Piscataway, NJ, USA), and the filtered extracts were injected onto a high performance liquid chromatograph system (HPLC; Shimadzu Co., Kyoto, Japan). A solution of acetonitrile/20 mM monoethanolamine (75/25 v/v) served as the mobile phase at a constant flow rate of 1.0 mL/min. The HPLC system was equipped with a refractive index detector (RID-10A, Shimadzu Co., Kyoto, Japan) and an amino column (Asahipak NH2P-50 4E, 4.6 mm ID*250 mm, Showa Denko K. K., Tokyo, Japan) at 40˚C. To analyze the organic acids, the extracts of GCs were centrifuged and then filtered as described above. The extracts were injected onto the HPLC that was connected to a post-column pH-buffered electroconductivity detection system. Analytical separation was performed using two ion exclusion columns (Shim-pack SCR-102H, 8.0 mm ID*300 mm, Shimadzu Co., Kyoto, Japan) at 40˚C. A solution of 5 mM p-toluenesulfonic acid in distilled water served as the mobile phase (flow rates, 0.8 mL/min) with two reaction reagents, i.e., 5 mM p-toluenesulfonic acid, 20 mM bis(2-hydroxyethyl)imino tris (hydroxymethyl)methane and 100 mM disodium ethylenediaminetetraacetic acid in distilled water. Detection was conducted with a conductivity detector (CDD-10 Avp, Shimadzu Co., Kyoto, Japan).
2.5. Procedures
Three recordings were used to monitor the chewing behavior of each participant. First, a pair of adhesive electrodes (Ambu Inc., Blue Sensor, Maryland, USA) was attached to the skin just above the masseter muscle (Mass) on the participant’s habitual working side to record a surface electromyogram (EMG). The Mass EMG signals were amplified, filtered (bandwidth, 15 Hz - 3 kHz), fully rectified, and integrated (time constant, 0.06 s) using the PowerLab system (ADInstruments Pty Ltd., PowerLab/8sp, Bella Vista, Australia). Second, an accelerometer (Takei Scientific Instruments Co., Ltd., Tokyo, Japan) was attached to the skin of the chin to monitor the jaw movement associated with chewing. Finally, two video cameras (Logicool®, Qcam Communicate STX, Tokyo, Japan) were used to monitor the body, neck, and head movements of each participant from the frontal and lateral views. The collected data were stored and analyzed on the PowerLab system.
Each participant was seated on a chair in an electrically shielded room kept at approximately 25˚C. Each participant was provided with the instructions regarding the chewing tasks via a computer display that was placed on a desk in front of him/her. The participant received one of the four GCs (selected at random) and was asked to chew it at a natural rhythm. The participant was permitted to chew on both sides of the mouth, despite the fact that the EMG electrodes were attached to the habitual working side. The participant was also asked to swallow whenever he/she felt that the food had been chewed fully. After swallowing, the participant was allowed to drink room temperature green tea (Ohi-ocha, Ito-en, Tokyo, Japan). One experimental session consisted of up to 12 trials with one participant (one minute intervals between trials). A total of 108 trials with ten test foods were conducted by the ten participants. Of these 108 trials, 40 trials (10 participants × 4 GC) were selected for further analysis. Five Mass EMG bursts recorded during the initial five chewing cycles in each trial were then analyzed. Thus, 200 Mass bursts (5 Mass bursts × 40 trials) were analyzed.
2.6. Data Analysis
The start and end of each chewing cycle were determined based on the Mass EMG data, and the cycle duration of each of the initial five chews was measured. The determined parameters were confirmed based on the jaw movement trajectory using the accelerometer and by visual observations using the video camera monitors. The TP technique was then applied to the Mass EMG values of the initial five cycles in each chewing sequence to quantify the EMG activity patterns [8,9]. The TP technique was performed as follows: 1) an EMG is calculated as the cumulative total from the start to the end of the burst; 2) the cumulative EMG is divided into four equal sections; 3) the duration from the start to the end of the burst is defined as 1.000 (normalized); 4) the four section values are serially projected onto the normalized time scale; and 5) the three projected values are designated as the three TP values. Thus, each TP value designates the relative location of the EMG on a normalized time scale.
Four parameters were analyzed in this study: the number of chewing cycles, the chewing time, the peak amplitude of the integrated Mass EMG, and the cycle duration of the raw Mass EMG. The chewing cycle number was determined by counting the bursts in the Mass EMG that occurred between the start and the end (i.e., just before swallowing) of each chewing sequence. The chewing time was defined as the cycle duration from the start to the end of each chewing sequence. The peak amplitude was defined as the highest value of the integrated Mass EMG. The cycle duration of the raw Mass EMG was defined as the interval from the start to the end of each burst in the Mass EMG. The peak amplitude and the cycle duration were measured for the first chewing cycle only.
2.7. Statistical Analysis
2.7.1. General Statistical Analysis
One-way analysis of variance (ANOVA) with the factor “test food” was used to detect significant differences in the textural properties and chemical compositions of the GCs. The ANOVA was followed by Tukey’s HSD test to detect specific differences between food pairs. The nonparametric Kruskal-Wallis (K-W) and subsequent SteelDwass (S-D) tests were used to detect general differences between the GCs and specific differences between the food pairs, respectively, when homogeneity of variances was rejected. P < 0.05 was considered to indicate statistical significance.
2.7.2. Cluster Analysis
The three TP values (T25, T50, and T75) that were calculated from the 200 Mass bursts were arranged into a 200 (5 Mass bursts × 40 trials) matrix and subjected to hierarchical cluster analysis using the “R” computer program
[10]. Prior to cluster analysis, the 200 TP values for each GC were corrected for the estimates of two major effects, namely “participants” and “chewing cycles”, by two-way ANOVA using these two factors. This correction was performed to clarify the clustering of the TP values based on GC. The standardized Euclidean distance and Ward linkage methods were used for cluster amalgamation, and the results were plotted as dendrograms. An amalgamation level was set to permit further analysis (see the next subsection), specifically, 12% of the largest distance of each dendrogram (Figures 1-3).
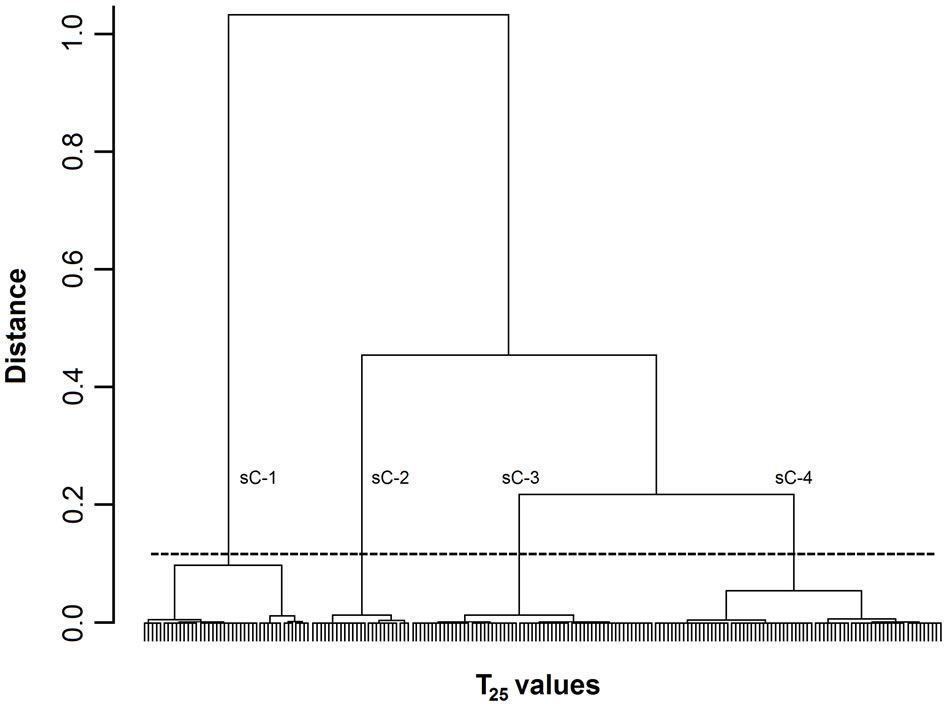
Figure 1. Dendrogram of T25 values. The 200 T25 values were grouped into subclusters based on the similarity of their masseter activity patterns. sC-1, -2, -3, and -4 indicate subclusters-1, -2, -3, and -4, respectively. The horizontal dotted line indicates the amalgamation level of the four subclusters. The labels for each T25 value at the base of the dendrogram have been omitted for clarity.
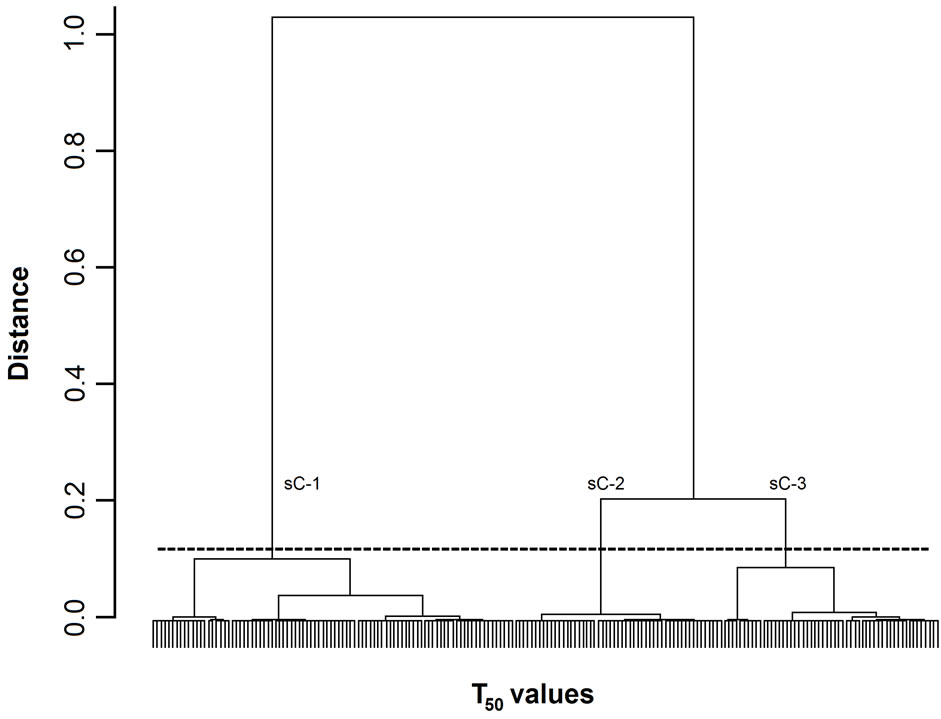
Figure 2. Dendrogram of T50 values. The 200 T50 values were grouped into subclusters based on the similarity of their masseter activity patterns. T50 values. sC-1, -2, and -3 are subclusters-1, -2, and -3, respectively. The horizontal dotted line indicates the amalgamation level of the three subclusters. The labels for each T50 value at the base of the dendrogram have been omitted for clarity.
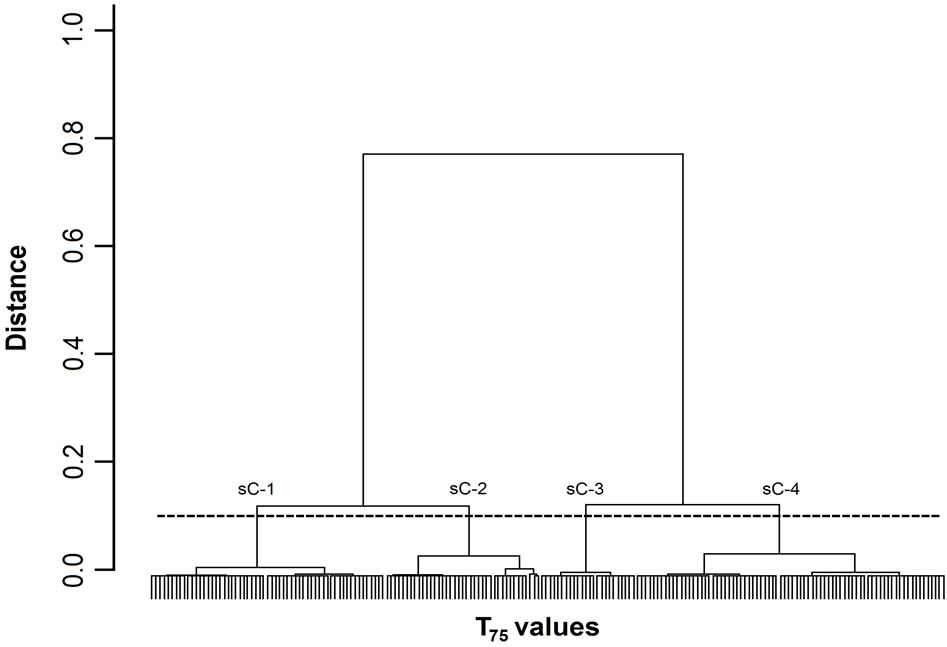
Figure 3. Dendrogram of T75 values. The 200 T75 values were grouped into subclusters based on the similarity of their masseter activity patterns. sC-1, -2, -3, and -4 represent subclusters-1, -2, -3, and -4, respectively. The horizontal dotted line indicates the amalgamation level of the four subclusters. The labels for each T75 value at the base of the dendrogram have been omitted for clarity.
2.7.3. Analysis of Variance
The three or four subclusters of individual TP values were combined and then compared in terms of their food properties (Tables 1-3) using a one-way ANOVA with “subclusters” as a factor. Six sugars were evaluated in the GCs (Table 2), but only the average sums of the two main sugars (maltose and sucrose) were used for the ANOVA in this study. These two sugars accounted for two-thirds or more (67.1% to 79.9%) of the sugars in the GCs. In addition, the two main organic acids (citric acid and malic acid) were selected from among the four organic acids in the GCs (Table 3) for the ANOVA. These two organic acids accounted for almost all (89.7% to 98.5%) of the organic acids in the GCs. Two-factor ANOVA (‘Food’ and ‘Participant’) were used to detect significant differences between the parameters for the six foods and the ten participants. The ANOVA was followed by Tukey’s HSD test to detect specific differences between food pairs but not between participant pairs. For
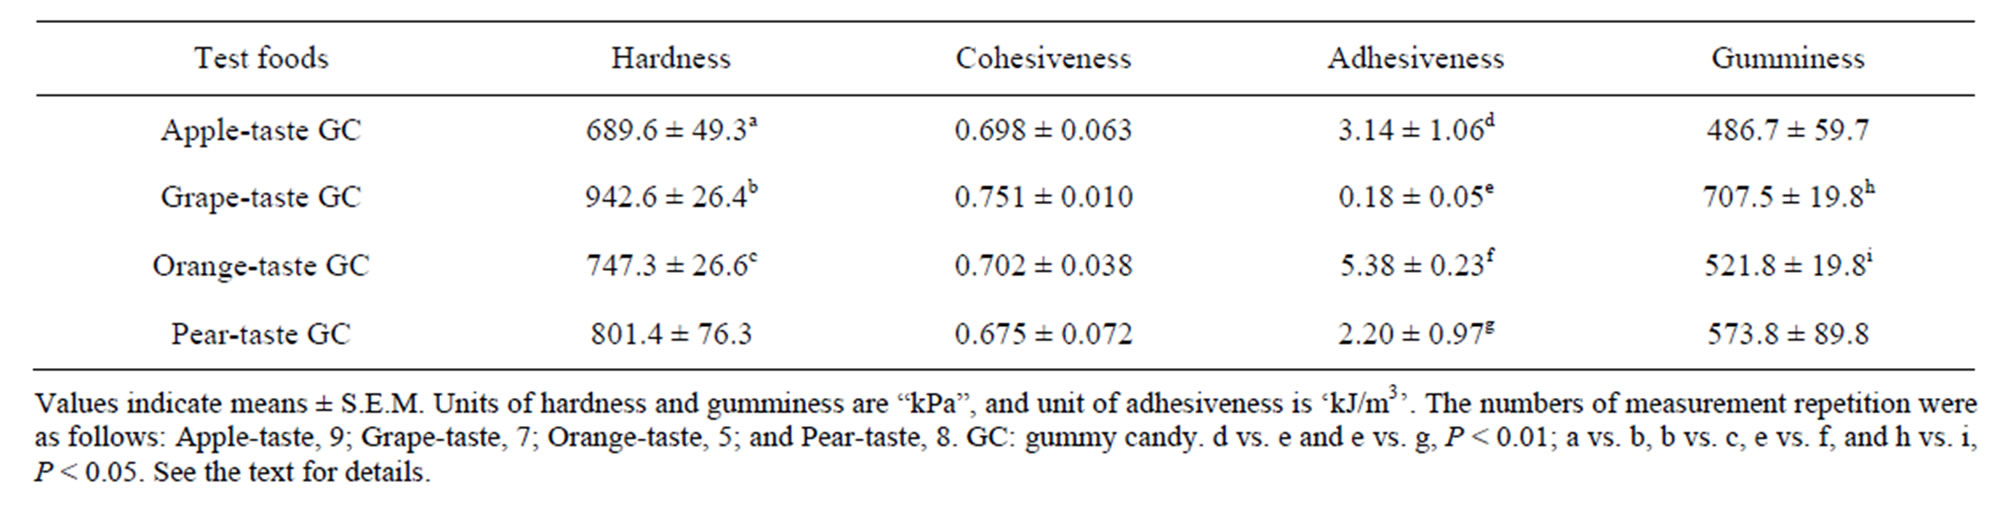
Table 1. Textural properties of used gummy candies.
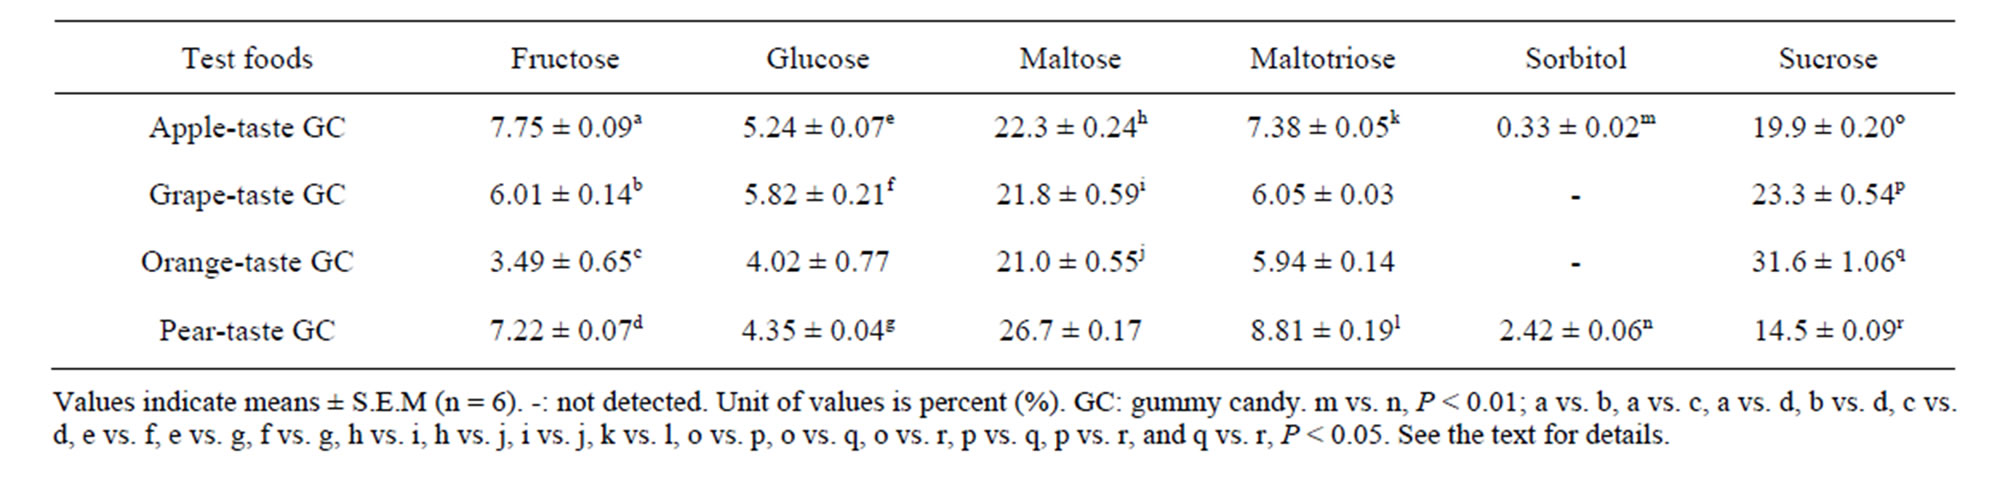
Table 2. Sugars in the four test foods used.
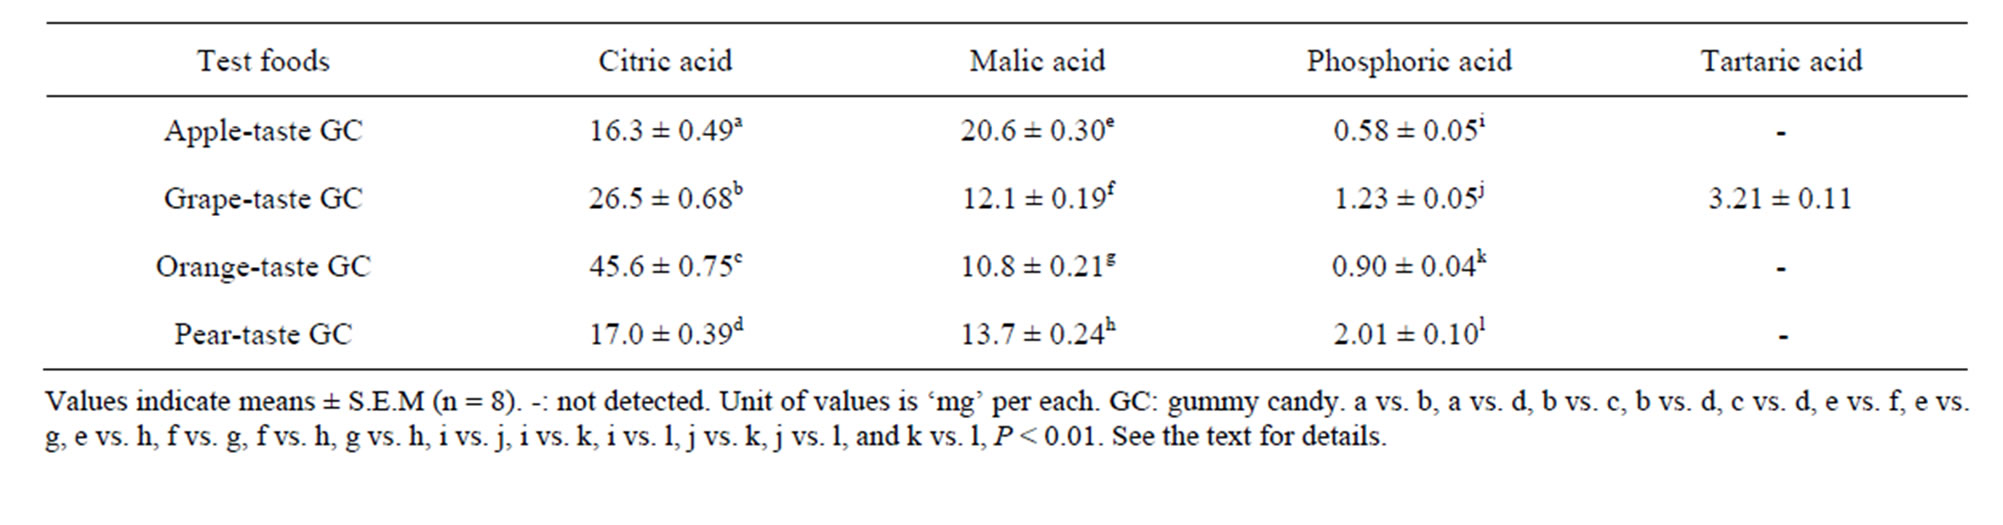
Table 3. Organic acids in the four test foods used.
the LRM analysis, the following linear model was assumed:
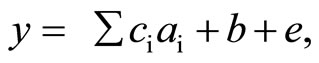
where y is an observation of one of the parameters (such as cycle duration or peak amplitude), ai (i = 1, 2, 3, 4) represent the four regressive effects of the three textural properties (“Hardness”, “Fracturability”, and “Adhesiveness”) and the “Height” of the foods, ci represents the four regression coefficients for the four regressive effects, b is a fixed-main effect (Participant), and e is a random residual effect. Because “Cohesiveness” is a ratio of the positive force areas under the first and second compressions [9], this textural parameter was not included in the LRM analysis. The regression coefficients estimated in the significant regressive effects were used to denote the contributions in each parameter space. For example, if the “Height” of the six test foods ranged from A to B mm, and the regression coefficient of the “Height” on the “Chewing number” parameter was estimated as C, the contribution of the effect was denoted as “a (B − A) mm increase in the height increased (or decreased if C was negative) the chewing number by the amount of C × (B − A)”. The significance level was set at P < 0.05.
3. Results
3.1. Food Properties
Table 1 presents the averages of four textural properties for each GC. Kruskal-Wallis tests found that the GC differed significantly in terms of their hardness, adhesiveness, and gumminess (Ps < 0.05), but not in terms of their cohesiveness. The subsequent S-D tests also revealed significant differences among all six food pairs in terms of hardness, adhesiveness, or gumminess (Ps < 0.01 for two pairs and Ps < 0.05 for four pairs).
Table 2 summarizes the six sugars in the GC detected by HPLC analysis, although two GC (the grape and orange GCs) contained no sorbitol. Maltose and sucrose were the predominant sugars in the GCs. Kruskal-Wallis tests revealed that the amounts of all six sugars differed among the four GCs or between two GCs (sorbitol, apple and pear), i.e., fructose and sucrose, Ps < 0.001; maltose, maltotriose, and sorbitol, Ps < 0.01; and glucose, P < 0.05. The subsequent S-D tests revealed significant differences among the six possible GC pairs in terms of their sugar levels (P < 0.01 for one food pair, and Ps < 0.05 for 18 food pairs).
Table 3 presents four organic acids detected in the GCs, although the grape GC contained tartaric acid only. The analysis showed that citric acid and malic acid were the predominant organic acids in the GCs. A one-way ANOVA revealed that the four GCs differed in terms of their citric acid, malic acid, and phosphoric acid levels, but not tartaric acid (Ps < 0.001). Subsequent Tukey’s HSD tests showed that all six possible food pairs differed significantly in malic acid and phosphoric acid content (Ps < 0.01) and that five of the six pairs (with the exception of the pear and apple pair) differed significantly in citric acid content (Ps < 0.01).
3.2. TP Values
3.2.1. Differences between Gummy Candies
Table 4 shows the averages of the three TP values (T25, T50, and T75) that were calculated from the Mass EMGs recorded during the chewing of the four GCs. The average T25 and T50 values of the grape GC exceeded those of the apple and orange GCs, but by only 7.5% and 2.6%, respectively. A one-way ANOVA did not detect significant differences among the four foods in terms of the average T25 and T50 values. The apple GC had the highest average T75 value, while the orange GC had the lowest average T75 value. Although the difference between the apple and orange GCs was only 5.8%, the ANOVA detected a significant difference in the average T75 values of the four GCs (P < 0.005). Subsequent Tukey’s HSD tests detected a specific significant difference between the apple and orange GCs (P < 0.01).
3.2.2. Cluster Analysis
Figures 1-3 show dendrograms depicting the degrees of similarity between 200 Mass bursts in terms of the T25, T50, and T75 values. In these dendrograms, the Mass bursts are divided into clusters, which are then divided into subclusters. The distance between subclusters along the abscissa indicates the degree of similarity between the subclusters. The amalgamation level (12% of the largest distance of each dendrogram) set in this study produced three (sC-1 to sC-3 for the T50 values in Figure 2) or four (sC-1 to sC-4 for the T25 and T75 values in Figures 1 and 3) major subclusters in the dendrograms.
For the three TP values, each of the four subclusters contained 25 to 72 T25 values (Figure 1), each of the three subclusters contained 53 to 92 T50 values (Figure 2), and each of the four subclusters contained 24 to 78 T75 values (Figure 3). Chi-square tests did not detect
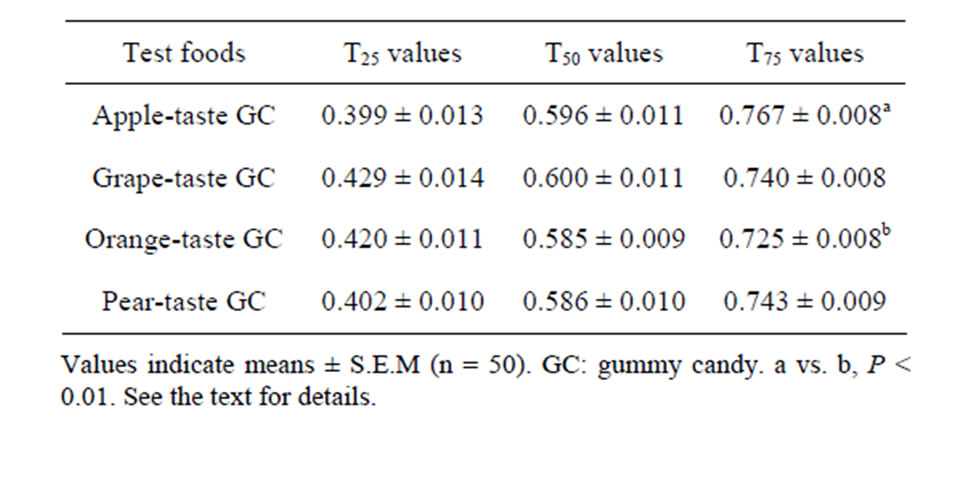
Table 4. Averages of the three TP values calculated.
significant differences among the three/four T25, T50, and T75 subclusters in terms of the numbers of TP values.
3.2.3. Differences in Food Properties between Subclusters
A one-way ANOVA was used to analyze the differences in the textural properties and sugar and organic acid contents of the four T25 subclusters (Figure 1) and the three T50 subclusters (Figure 2). The ANOVA did not reveal any significant differences between the T25 and T50 subclusters with respect to any of these parameters. However, an ANOVA of the T75 values (Figure 3) revealed significant differences between sC-1 and sC-4 in terms of their sugar levels (Figure 4). The T75 subclusters did not differ in terms of their textural properties or organic acid contents.
4. Discussion
4.1. Methodological Considerations
The present study used a hierarchical cluster analysis method followed by an ANOVA to evaluate the textural properties and chemical components of individual test foods corresponding to the clustered data for the three TP values. These analyses were used because the same test food item could not be consumed by the participants, used for the textural measurements, and used for chemical analyses. Therefore, we needed to collect the textural properties and chemical components of each test food separately, calculate their averages individually, and examine the correlations between TP values and these food properties. The hierarchical cluster analysis method once fragmented TP values according to their similarity and then grouped three (Figure 2) and four subclusters
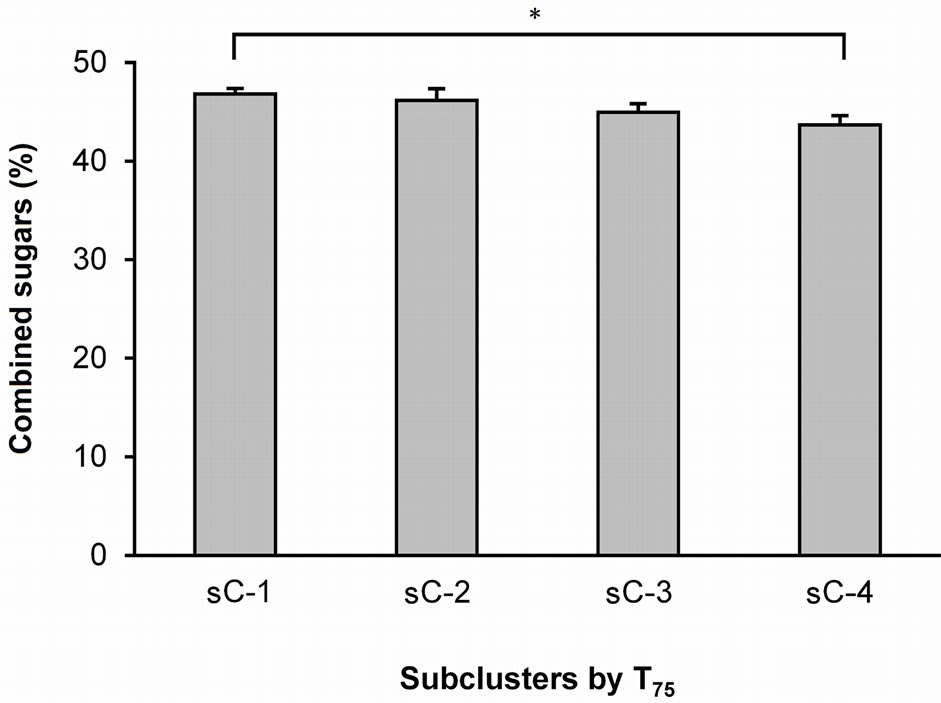
Figure 4. Average amounts of sucrose + maltose in the four T75 subclusters. The values indicate the means ± S.E.M. The sucrose + maltose levels were calculated by adding the average sucrose level of each gummy candy to the average maltose level. sC-1, -2, -3, and -4 are subclusters-1, -2, -3, and -4, respectively. P < 0.05.
(Figures 1 and 3) when the amalgamation level was established at 12% of the greatest distance in each dendrogram. As each TP value in the subclusters was associated with the specific textural properties and chemical compositions of each test food, ANOVA could be used to compare the subclusters in terms of their textural properties and chemical compositions.
4.2. Parameters of Activity Patterns
Previous physiological studies in rats [2] and humans [11-15] analyzed masseter activity during chewing of various foods, including liquids, with different textures and tastes. These studies assessed activity patterns indirectly by visual observation or by parameters such as the number of chews, chewing time, and mean voltage of the masseter activity. However, none of these studies used specific parameters for the assessments. As we reported previously [6], the use of specific parameters, such as TP values, is essential for the precise assessment of muscle activity patterns. For example, two muscle activities possessing the same amplitude and duration can show completely different (e.g., incrementing versus decrementing) activity patterns. Even in this situation, TP values can reveal quantitative differences between muscle activity patterns (see Figure 2 and Table 2 in [6]). In the present study, the average T75 value measured during the chewing of the orange GC was smaller than that measured during the apple (Table 4), implying that chewing the orange GC evokes an activity pattern that reaches the peak of an integrated Mass EMG earlier than that evoked by chewing the Apple GC.
4.3. Activity Pattern Changes and Sugars
The present study detected two major sugars, sucrose and maltose (Table 2), and determined the average amounts of these combined sugars that likely affected the differentiation of the two masseter burst patterns assessed by T75 values (Figure 4). The orange GC contained more sucrose than the apple GC (Table 2); however, these two test foods contained similar amounts of maltose, which is much less sweet than sucrose [16]. The amount of sucrose in the GCs is likely to be the major determinant for masseter activity patterns. However, it is difficult to draw a direct relationship between the amount of sucrose in the GC and the masseter activity patterns. For instance, we can consider the relationship by individually examining the three following stages: 1) afferent signals, 2) central processing at two levels, and 3) trigeminal motor outputs. Previous studies at the brain stem level revealed the intensity-response functions of sucrose (Nakamura et al.), the projections of neurons from the nucleus of the tractus solitarius to the oral motor nuclei (Travers et al.), and the latency (approximately 50 ms, rats) from lingual stimulation with 0.5 M sucrose to the onset of masseter activity [2]. To reveal the mechanism responsible for the changes in masseter activity patterns evoked by sweet signals, we need to accumulate more anatomical, physiological, and behavioral findings.
4.4. Possible Neural Mechanism Responsible
Taste stimuli applied directly to the mouth through a tube elicited various oromotor responses (lingual, facial, and masticatory musculature movements) in both normal rats [1] and decerebrated rats [17]. These studies suggest that the neural substrates that elicit the oromotor responses are located in the brainstem. The chorda tympani nerve mainly conveys neural signals evoked by taste stimuli on the tongue, while the rostral nucleus of the tractus solitarius in the medulla oblongata receives the neural signals from the chorda tympani nerve. Histologically, the neurons in the rostral nucleus of the tractus solitarius project their axons to the hypoglossal, facial, and likely trigeminal motor nuclei [18]. Physiological studies of the motor control of chewing show that the neural circuits in the reticular formation of the brainstem generate the basic masticatory pattern; these circuits are recognized as the masticatory central pattern generator [19]. Precise studies have provided evidence of the neural structures that control the rhythmic activation of chewing by sensory signals (including taste) from the orofacial region (e.g., [20,21]. Although these investigations suggest that the neural structures and mechanisms involved in these phenomena are not simple, these studies and the present study suggest that neural structures and mechanisms in the brainstem elicit the oromotor responses [1,17] that are responsible for the effect of taste signals on masseter activity patterns during chewing and the motor systems that regulate chewing [21].
5. Conclusion
In this study, we recorded the masseter activity of healthy young adults during the chewing of four GCs with different textures and tastes. We analyzed the recorded data, specifically, three TP values (T25, T50, and T75), to examine which properties of the GCs could affect masseter activity patterns. A hierarchical cluster analysis yielded three to four subclusters of TP values. We found that the sugar (sucrose and maltose) contents of the GCs, but not the textural properties or organic acid contents, were responsible for the masseter activity patterns, as classified by TP value.
6. Acknowledgements
This study was supported in part by Grants-in-Aid for Scientific Research from the Ministry of Education, Science and Culture of Japan (No. 22500740 to YM, No. 23700889 to TY, and No. 2050072 to IA).
REFERENCES
- H. J. Grill and R. Norgren, “The Taste Reactivity Test. I. Mimetic Responses to Gustatory Stimuli in Neurologically Normal Rats,” Brain Research, Vol. 143, No. 2, 1978, pp. 263-279.
- T. Yamamoto, R. Matsuo, T. Fujiwara and Y. Kawamura, “EMG Activities of Masticatory Muscles during Licking in Rats,” Physiology and Behavior, Vol. 29, No. 5, 1982, pp. 905-913.
- T. Horio and Y. Kawamura, “Effects of Texture of Food on Chewing Patterns in the Human Subject,” Journal of Oral Rehabilitation, Vol. 16, No. 2, 1989, pp. 177-183. doi:10.1111/j.1365-2842.1989.tb01331.x
- L. Mioche, P. Bourdiol, J. F. Martin and Y. Noel, “Variations in Human Masseter and Temporalis Muscle Activity Related to Food Texture during Free and Side-Imposed Mastication,” Archives of Oral Biology, Vol. 44, No. 12, 1999, pp. 1005-1012. doi:10.1016/S0003-9969(99)00103-X
- A. Peyron, C. Lassauzay and A. Woda, “Effects of Increased Hardness on Jaw Movement and Muscle Activity during Chewing of Visco-Elastic Model Foods,” Experimental Brain Research, Vol. 142, No. 1, 2002, pp. 41-51. doi:10.1007/s00221-001-0916-5
- I. Ashida, S. Kawakami and Y. Miyaoka, “A New Method of Simulating Surface Electromyograms Using Probability Density Functions,” Computers in Biology and Medicine, Vol. 38, No. 7, 2008, pp. 837-844.
- Y. Miyaoka, I. Ashida, D. Inagaki and S. Kawakami, “Differentiation of Activity Patterns in the Suprahyoid Muscles during Swallowing of Foods with Five Taste Qualities,” Journal of Sensory Studies, Vol. 20, 2005, pp. 473-483.
- Y. Miyaoka, I. Ashida, Y. Tamaki, S. Y. Kawakami, H. Iwamori, T. Yamazaki and N. Ito, “Sequential Analysis of Masseter Activity Patterns during Chewing in Healthy Males,” Journal of Medical Engineering & Technology, Vol. 37, No. 2, 2013, pp. 91-95. doi:10.3109/03091902.2012.747007
- Y. Miyaoka, I. Ashida, Y. Tamaki, S. Y. Kawakami, H. Iwamori, T. Yamazaki and N. Ito, “Analysis of Masseter Activity Patterns Using TP Values during Chewing of Foods with Different Shapes and Textural Properties,” Journal of Texture Studies, Vol. 44, No. 3, 2013, pp. 196- 204. doi:10.1111/jtxs.12012
- M. Crawley, “The R Book,” Wiley, New York, 2007. doi:10.1002/9780470515075
- H. Sakamoto, T. Harada, T. Matsukubo, Y. Takaesu and M. Tazaki, “Electromyographic Measurement of Textural Changes of Foodstuffs during Chewing,” Agricultural and Biological Chemistry, Vol. 53, No. 9, 1989, pp. 2421- 2433. doi:10.1271/bbb1961.53.2421
- R. Gonzalez, S. Sifre, J. Benedito and V. Nogues, “Comparison of Electromyographic Pattern of Sensory Experts and Untrained Subjects during Chewing of Mahon Cheese,” Journal of Dairy Research, Vol. 69, No. 1, 2002, pp. 151-161. doi:10.1017/S0022029901005325
- M. Alfonso, E. Neyraud, O. Blanc, M. A. Peyron and E. Dransfield, “Relationship between Taste and Chewing Patterns of Visco-Elastic Model Foods,” Journal of Sensory Studies, Vol. 17, No. 2, 2002, pp. 193-206. doi:10.1111/j.1745-459X.2002.tb00342.x
- T. Horio, “EMG Activities of Facial and Chewing Muscles of Human Adults in Response to Taste Stimuli,” Perceptual & Motor Skills, Vol. 97, No. 1, 2003, pp. 289-298. doi:10.2466/pms.2003.97.1.289
- E. Neyraud, M. A. Peyron, C. Vieira and E. Dransfield, “Influence of Bitter Taste on Mastication Pattern,” Journal of Dairy Research, Vol. 84, No. 3, 2005, pp. 250-254.
- A. Biester, M. W. Wood and C. S. Wahlin, “Carbonhydrate Studies: I. The Relative Sweetness of Pure Sugars,” American Journal of Physiology, Vol. 73, No. 1925, pp. 387-396.
- H. J. Grill and R. Norgren, “The Taste Reactivity Test. II. Mimetic Responses to Gustatory Stimuli in Chronic Thalamic and Chronic Decerebrate Rats,” Brain Research, Vol. 143, No. 2, 1978, pp. 281-297.
- R. Norgren, “Projections from the Nucleus of the Solitary Tract in the Rat,” Neuroscience, Vol. 3, No. 2, 1978, pp. 207-218.
- S. Nozaki, A. Iriki and Y. Nakamura, “Localization of Central Rhythm Generator Involved in Cortically Induced Rhythmical Masticatory Jaw-Opening Movement in the Guinea Pig,” Journal of Neurophysiology, Vol. 55, No. 4, 1986, pp. 806-825.
- J. B. Travers and R. Norgren, “Afferent Projections to the Oral Motor Nuclei in the Rat,” Journal of Comparative Neurology, Vol. 220, No. 3, 1983, pp. 280-298. doi:10.1002/cne.902200303
- S. P. Travers and R. Norgren, “Organization of Orosensory Responses in the Nucleus of the Solitary Tract of Rat,” Journal of Neurophysiology, Vol. 73, No. 6, 1995, pp. 2144-2162.