Journal of Transportation Technologies
Vol. 3 No. 2 (2013) , Article ID: 30442 , 10 pages DOI:10.4236/jtts.2013.32017
Tracking National Household Vehicle Usage by Type, Age, and Area in Support of Market Assessments for Plug-In Hybrid Electric Vehicles
Argonne National Laboratory, Argonne, USA
Email: yzhou@anl.gov
Copyright © 2013 Yan Zhou et al. This is an open access article distributed under the Creative Commons Attribution License, which permits unrestricted use, distribution, and reproduction in any medium, provided the original work is properly cited.
Received November 5, 2012; revised December 5, 2012; accepted December 11, 2012
Keywords: Vehicle Usage; PHEV; NHTS
ABSTRACT
Plug-in electric vehicle (PHEV) technology is seen as promising technology for reducing oil use, improving local air quality, and/or possibly reducing GHG emissions to support a sustainable transportation system. This paper examines the usage of household vehicles to support assessment of the market potential of plug-in hybrid electric vehicles (PHEVs), the higher purchase price of which requires high usage rates to pay off the investment in the technology. According to the 2009 National Household Travel Survey (NHTS), about 40% of household vehicles were not used on the survey travel day [1]. This study analyzed household vehicle use and non-use by vehicle type, age, area type (metropolitan statistical area [MSA] and non-MSA), and population density. Vehicles used on survey day with or without a reported travel time and distance in the survey are considered “vehicles used”. All others are referred to as “vehicles not used”. We divided the “vehicles not used” into three categories: 1) left at home while other household vehicles were used; 2) not used because travelers used other modes; and 3) no household trips. The “vehicle used” consists of two categories: 1) those with distance and time data and 2) those with no travel data. Within these five categories, vehicles were subdivided according to four vehicle types: car, van, SUV, and pickup. Each vehicle type was further subdivided in two age groups: 10 years or less (≤10) and more than 10 years (>10). In addition, vehicle usage was compared in both MSAs and non-MSAs and during weekdays and weekends. Results indicate that most vehicles—especially pickups—are not used because the households own and use other vehicles. Moreover, SUVs—especially newer SUVs (≤10 years)—are the most utilized vehicle type and should be strongly considered as a primary vehicle type for PHEVs, in addition to cars.
1. Introduction
According to the Energy Information Administration (EIA), in 2009 the transportation sector was responsible for 70% of petroleum consumption and 33% of GHG emissions in the United States [2]. Within the transportation sector, light-duty vehicles account for nearly 60% of its petroleum consumption [3]. By reducing fossil fuel use per mile of service delivered, sustainable transport leads to greater energy security and reduced greenhouse gas (GHG) emissions. Among several initiatives supported by the US government, one is to diversify transportation energy sources by using electricity to drive light-duty vehicles.
Although specifics are important, at a broad conceptual level, the technology for plug-in hybrid electric vehicles (PHEVs) is similar to that in regular hybrid electric vehicles (HEVs), except that they employ bigger batteries, which are recharged through electric vehicle supply equipment by drawing electricity from the grid.
Regarding specifics, there are three basic powertrain configurations and operational capabilities: series, parallel, and series-parallel (power-split) [4]. When the gridto-vehicle series operational capability is implemented in a PHEV, stored grid-supplied battery energy propels the vehicle initially. This phase of operation is called chargedepleting (CD) operation. The more power and energy that are available in the battery pack, the greater the vehicle’s ability to operate all electrically during CD. All PHEVs considered in this paper have some degree of ability to operate all electrically with grid electricity. The parallel and series-parallel tend to have much less power than the series configuration and are more likely to operate with both the engine and battery simultaneously providing power during CD operation. The three designs are distinguished from one another with respect to their operational capabilities when the engine comes on.
In a series PHEV, only the electric motor directly drives the wheels; the engine does not. There is a second electric machine, which operates as a generator (an electric machine can be reversed in rotational direction and can operate either as a generator or motor). The series configuration is an engine-to-generator-to-motor-to-wheels pathway. After the battery energy is depleted to a predetermined level, an internal combustion engine (ICE) turns the generator, which supplies current to the electric motor, which then rotates the vehicle’s drive wheels. When excess electric energy is available, the generator recharges the battery pack. Since it must do all the work of moving the vehicle, the electric motor of a series PHEV must be larger than that of the other two types.
By adding the conventional engine-to-transmission-towheels pathway, the parallel design can simultaneously transmit power to the drive wheels from both the internal combustion engine and the battery. Compared to the series PHEV, the parallel operational capability primarily uses the conventional mechanical link from the engine to the wheels, eliminating the ability of the engine to support simultaneous series operation. This restriction allows the parallel PHEV to use only one electric machine (motor/generator) of less power than in the series configuration, thereby reducing cost. By using two electric machines, the series-parallel design has the flexibility to operate the onboard engine to support either series or parallel mode, or both simultaneously. A specialized mechanical step splits engine power into two pathways: one to the wheels and another to the generator. For this reason, the series-parallel system is called a “power split”. Compared to the series PHEV, both the parallel and series-parallel are able to use much less electric machine and battery pack power, thus cutting costs. For a given level of acceleration capability, the series-parallel is more expensive than the parallel, but it is more efficient.
A PHEV travels its initial miles by making use of energy from the grid, which has been stored in the battery. If the power of the battery pack and electric machines is sufficient, propulsion may happen all electrically. However, as electric power capability is reduced to cut PHEV cost (as in parallel or parallel-series configurations), the battery power must often be supplemented by engine power during CD operation. Thus, PHEV designs will vary with respect to the share of electricity and fuel used as the battery pack is discharged. All PHEVs operate in “hybrid mode” (as an HEV) on fossil fuels once the battery is depleted, although they can differ in the way they do so, according to powertrain configuration, as previously discussed.
Because electricity is generated through the use of coal, nuclear, natural gas, hydro, and wind sources, widespread acceptance of PHEVs could diversify energy sources used in the transportation system. It is fairly well understood that the reduction in petroleum use by PHEVs increases with a corresponding increase in their onboard energy storage, which increases nonlinearly (less well known) with the size of the employed batteries. In many (but not all) cases, the increase in vehicle weight associated with bigger batteries partially offsets the potential reduction in petroleum use by PHEVs during engine operation. Another poorly understood attribute is that the power of the battery pack and electric machines is an important factor in the ability of PHEVs to electrify miles. Also in a nonlinear fashion, the higher the electrical power, the more electricity is used per mile of CD operation. More power means fewer miles until depletion of the pack and lower fossil fuel use during depletion, which translates into greater electrification potential. Clearly, the PHEV technology can cover a wide variety of options with respect to technical attributes, such as the battery chemistry, the amount of grid electricity that can be stored in the battery, and the powertrain and fuel choices. In addition, the driving behavior of consumers, such as driving aggressiveness and daily travel distance, could also significantly affect the energy use and the GHG effects of PHEVs.
Plug-in electric drive’s ability to eliminate oil use has become increasingly attractive since 2007 as 1) technical and economic feasibility has improved; 2) oil prices have increased significantly on average; and 3) oil prices have become more volatile. Starting in 2010, almost all of the major vehicle manufacturers offered—or planned to soon offer—PHEVs for sale to the mass market. Although the broad PHEV technology offers great promise, many questions about details remain unanswered. This paper examines the use of household vehicles to support assessment of the market potential of the many different PHEV technology options.
2. Contribution
To our best knowledge, no similar study has been conducted to assess the vehicle utilization by demographic factors. We have searched Google Scholar and TRID (http://www.trid.trb.org/) by using the following key words: vehicle utilization rates and vehicle usage rates.
New vehicle technologies are expensive at the early stage of implementation and require high usage to pay off. This paper helps decision makers and manufacturers identify the proper market niche of early vehicle models on the basis of the usage rate. Moreover, this paper details the reasons why vehicles were not used on travel days, which provides alternative perspectives to identify potential markets for PHEV powertrains.
3. Searching for High-Usage Vehicles
This paper examines usage of household vehicles—by type, age, and area—to support assessment of the market potential of PHEVs. However, the information obtained in the study is applicable to any costly powertrain that sharply reduces fuel costs, whether by use of a lessexpensive fuel or by higher efficiency. High usage rates are needed for such technologies to pay off. The paper complements a paper presented in 2011 [5], in which the 2001 National Household Transportation Survey (NHTS) was used to examine vehicle records, separating those records into groups of vehicles 1) older and newer than 10 years of age, and 2) above and below 50 miles of use per day.
One issue for the purchaser of such vehicles is the warranted life of the battery pack, which is at present eight years for the Nissan Leaf and Chevrolet Volt. If a pack replacement were necessary, and diminished rates of use were anticipated after the warranty period, the costs might be prohibitive and lead to a need to scrap the vehicle. Accordingly, the target market was drivers who used their vehicles intensively (high miles per day and many days per year), so that such vehicle would otherwise have its end of useful life at about the same time as the end of the useful life of the PHEV or EV battery (i.e., about 8 years). Another consideration was battery “cycle” life, which is believed to be about 3000 cycles. However, Vyas et al. assumed 5000 cycles to be possible by the year 2020 [6]. An assumption of charging overnight once for 90% of days for 10 years would lead to 3285 cycles, and so vehicles with a pack cycle life of 5000 cycles could be charged more than once per day on average, but not twice each day. The issue of charging a second time during the day has been addressed in Vyas et al. 2009 [7] and Elgowainy et al. 2012 [8]. Because calendar life (years of pack life) and cycle life have different causal mechanisms, a capability for greater cycle life may not lead to longer calendar life. Thus, there may be an incentive to use expensive PHEVs and EVs as intensively as possible, particularly if 5000 cycles or more can be obtained within a 10-year calendar life.
One aspect of use that has not been investigated is the proportion of days that a vehicle is in operation. We are aware that the 90% assumption used in the computations described above is optimistic and probably not typical. This paper is intended to address that assumption in the context of the 10-year life break point assumptions made previously [5]. In this paper, we analyze the probability of daily use to enhance our understanding of the market for personal-use PHEVs and EVs.
According to the 2009 NHTS [1], about 40% of vehicles on the survey travel day are reported as “not used”. At first glance, it appears that many households do not travel by personal vehicle. As shown in Table 1, of the 60.9% of vehicles used, 19.5% are vehicles greater than 10 years old, while 41.4% are relatively new vehicles (≤10 years old). However, of the 39.4% vehicles not used, percentages of old vehicles and new vehicles are almost identical. Besides vehicle age, there are many other factors that can affect vehicle usage, such as vehicle type, residential area type, and travel day.
Emerging new vehicle technologies offer opportunities to reduce the US transportation sector’s dependence on petroleum and possibly reduce greenhouse gas emissions. Prior experience with hybrid electric vehicle technology has shown that new technologies, such as PHEVs, will first be introduced in the passenger car [9]. Once the technologies are successfully introduced in passenger cars, they may be made available in other vehicle types. Analysis of the types of vehicles households use more frequently is needed to assist transportation analysts and decision makers. Knowing the vehicle usage by type, location, travel day, and population density would be helpful in estimating the benefits of new-technology vehicles in terms of the energy use and emission reductions associated with daily travel.
Many factors influence daily household vehicle usage; this study focuses on the following: vehicle type, vehicle age, travel day, residential location, and population density. Four vehicle types—car, van, SUV, and pickup— were selected. Vehicle age is divided into two groups: less than or equal to 10 years old (≤10 years) and greater than 10 years old (>10 years), while residential location is subdivided into metropolitan statistical area (MSA) and non-MSA. Population density in square kilometers includes five groups, ≤386, 387 - 1544, 1545 - 3860, 3861 - 9650, and >9650.
4. Identifying Unique Used/Non-Used Vehicle Records
The 2009 NHTS was conducted from March 2008 through May 2009. Information relating to sampled households, household members, vehicles owned, and travel during one day was collected. The survey was designed to collect travel data during a typical year and on all seven days of the week, including all holidays. The household sample consisted of a random national sample
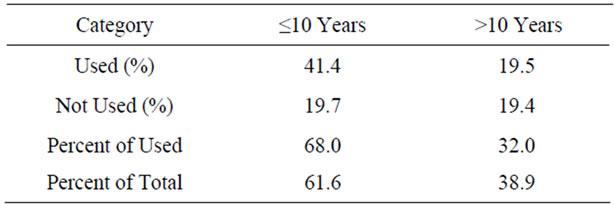
Table 1. Pattern of household vehicle usage.
and several add-on samples (comprising additional households in selected areas where local planning entities paid to have the sample size expanded). Care was taken to assign weights such that the final sample would provide estimates representative of the national population. The NHTS dataset contains data for 150,147 households that own 309,163 vehicles. Various files provide detailed data relating to households, persons, vehicles, and daily (travel day) trips. This study utilized travel day trip and vehicle files, which also contain data related to characteristics of households and household members. Vehicles in the travel day file are sampled for only one day, making it impossible to track the weekly, monthly, or seasonal behavior of any single vehicle.
In this analysis, vehicles with or without reported travel time and distance are considered “vehicles used”. All others are called “vehicles not used”. We subdivided the “vehicles not used” into three sets: 1) left at home; 2) used other modes; and 3) no trips. The first “vehicle not used” set represents vehicles that were left at home while residents drove other household vehicles. The second set, “used other modes”, represents the vehicles left at home while household members used other travel modes, such as public transit, carpooling, bicycle, walking, or traveling as passengers in someone else’s vehicle. The last set, “no trips”, represents vehicles left at home because the household members did not make any trips. Within the “vehicles used” group, vehicles were subdivided as “with travel data” and “without travel data”. The “without travel data” set represents vehicles that were used for travel, but because the respondents did not report travel distance or time, these vehicles are often excluded from travelrelated analysis. For these five usage sets, vehicles were further subdivided into four vehicle types: car, van, SUV, and pickup. Each vehicle type was further subdivided into two age groups: 10 years or less (≤10) and over 10 years (>10). Finally, the vehicle usage was compared by household location: MSA and non-MSA.
We first created three subsets of day trip file records based on the trip information: driver-set 1, driver-set 2, and other. Driver-set 1 includes the driver trip records with reported travel distance and time, while driver-set 2 includes driver trip records without travel distance and/or time. The driver trip means the survey responder is the driver of this particular trip. The other subset contains all the non-driver trips. Next, we created unique files out of the first two files containing one record by household identification code (HOUSEID) and vehicle number (VEHID). Because a household may report many daily trips with detailed information for the same vehicle but may not do so for some trips, a few vehicles ended up in both of the driver files. We deleted the duplicates in driver-set 1 and driver-set 2 so that vehicle numbers are not duplicated.
Figure 1 shows the procedures used to match the vehicle file with the three trip files to identify unique “used” or “non-used” vehicle records. First, we matched the vehicle file with a trip file driver-set 1, without any duplicate records, by HOUSEID and VEHID. The matched records are the vehicles used with reported travel data. Care was taken to separate the non-matched vehicle records. Next, the first non-matched vehicle file was further matched with driver-set 2 by HOUSEID and VEHID. The matched records for this step are the vehicles used without reported trip distance and/or time, while the non-matched file includes the vehicles not used. The non-matched file from these two steps was matched with the combined file (driver-set 1 and driver-set 2) by unique HOUSEID only; the matched records are the vehicles left at home while household members used other vehicles to travel. Next, the non-matched file generated in this step was matched with the other file by HOUSEID; the matched records are the vehicles owned by the household members who traveled by using other modes (e.g., public transit, bicycle). Finally, the non-matched file of the last step includes vehicles that were not used because the household members did not travel at all.
5. Identifying Patterns in Household Vehicle Usage Data Records
The total weighted number of vehicles included in the 2009 NHTS vehicle file is 211,501,318. Table 2 shows the percentage distribution by the five usage/non-usage categories. As the table shows, “left at home” is the largest “not used” vehicle group at 28.8%. All percentages were calculated by using weighted NHTS numbers.
Further examination of the age of the vehicles “left at home” was conducted; the distribution of vehicles ac-
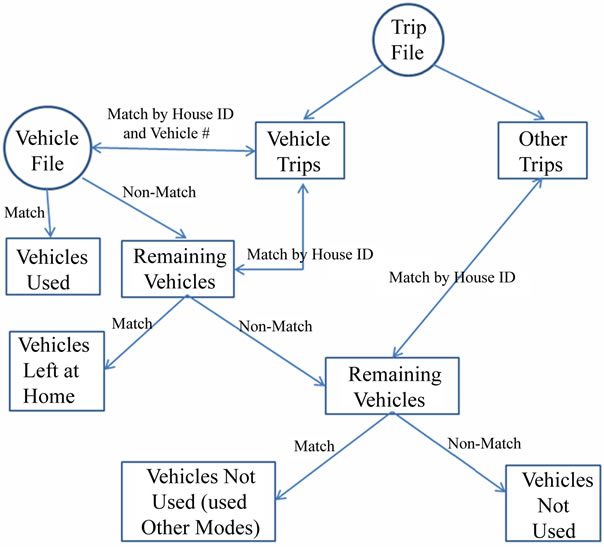
Figure 1. Procedures for vehicle usage identification.
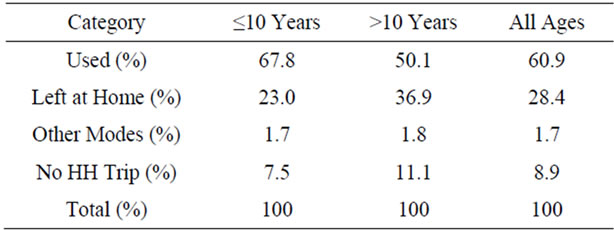
Table 2. Use and non-used household vehicles by vehicle age.
cording to the five categories within the two age groups is also shown in Table 2. We are not surprised to find that older vehicles (>10 years) are more likely to be “left at home” than newer vehicles (≤10 years). More importantly, the probability of use of a vehicle drops very sharply from 68% for the ≤10-year age group to 50% for the >10-year age group.
Vehicle age might not be the only reason that the vehicles were not used. For the same vehicle type within a similar age group, residential location might also affect vehicle usage. Therefore, the vehicle use/non-use pattern was analyzed by age group, vehicle type, and residential location type. The residential location was subdivided as in an MSA and in a non-MSA. Table 3 shows the resulting distribution; percentages of each location type add up to 100%. As shown in Table 3, the passenger car has the largest utilization rates, both in and out of an MSA, especially the newer cars (≤10 years). The usage rate drops more sharply from the ≤10 years to >10 years groups in an MSA. Newer (≤10 years) SUVs are more frequently used than older (>10 years) SUVs—almost triple the use rate for both MSA and non-MSA. No other vehicle type shows this kind of usage pattern. This is partly because SUVs have been the most rapidly growing class of vehicle.
Figure 2 shows vehicle use and non-use by vehicle and area type such that all percentages add up to 100%. Compared with those in non-MSAs, people in MSAs tend to own more newer (≤10 years) cars than other vehicle types. In rural areas, the difference between cars and other vehicle types is not that significant. SUVs are the second most common type of vehicle, far ahead of pickups in MSAs, although there are slightly fewer SUVs outside MSAs. Note that a significant percentage of pickups are left at home, especially the older ones. Cars constitute the most common type of vehicle: 105,595,553 of the 211,501,318 vehicles in the survey. As stated previously, SUVs are the second most prevalent vehicles at 41,116,312 units, pickups are third at 37,738,450, and vans are the least prevalent at 17,356,299. Considering that the total number of pickups is much lower than the number of cars in the survey, their share of vehicles “left at home” is surprisingly high. Pickups are clearly the most likely vehicle type to be “left at home” when other vehicle types are available for travel. There are more old (>10 years) pickups in rural areas; however, they are more likely to be among the vehicles “left at home”. This shows that people in rural areas find the load-carrying attributes of pickups valuable, but use them only when needed.
Although SUVs and vans have high usage rates, the total number of these two vehicle types is much smaller than the number of cars. Since the car is the most prevalent vehicle, more of them are used than any other vehicle class. However, the car is not the most used type of vehicle. We analyzed the pattern of use and non-use by individual vehicle type; the ≤10-year age group is shown graphically in Figure 3. The total usage percentage for each vehicle type adds up to 100%. Among the newer (≤10 years) vehicles, 71.4% of cars, 73.7% of SUVs, 57.7% of pickups, and 73.8% of vans are used. SUVs and vans are the most-used vehicle type with a usage rate of almost 74%, while the usage rate for pickups is the lowest. One possible reason for higher usage rates for vans and SUVs is that they may be used more frequently for carrying family members on weekends and vacations. Even so, the difference is not large.
The distribution of “used” and “not used” newer (≤10 years) vehicles inside and outside a MSA is shown in Table 4. Different from Figure 3, the sum of percentages for each area type (MSA or Non-MSA) adds up to 100%in Table 4. The overall use share for newer cars (Table 4 column total) is much higher in an MSA than in a non-MSA. Conversely, pickup trucks are used about half as much by MSA residents as non-MSA residents. MSA and non-MSA use shares of newer vans and SUVs are very similar.
Besides residential location, we also examined the vehicle usage pattern by population density, as shown in Figure 4. Population density per square kilometer was divided into five groups: ≤386, 387 - 1544, 1545 - 3860, 3861 - 9650, >9650. For newer vehicles (≤10 years old), the utilization rate of all vehicle types decreases as the density increases, as does ownership. SUVs, vans, and pickup trucks have higher shares of ownership by density category than cars only in areas with a population density of less than 386/km2. Pickup ownership in areas of less than 386/km2 is over 50% of total pickup truck ownership. Another finding to note is that more pickups are left at home than used for all of the population density groups, except in the highest-density areas.
Compared to the MSA vs. non-MSA breakdown, the relative probability of ownership of SUVs and minivans (share of total ownership of the type) appears to be greater than the relative probability of ownership of cars in the two lowest-density categories. Either way it is examined (Table 4 or Figure 4) the SUV is a strong second to the car, with its proportional share relative to cars
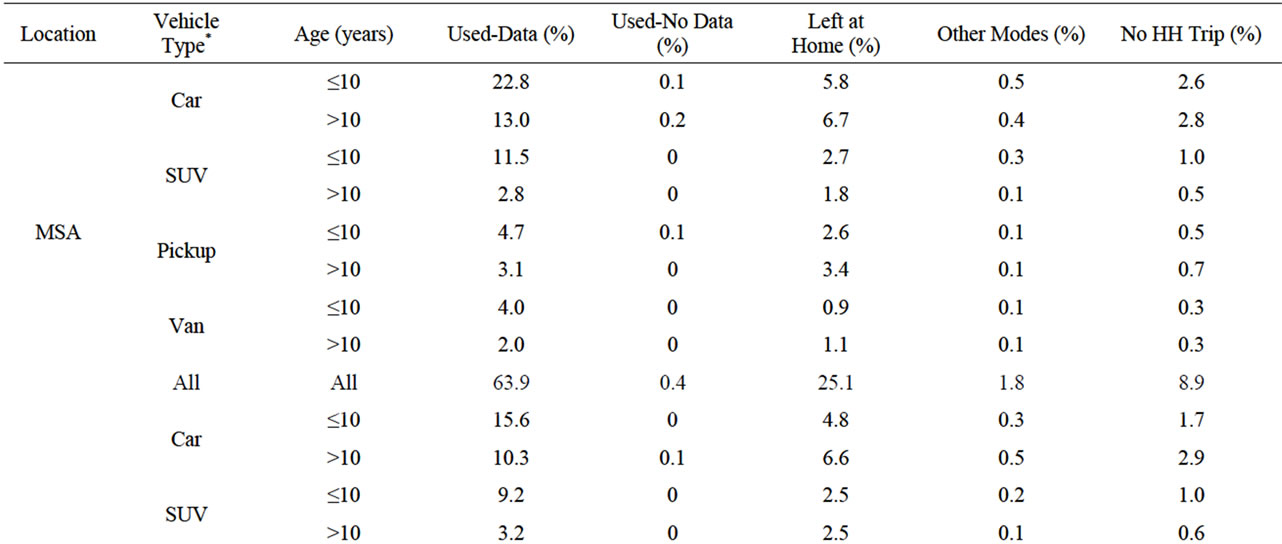
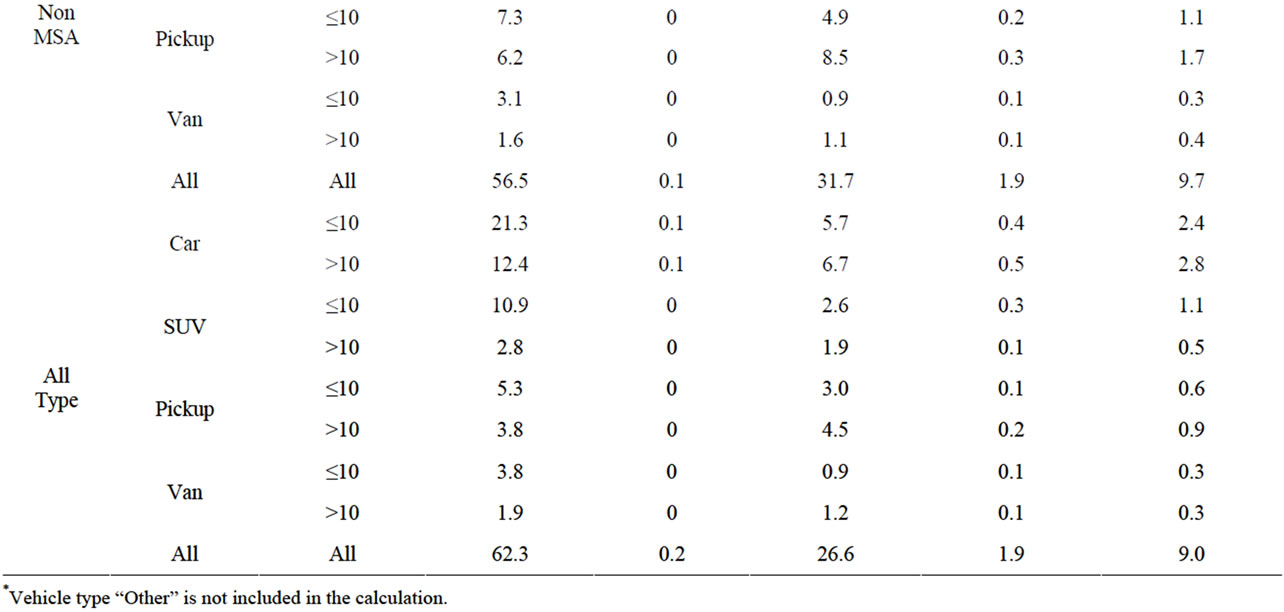
Table 3. Percentages use and non-use of household vehicles by vehicle age and type.
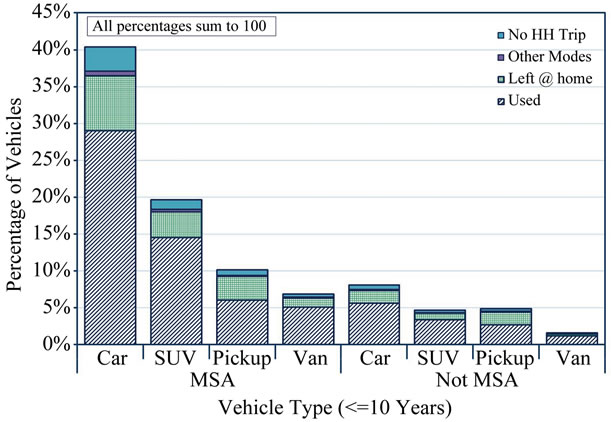
Figure 2. Use and non-use of household vehicles (≤10 years) by vehicle type in MSA and non-MSA.
Figure 3. Pattern of use and non-use of individual vehicle type (≤10 years).
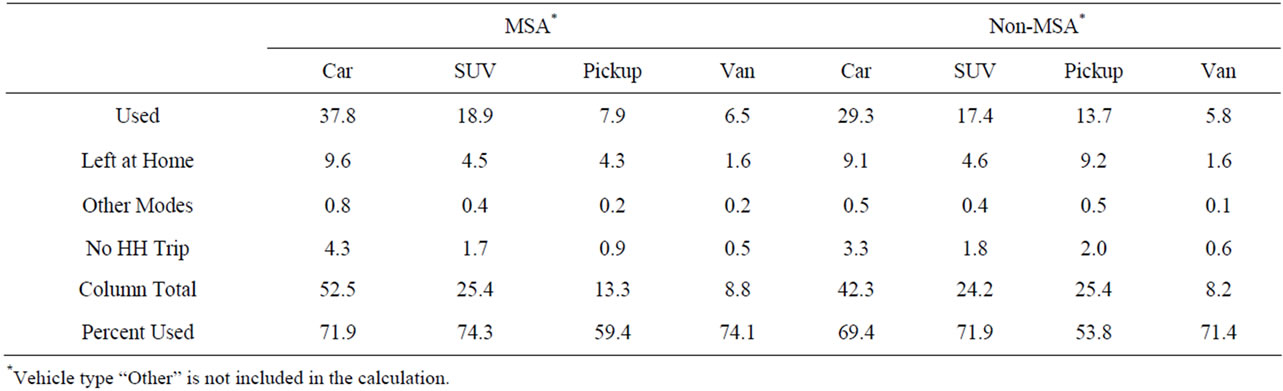
Table 4. Percentage use and non-use of ≤10-year-old vehicles by type and location.
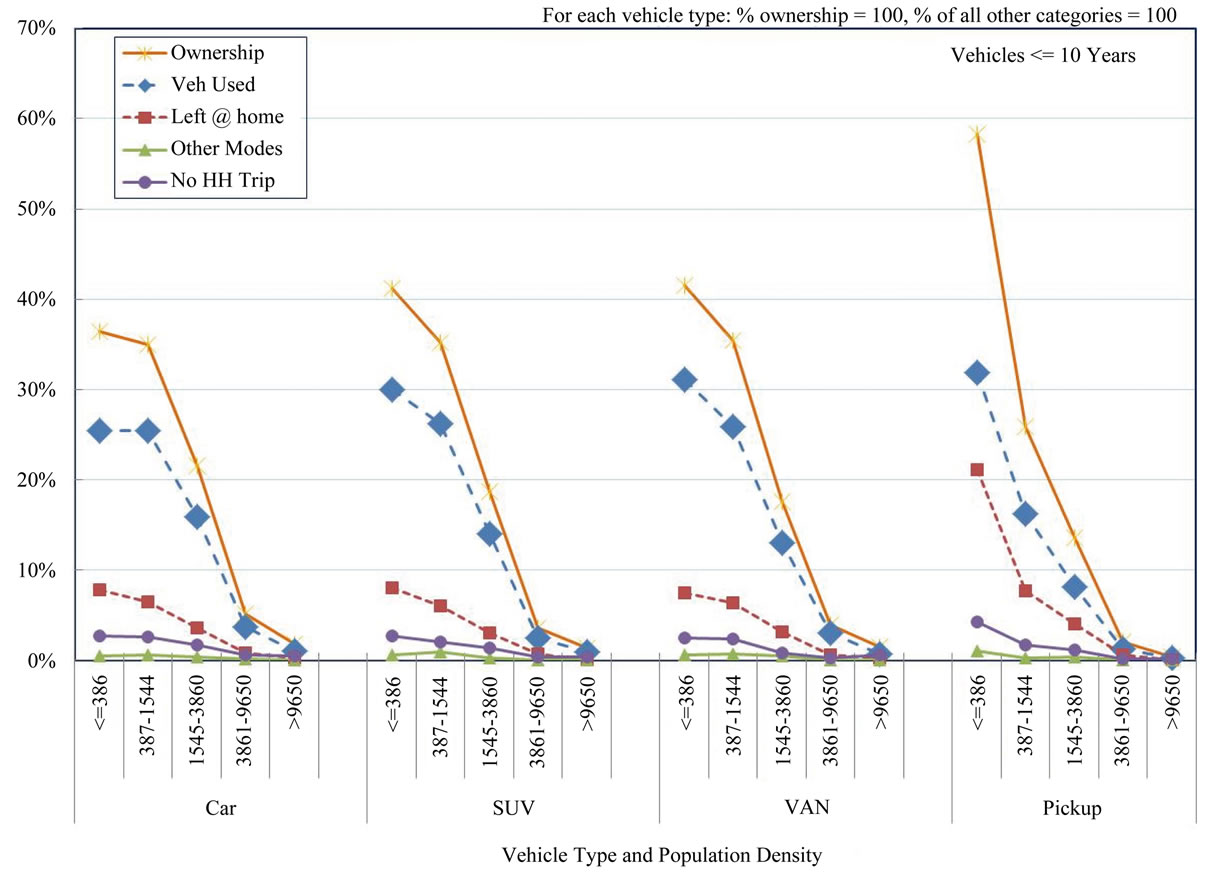
Figure 4. Vehicle usage pattern by population density.
much higher in non-MSAs and in the two lowest-density categories that we have chosen.
Earlier research done by the co-authors of this paper found that all upcoming electric-drive vehicles (including PHEVs) will be considerably more fiscally sound investments than conventional vehicles for vehicles driven more than 80 km/day at gasoline prices higher than $4/gallon [5]. Other authors have recently also reached the conclusion that high rates of vehicle use are necessary for the financial investment in PHEVs to pay off [10,11,12]. Figure 5 shows the regional vehicle use rates of newer vehicles (≤10 years old) for a daily travel distance of more than 80 km by type in areas with different population density. The percentages within each population density group sum to 100. The use share for cars increases monotonically with increasing population density and then drops when the density is over 9650/km2. Conversely, the share of SUV use first decreases when density increases, but it increases in the highest-density group. The shares of van use are the most stable across
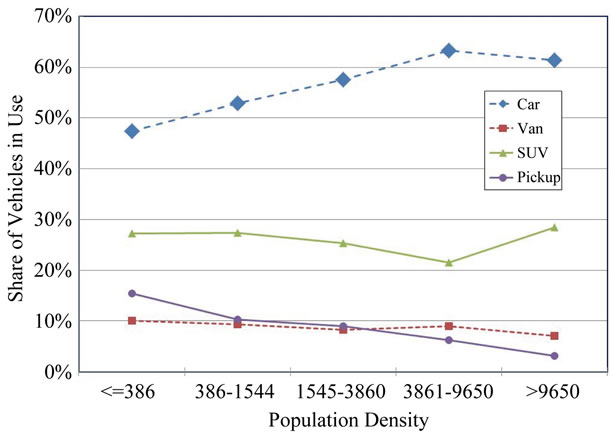
Figure 5. Vehicle (≤10 years old) usage by type and population density.
density categories.
As a result of the increase in share of SUVs in the highest population density category, we developed a behavioral hypothesis. We noted that there is a significant increase in the use of public transit only in this density category, which represents only a small share of US households. However, there are many cities in the world that have populations of this density. We wondered if the use pattern of vehicles might be significantly different in such places. Perhaps SUVs are purchased preferentially for this use pattern. Such thinking also led us to wonder if multiple-vehicle households that owned cars and SUVs might generally be more likely to use the SUV on the weekend, leaving the car parked.
To address these questions, we first examined the impact of travel day in terms of use/non-use on weekdays or weekends without location and population density factors. Although the direction of change for cars and SUVs was consistent with the general hypothesis, our analysis indicated that there is no statistically significant difference (through t-test) in vehicle use/non-use patterns between weekdays and weekends, for either new vehicles or old vehicles. Figure 6 shows the usage of newer (≤10 years) vehicles by vehicle type on weekdays and weekends. A similar trend was observed for older vehicles (>10 years).
However, when considering population density, noticeable differences were found between weekday and weekend usage pattern for all four types of vehicles. Because we think potential PHEV markets will first be for cars and SUVs. Figure 7 uses these two vehicle types as examples to demonstrate the used and non-used rates on weekends and weekdays by population density. More cars are used on weekdays than weekends among all of the population density groups. This is also true for SUVs, except for in dense urban areas. For the SUV, only 60% are used on weekdays in the highest-density category.
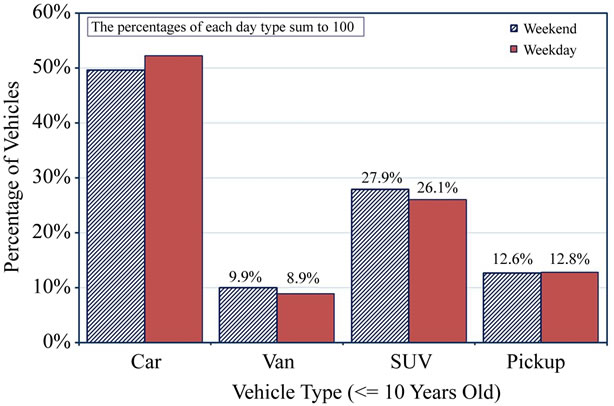
Figure 6. Vehicle usages by vehicle type on weekdays and weekend.
However, this category has a much higher SUV usage rate, about 80%, on weekends. This finding supports the hypothesis that many of the persons who purchase SUVs in dense urban areas intend to use them on the weekends, but much less during the week. Conversely, those who purchase cars consistently intend to use them during the week more frequently than on the weekend. Within the three lowest-density-use categories, the greater overall use rate of SUVs appears to be due to the greater probability that they will be used on the weekend than will cars. So, since consistent daily use is an important factor in the financial viability of PHEVs, the SUV is slightly favored over the car in this respect in the three lowerdensity areas, but not in very densely populated areas with public transit. For both cars and SUVs in the United States, the probability of daily use in the most densely populated zones is much lower than in the rest of the country. If this pattern is also prevalent elsewhere in the world, it has negative implications for cost-effective implementation of zero-emissions driving capability within the densest metro areas, where this feature is generally thought of as most desirable.
6. Conclusions
We analyzed 2009 NHTS data to more accurately predict usage rates for four major types of vehicles (cars, SUVs, vans, pickup trucks) that might adopt PHEV powertrains. To assist in investigating the types of vehicles in which the plug-in feature would be most utilized —in terms both of gross number of vehicles and rates of use per vehicle—we controlled for effects on use/nonuse pattern by vehicle type, vehicle age group, household location type (MSA vs. non-MSA), and travel day (weekday vs. weekend).
Study conclusions include the following:
• Most vehicles not used in the survey are “left at home” because household members own other vehicles or because multiple household drivers ride to-
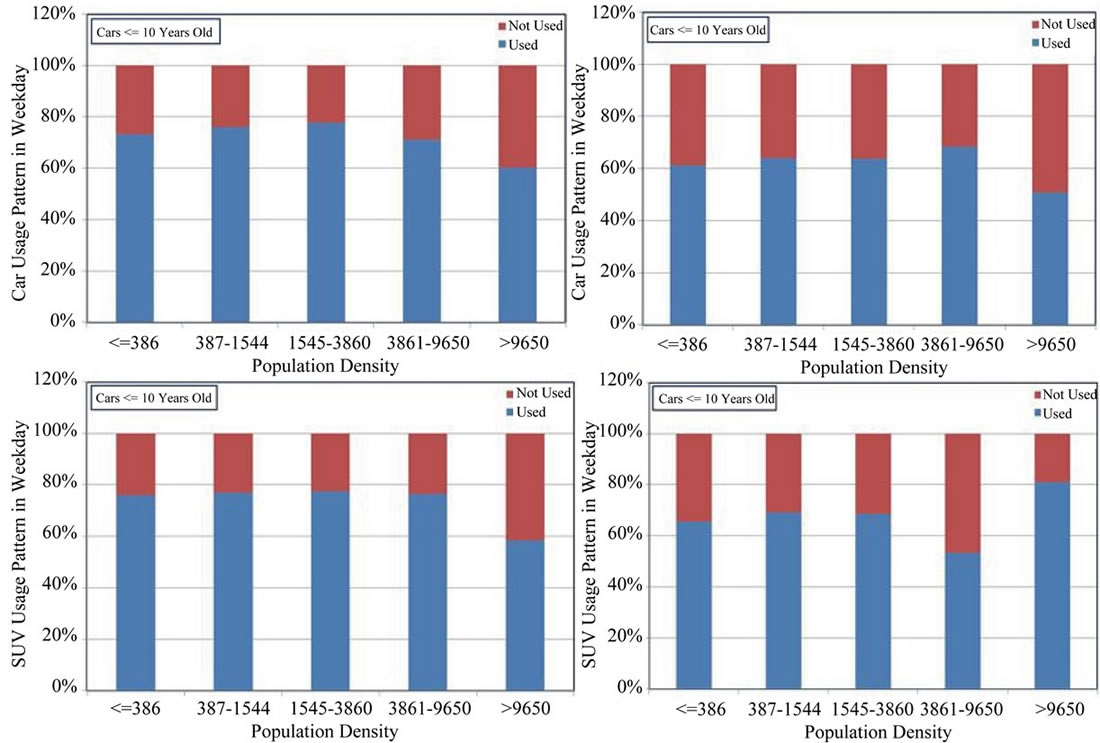
Figure 7. Car and SUV usage pattern on weekends and weekday.
gether and use another vehicle on a given day.
• Pickup trucks are most commonly an extra vehicle;
• Considering all four vehicle types together, the probability of use of a vehicle drops very sharply from 68% for the ≤10-year age set to 50% for the >10-year age set. For cars and SUVs in MSAs, the mean rates for the ≤10-year group are 72% and 74%, respectively, which are slightly higher than those in non-MSAs.
• For any of the four vehicle types, usage rates within MSAs are higher than those outside MSAs. By a slight margin over cars, SUVs and vans are the most frequently used vehicles.
• Cars, especially those ≤10 years in age, are the mostowned vehicle type, because of much higher ownership rates in MSAs.
• Pickup trucks are used much less intensively and last much longer. Their longer lifetime raises their share of the >10-year age group. Pickups are also far more likely to be “left at home” while household members use other vehicles to travel, particularly in rural areas. Thus, period required to pay off a battery pack is the longest for pickup trucks, and pickup trucks are the most likely vehicle type to outlast the calendar life of and warranty period for PHEV battery packs. Pickup truck longevity makes the odds of needing a battery replacement much higher than those of any other class of vehicle.
• Although vans, SUVs, and cars do not differ significantly in their usage rates, the size of the car market is the largest, followed by the SUV market, which significantly exceeds the size of the van market.
• Given the findings of this analysis, considering only probability of vehicle use each day, the greatest market potential for PHEVs lies in cars and SUVs in lowdensity areas of MSAs (i.e., suburbs). Interpreting the density results, at locations where high-rise multifamily residences result in high average population density (and the possible viability of public transit), the daily use rates of vehicles are much lower than elsewhere, reducing the probability of payback of battery packs through frequent charging.
• Since plug-in vehicles are relatively more economically attractive in MSAs, the small share of pickup trucks in MSAs shows that pickup trucks are a considerably smaller market than the more numerous cars and SUVs. Design priorities for pickups would logically carry a higher priority based on the operation characteristics outside of MSAs. Even when pickup trucks are found in MSAs, their rate of use is much less than that for other vehicle types.
• For vehicles <10 years old, SUVs in the three lowest population density categories are more consistently used over the full week than are cars. For these density categories, car use drops off more rapidly on weekends, presumably as some households owning both cars and SUVs shift to family use of SUVs on weekends.
• For both cars and SUVs in the United States, the probability of daily use in the most densely populated zones is much lower than that in the rest of the country. If this pattern is also prevalent elsewhere in the world, it has negative implications for cost-effective implementation of zero-emissions driving capability within the densest metro areas, where this feature is generally thought of as most desirable.
7. Acknowledgements
This work was supported by the Energy Storage Program of the Vehicle Technology Program of the Office of Energy Efficiency and Renewable Energy of the United States Department of Energy, under contract # DEAC 02-06CH11357. The authors gratefully acknowledge the sponsorship of David Howell, Team Leader, Hybrid and Electric Systems, Office of Vehicle Technology, US Department of Energy.
REFERENCES
- Federal Highway Administration, “2009 National Household Travel Survey,” US Department of Transportation, Washington DC. http://nhts.ornl.gov/download.shtml
- Energy Information Agency, Annual Energy Review, “Energy Information Administration,” US Department of Energy, Washington DC, 2011.
- S. C. Davis, S. W. Diegel and R. G. Boundy, “Transportation Energy Data Book,” 30th Edition, Oak Ridge National Laboratory, Oak Ridge, 2011.
- A. Elgowainy, J. Han, L. Poch, M. Wang, A. Vyas, M. Mahalik and A. Rousseau, “Well-to-Wheels Analysis of Energy Use and Greenhouse Gas Emissions of Plug-In Hybrid Electric Vehicles,” Center for Transportation Research, Argonne National Laboratory Report ANL/ESD/ 10-1. http://www.transportation.anl.gov/pdfs/TA/629.PDF
- D. J. Santini and A. D. Vyas, “Where Are the Market Niches for Electric Drive Passenger Cars?” Proceedings of the 90th Annual Meeting of the Transportation Research Board, Washington DC, 23-27 January 2011.
- A. D. Vyas, D. J. Santini, M. Duoba and M. Alexander, “Plug-In Hybrid Electric Vehicles: How Does One Determine Their Potential for Reducing US Oil Dependence?” Proceedings of the 23rd Electric Drive Vehicle Symposium (EVS 23), Anaheim, 2-5 December 2007.
- A. D. Vyas, D. J. Santini and L. R. Johnson, “Potential of Plug-In Hybrid Electric Vehicles to Reduce Petroleum Use: Issues Involved in Developing Reliable Estimates,” Transportation Research Record, 2009, pp. 55-63. doi:10.3141/2139-07
- A. Elgowainy, Y. Zhou, A. D. Vyas, M. Mahalik, D. Santini and M. Wang, “Impacts of Plug-In Hybrid Electric Vehicles Charging Choices in 2030,” Proceedings of the 91st Annual Meeting of the Transportation Research Board, Washington DC, 23-27 January 2012.
- A. Taylor III, “The Birth of the Prius,” Fortune, 2006. http://money.cnn.com/magazines/fortune/fortune_archive/2006/03/06/8370702/
- T. Stephens, J. Sullivan and G. A. Keoleian “A Microsimulation of Energy Demand and Greenhouse Gas Emissions from Plug-In Hybrid Electric Vehicle Use,” Proceedings of the Electric Vehicle Symposium, Los Angeles, 6-9 May 2010.
- P. Propfe, et al., “Cost Analysis of Plug-In Hybrid Electric Vehicles Including Maintenance & Repair Costs and Resale Values,” Proceedings of Electric Vehicle Symposium 26, Los Angeles, 2012.
- A. Rousseau, M. Badin, N. Redelbach, A. Kim, D. Da Costa, D. Santini, A. Vyas, F. Le Berr and H. Friedrich, “Comparison of Energy Consumption and Costs of Different HEVs and PHEVs in European and American Context,” European Electric Vehicle Congress, Brussels, 19-22 November 2012.