Agricultural Sciences
Vol. 3 No. 7 (2012) , Article ID: 24657 , 7 pages DOI:10.4236/as.2012.37113
Effect of weather patterns on preweaning growth of beef calves in the Northern Great Plains
![]()
USDA, Agricultural Research Service1, Fort Keogh Livestock and Range Research Laboratory, Miles City, USA; *Corresponding Author: Hmacneil.deltag@gmail.com
Received 14 September 2012; revised 21 October 2012; accepted 3 November 2012
Keywords: Beef Calves; Climate Change; Growth; Precipitation; Temperature
ABSTRACT
Records from a 76-year investigation into effects of line breeding and selection of Hereford cattle, and concurrent weather records, were used to assess effects of weather patterns on growth of suckling calves. Calf growth data were adjusted for trends arising from selection and inbreeding, and for effects of age of dam and sex of calf to produce clean estimates of year effects. Daily maximum and minimum temperatures were summarized to identify first and last days of a 1500 growing degree growing season. Precipitation was accumulated from: 1) end of the growing season the previous year through 31 December; 2) 1 January through the beginning of the current year growing season; and 3) during the current growing season. Principal components were used to characterize years. Preweaning growth of the calves in sets of eight extreme years identified by each of the principal component was contrasted. Irrespective of precipitation pattern before the growing season and with near or above average precipitation during the growing season, calves reared in years characterized by longer, cooler growing seasons grew faster from birth to weaning than in opposing years. This retrospective analysis indicates a general increase in temperature could decrease growth of suckling calves on the Northern Great Plains of North America.
1. INTRODUCTION
Several studies have investigated effects of beef production on greenhouse gas emissions and consequent climate change (e.g. [1-3]). It is suggested the cow-calf segment of beef production accounts for approximately 80% of greenhouse gas emissions in North American temperate zone production systems [2]. Here we turn the question around—how might climate change affect cowcalf production? Climate shifts might affect productivity of ruminant livestock through direct effects on the animals and through a myriad of indirect effects both to the plant community and to the animal through the incidence of livestock pests and disease [4]. Several factors with implications for net primary production have been predicted by climate models, which in turn might influence livestock productivity. In general, drought conditions reduce quantity and quality of forage produced and consumed resulting in decreased livestock production [5,6]. Elevation of atmospheric CO2 concentration is often presumed in climate change predictions. Increased CO2 increases plant biomass, but reduces nitrogen content and digestibility, increasing the time that forage would be of insufficient quality for cattle growth [7]. However within regions, the crude protein content (an indicator of quality) of grazed forages has been found to decrease with increasing temperatures during the growing season while responses to changes in precipitation have been mixed [8]. Warming has increased early spring and fall plant productivity, but total production was negatively correlated with soil temperature during the middle of the growing season [9]. Simulation has also been used to assess effects of climate change and predicts improved livestock productivity in northern latitudes resulting from increased quantity and quality of primary production resulting from increases in both temperature and precipitation [10,11]. Alternatively, simulations based on three general circulation models indicated lighter cow and calf weights at weaning and lower average daily gains driven by reduced forage quality on short grass prairie [12]. With these discrepancies in mind, this retrospective analysis relates environmental trend in calf gain during the suckling period to annual weather patterns over a 76 year period (1935-2011).
2. MATERIALS AND METHODS
The Line 1 Hereford population [13,14], maintained as a closed herd, at Fort Keogh Livestock and Range Research Laboratory near Miles City, Montana (Figure 1) was used in this research. Regional topography varies from rolling hills to broken badlands with small, intersecting ephemeral streams flowing into rivers in broad, nearly level valleys. This area is representative of the semiarid, mixed-grass prairie of the Northern Great Plains. Indigenous vegetation on the 22 500-ha research station is a grama-needlegrass-wheatgrass (BoutelouaStipa-Agropyron) mix [15]. Elevation at Fort Keogh is approximately 720 m. Average annual temperature is 7.8˚C, with daily extremes from –40˚C to 43˚C. Average monthly temperatures are greatest during July and least during January (Figure 2(a)). Average annual precipitation is 341 mm, with 75% occurring during the AprilSeptember growing season (Figure 2(b)). Management of Line 1 has remained relatively constant from 1935 to present. Cows grazed native range throughout the year. Each year they were moved to winter pasture approximately 1 January. Varying amounts of energy and protein supplement were fed and hay was provided when excessive snow depth prevented normal winter grazing. Cows were placed in calving pastures in mid-March. Calving heifers at 2 yr of age was initiated in 1977. Heifers have calved in lots of about 8 ha since that time. Since 1989, cows calved with the heifers and were given hay during the calving period. Cow-calf pairs were moved to native range spring pasture a few days after birth. Cow-calf
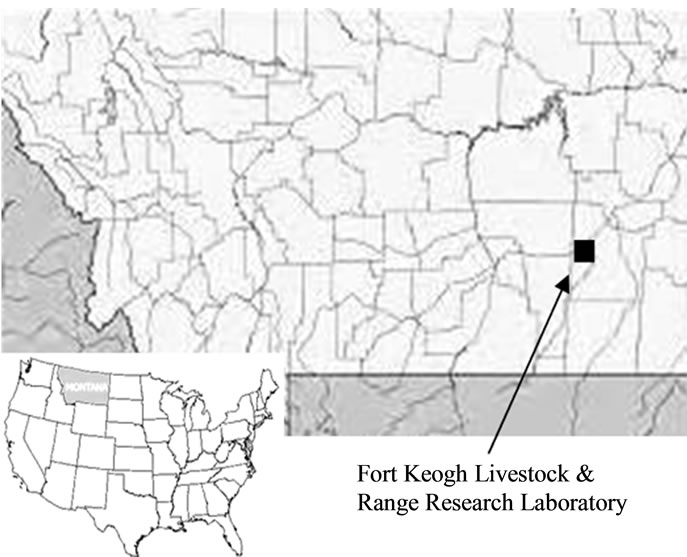
Figure 1. Map locating Montana (shaded) within the United States and Fort Keogh Livestock and Range Research Laboratory within Montana.

Figure 2. Means and standard deviations of monthly temperature (a) and precipitation (b) for Fort Keogh Livestock and Range Research Laboratory.
pairs were moved from spring pastures to breeding pastures about 1 June. A 45- to 60-d breeding season began about 1 July through 1945, about 15 June through 1992, and 2 June through the present. After the breeding season, cows and their calves were moved to rangeland summer pastures. Up to the late 1950s cows and their calves were gathered on approximately 1 September of each year and bull calves found lacking in structural soundness, breed character, or growth potential were castrated at that time. Subsequently, all male calves were kept intact. Since the mid 1970s, calves have received preweaning vaccinetions for stress-induced diseases at the late summer working. Calves were weaned during October at an average age of 180 d.
Gain from birth to weaning of the Line 1 Hereford calves was analyzed using a derivative free maximum likelihood for animal models [16]. The linear model for gain from birth to weaning was:
where Y = an observation of preweaning gain (kg) linearly pre-adjusted to a constant age at weaning of 180 d for the lth calf out of the kth dam; and μ = a constant applicable to all observations; Yri = year in which the record of preweaning gain was observed; SAj = joint classification of sex of calf (bull or heifer) and age of dam with age of dam recoded as 2, 3, 4, and 5 + yr; b1 = the linear regression on inbreeding of calf (Fx = 0 to 1.0); b2 = the linear regression on inbreeding of dam (Fd = 0 to 1.0); aijkl = a direct genetic effect of the calf; uijkl = a maternal genetic effect of the calf; c = a permanent environmental effect due to the dam; and e = temporary environmental effect associated with each observation.
2.1. Inter-Annual Effects
Daily maximum (Tmax) and minimum (Tmin) temperatures and precipitation at Miles City, Montana, USA (46.4˚N, 105.8˚W) were obtained from the National Oceanic and Atmospheric Administration, National Weather Service database (http://www4.ncdc.noaa.gov/Hcgiwin/wwcgi.dll?wwDI~StnSrch~StnID~200 12408). A day defining the beginning of the growing season (D0) was identified as the last day in spring when Tmax/|Tmin| > 5 when Tmax > 0˚C and Tmin < 0˚C. This calculation assumes linearity of the ordered temperature distribution over the 24h period and identifies the day with temperatures < 0˚C for 4 or less hours. Subsequent to this day, growing degrees (5.5˚ base) were accumulated until the day when the total reached 1500. This value is approximately consistent with heat units required for C3 crops [17] and the northern mixed grass prairie [18,19] to reach maturity. Here, this day defined the end of the growing season (De). Based on these days, precipitation was accumulated from the end of the growing season the previous year through 31 December (fall precipitation, P1) from 1 January to the beginning of the growing season (spring precipitation, P2) and through the growing season (P3). To understand the inter-year variation in weather pattern, principal components were calculated for the data vector D0, De, P1, P2, and P3. Contrasts of the year effects from the analysis of gain from birth to weaning were calculated for sets of 8 years with extreme principal component scores. For reference, “typical” years were taken to be those 8 years with minimum sums of squares of the scores across the set of 5 principal components (i.e., those nearest the centroid of the 5-dimension space defined by D0, De, P1, P2, and P3).
2.2. Intra-Annual Effects
Critical periods in which weather patterns affected weight gain of bison have been empirically identified using forward stepwise regression [20]. A modified version of this approach was also employed with these data. The year, beginning 1 September, was divided into overlapping 15-day windows that began every 5 days. Each window was characterized by total precipitation and mean temperature. Thus, a year was characterized by 73 pairs of precipitation and temperature observations. The year effects from the analysis of gain from birth to weaning were regressed on the set of 146 annual weather observations using forward selection of variables to be included in the stepwise regression model. Nominal significance to enter the model was set at P = 0.05. The significance level for a variable to remain in the final model derived by Bonferroni correction of the nominal significance level (P = 0.05) for multiple testing and was set at P = 0.0035.
3. RESULTS AND DISCUSSION
The data used for these analyses are unique. All records of calf growth come from a single closed and pedigree-recorded population which has been maintained by USDA Agricultural Research Service at Miles City, Montana throughout its history. Use of genetic relationships derived from the pedigree in the analysis accounts for genetic trend over time as a result of selection applied [13]. Accumulated effects of inbreeding were accounted for by also including appropriate covariates in the linear model.
The typical growing season began on 20 April (±1 day) and ended on 13 August (±1 day). Precipitation during the growing season averaged 186 ± 8 mm, with an additional 61 ± 3 mm and 90 ± 6 mm during the preceding spring and fall, respectively. Earliest and latest first days of the growing season were 12 March 1939 and 13 May 1967, respectively. Earliest and latest end of the growing season occurred on 22 July 1936 and 4 September 1950. Growing seasons of least and greatest durations occurred in 1988 (95 d) and 1939 (142 d), respectively. Least and greatest amounts of fall precipitation occurred during the years prior to the growing seasons of 1965 (8 mm) and 1972 (271 mm). Least and greatest amounts of precipitation prior to the growing season occurred in 2004 (10 mm) and 1967 (171 mm). Finally, precipitation received during the growing season was least in 1988 (33 mm) and greatest in 1944 (382 mm). Median annual precipitation was 316 mm and ranged from 127 mm (1988) to 655 mm (1972).
Eigenvectors for the principal components describing the observed variation in annual weather pattern and proportion of variation accounted for by each principal component are shown in Table 1. The corresponding weather patterns for the pairs of 8 extreme years identified by each of the five principal components are shown in Table 2. The first principal component, explaining 44% of the variation in weather pattern, contrasts dryer vs wetter springs and growing seasons with the growing

Table 1. Eigenvectors characterizing variation in weather patterns across years and the proportion of variation explained by each.
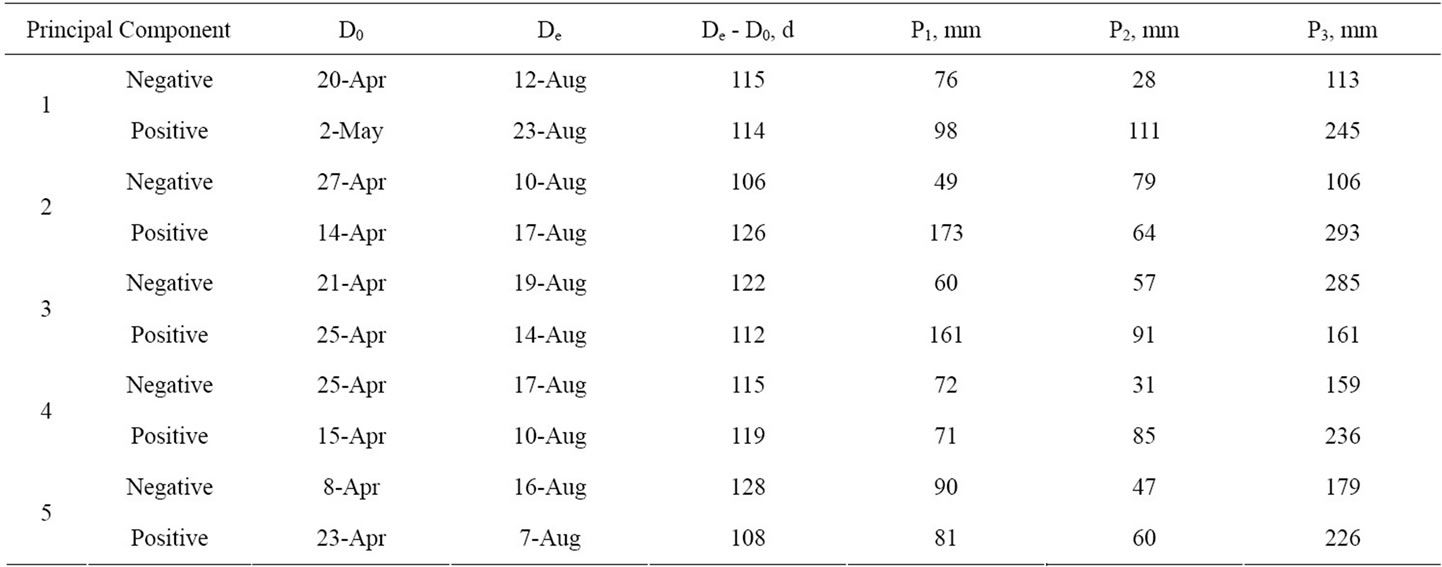
Table 2. Characterization of weather patterns in years having extreme values for principal components derived from dates of beginning (D0) and end (De) of the growing season and precipitation received during the growing season (P3), and during the preceding spring (P2) and fall (P1).
seasons being of approximately equal duration but beginning earlier vs. later in the year. Thus, temperatures during the growing season were similar across years. The second principal component, explaining an additional 26% of the variation in weather pattern, contrasts growing seasons that began later, ended earlier, and had less precipitation during the preceding fall and the growing season vs growing seasons that began earlier, ended later and were preceded by greater precipitation in fall and during the growing season. Thus, this contrast may be interpreted as comparing relatively warm dry years with cool wet years. These first two principal components satisfy the commonly used Kaiser’s rule [21] for reliability and meaningfulness by having eigenvalues greater than 1.0. The third principal component explained an additional 15% of variation in weather patterns across years. Lower values of the third principal component were associated with relatively lesser amounts of precipitation during the preceding fall and spring and more abundant precipitation during the growing season compared to years with greater values. It also contrasted years in which the growing season was extended by approximately 5 days on each end and hence represents cooler compared to warmer years. Compared to the average, years with negative responses had a dry fall, average spring, and wet growing season; whereas positive responses were associated with a wet fall and spring, and near-average growing season precipitation. The fourth principal component explained an additional 10% of the variation among years and contrasted later growing seasons and less precipitation both during the growing season and in the preceding spring with earlier growing seasons and greater precipitation during spring and summer. The remaining 5% of variation among years was explained by a principal component with low values that characterized years in which the growing season began early and ended late and were therefore cooler than the contrasting years. Differences in precipitation patterns among the contrasted years were relatively minor with greater spring and growing season precipitation being associated with greater values of the principal component.
Contrasts of preweaning growth in years characterizeing the extremes of the first and fourth principal components were not significant (P > 0.2). Calves reared in years at the positive tail of the second principal component grew 15.8 ± 2.3 kg more during the preweaning period (P < 0.001) than those reared in opposing years. Calves reared in years at the negative tails of the third and fifth principal components grew 4.7 ± 1.6 and 11.0 ± 3.7 kg more during the preweaning period than their counterparts reared in years at the opposing extreme. Thus, in this retrospective analysis, a longer time to accumulate 1500 growing degrees, and hence a cooler growing season, was consistently favorable for increased growth of calves. In each case, precipitation during the growing season was also at least 96% of average. Precipitation is commonly regarded as the main factor driving net primary productivity whereas temperature typically affects plant development and forage quality [18, 19]. With the onset of spring occurring earlier across the northern hemisphere, leaf and bloom development was found to also occur earlier [22]. Although earlier phonological development of plants would suggest earlier maturity and loss of forage quality, it is important to note that the years in all three principal components with greater weaning weights had earlier springs, but still took longer to accumulate growing degrees. Similar conditions have been shown to increase probability of conception and allow for earlier age at first calving in red deer (Cervuselaphus), which the researchers attributed to delayed plant maturity [23].
Yearling steers attained their maximum weight at some point during the first two weeks of August with seasonlong grazing in near-average years at Fort Keogh [24]. Plants have generally senesced and are rapidly losing forage quality during this period in the northern Great Plains. However, suckling calves are at least somewhat buffered from climatic effects on forage production due to the ability of their dams to mobilize body tissues in support of milk production [25,26]. Decreased growth of the calves might result from reduced milk production through decreased dietary energy consumption by their dams or greater environmental temperature per se, or might be due to reduced quantity and quality of forage consumed directly by the calves to supplement the milk provide by their dams. The causative agent cannot be ascertained from these data. Additionally, principal components two and three have marked differences in precipitation prior to the growing season, with less precipitation during this period being identified as the favorable condition for subsequent growth of the calf. During the early part of this period, the calf is yet to be born, with parturition occurring approximately midway through the period.
Two critical weather periods were identified empirically as affecting gain from birth to weaning. The first was precipitation during the period from 8 February to 22 February, in which each additional cm of precipitation was predicted to reduce gain by 6.03 ± 1.75 kg. Given the observed temperatures during this period (mean = –5.2˚C), the precipitation was almost certainly snow causing cows to be wet and thereby increasing their lower critical temperature. During this period the affected calf was in late gestation. Effects on postnatal growth of the calves may potentially have resulted either from thermal stress that affected their dams’ energy reserves and compromised subsequent milk production [27,28], or through uterine programming [29,30]. The second critical weather period was defined by temperature from 23 June to 7 July. During this period, a 1˚C increase in temperature reduced growth from birth to weaning by 1.51 ± 0.27 kg. About 90% of annual primary productivity for this region has typically occurred by 1 July [31]. Therefore, it is unlikely temperature is affecting calf growth through forage quantity. Increasing temperature has been shown to reduce forage quality by speeding the rate of senescence and reducing forage digestibility and nitrogen content [8,18,19,32].
As would be expected, results from both analyses are mutually supportive. The fairly course summary of weather data used in the principal components analysis was biologically motivated based on an understanding of factors affecting plant growth, but lacked fine scale resolution in time. The empirical regression analysis provided for increased fine scale resolution, but introduced potential over-parameterization of the model and collinearity.
The present result appears contradictory to those obtained prospectively by simulation [10,11], but congruent with independent data-driven investigations [8,20]. It is important to point out that the current analyses do not consider succession in the plant community as might be expected to result from long-term climate change; nor do the other studies. Although some have predicted greater productivity with increased temperature and CO2 [12,33], a shift to C4 dominance in northern semiarid mixed prairie would likely reduce productivity as C3 midgrasses were replaced by C4 shortgrasses [31]. Doubling the summer water following spring drought increased C4 productivity, but reduced total productivity to half of what is typical due to reduced C3 production [34].
Simulation exercises typically do not consider climatic adaptation of cattle, but models are parameterized for local-specific climatic conditions. Results of these exercises and the biological investigation reported herein are strictly speaking location-specific. Further, the Hereford breed originated in and around Herefordshire, Englandand part of the stock may have come from The Netherlands [35]. These origins, extensive migration of germplasm across North America, and lack of selection pressure and low heritability of environmental adaptability [36] all suggest the contemporary Hereford is a breed that would be best adapted to a moist temperate climate. Results for other breeds that are adapted differently or from other locations with different vegetative resources may differ.
4. CONCLUSION
A general increase in temperature during the vegetative growing season that corresponds with the suckling period could decrease growth of calves from birth to weaning on the Northern Great Plains of North America. Results also were suggestive of potential for precipitation during late gestation to cause thermal stress on cows with downstream effects on progeny performance during the sucking period.
5. ACKNOWLEDGEMENTS
The first author thanks R. K. Heitschmidt for valuable discussion of this line of investigation. We are grateful to V. R. Leesberg assistance in preparation of data files for analysis and to J. M. Craine (Kansas State University) for critical comments on an early version of this paper.
![]()
![]()
REFERENCES
- Subak, S. (1999) Global environmental costs of beef production. Ecological Economics, 30, 79-91. Hdoi:10.1016/S0921-8009(98)00100-1
- Beauchemin, K.A., Janzen, H.H., Little, S.M., McAllister, T.A. and McGinn, S.M. (2010) Life cycle assessment of greenhouse gas emissions from beef production in western Canada: A case study. Agricultural Systems, 103, 371- 379. Hdoi:10.1016/j.agsy.2010.03.008
- Crosson, P., Shalloo, L., O’Brien, D., Lanigan, G.J., Foley, P.A., Boland, T.M. and Kenny, D.A. (2011) A review of whole farm systems models of greenhouse gas emissions from beef and dairy cattle production systems. Animal Feed Science Technology, 166, 29-45. Hdoi:10.1016/j.anifeedsci.2011.04.001
- Harle, K.J., Howden, S.M., Hunt, L.P. and Dunlop, M. (2007) The potential impact of climate change on the Australian wool industry by 2030. Agricultural Systems, 93, 61-89. Hdoi:10.1016/j.agsy.2006.04.003
- Weltzin, J.F. and McPherson, G.R. (2003) Changing precipitation regimes and terrestrial ecosystems: A North American perspective. University of Arizona Press, Tucson.
- Heitschmidt, R.K. and Vermeire, L.T. (2006) Can abundant summer precipitation counter losses in herbage production caused by spring drought? Rangeland Ecology and Management, 59, 392-399. Hdoi:10.2111/05-164R2.1
- Milchunas, D.G., Mosier, A.R., Morgan, J.A., LeCain, D.R., King, J.Y. and Nelson, J.A. (2005) Agriculture, Ecosystems and Environment, 111, 166-184. Hdoi:10.1016/j.agee.2005.06.014
- Craine, J.M., Elmore, A.J., Olson and K.C., Tolleson D. (2010) Climate change and cattle nutritional stress. Global Change Biology, 16, 2901-2911. Hdoi:10.1111/j.1365-2486.2009.02060.x
- Wan, S., Hui, D., Wallace, L. and Luo, Y. (2005) Direct and indirect effects of experimental warming on ecosystem carbon processes in a tallgrass prairie. Global Biogeochemistry Cycles, 19, GB2014,
- Baker, B.B., Hanson, J.D., Bourdon, R.M. and Eckert, J.B. (1993) The potential effects of climate change on ecosystem process and cattle production on US rangelands. Climate Change, 25, 97-117. Hdoi:10.1007/BF01661200
- Bolorsetseg, B. and Tuvaavsuren, G. (1996) The potential impacts of climate change on pasture and cattle production in Mongolia. Water, Air, and Soil Pollution, 92, 95- 105.
- Hanson, J.D., Baker, B.B. and Bourdon, R.M. (1993) Comparison of the effects of different climate change scenarios on rangeland livestock production. Agricultural Systems, 41, 487-502. Hdoi:10.1016/0308-521X(93)90047-6
- MacNeil, M.D. (2009) Invited review: Research contributions from seventy-five years of breeding Line 1 Hereford cattle at Miles City, Montana. Journal of Animal Science, 87, 2489-2501. Hdoi:10.2527/jas.2009-1909
- MacNeil, M.D., Urick, J.J., Newman, S. and Knapp, B.W. (1992) Selection for postweaning growth in inbred Hereford cattle: The Fort Keogh, Montana Line 1 example. Journal of Animal Science, 70, 723-733.
- Küchler, A. (1964) Potential natural vegetation of the coterminous United States. Special Publ. 36, American Geographic Society, New York.
- Boldman, K.G., Kriese, L.A., Van Vleck, L.D., Van Tassell, C.P. and Kachman, S.D. (1995) A manual for use of MTDFREML. A set of programs to obtain estimates of variance and covariances [Draft]. USDA-ARS, Clay Center.
- Miller, P., Lanier, W. and Brandt, S. (2001) Using growing degree days to predict plant stages. Montguide MT200103 AG 7/2001. Cooperative Extension Service, Montana State University, Bozeman.
- Frank, A.B. and Hofmann, L. (1989) Relationship among grazing management, growing degree days, and morphological development for native grasses on the Northern Great Plains. Journal of Range Management, 42, 199- 202. Hdoi:10.2307/3899472
- Haferkamp, M.R., MacNeil, M.D. and Grings, E.E. (2005) Nitrogen content in the northern mixed-grass prairie. Rangeland Ecology and Management, 58, 155-160. Hdoi:10.2111/04-01.1
- Craine, J.M., Towne, E.G., Joern, A. and Hamilton, R.G. (2009) Consequences of climate variability for the performance of bison in tallgrass prairie. Global Change Biology, 15, 772-779. Hdoi:10.1111/j.1365-2486.2008.01769.x
- Kaiser, H.F. (1960) The application of electronic computers to factor analysis. Educational and Psychological Measurement, 20, 141-151. Hdoi:10.1177/001316446002000116
- Schwartz, M.D., Ahas, R. and Aasa, A. (2006) Onset of spring starting earlier across the Northern Hemisphere. Global Change Biology, 12, 343-351. Hdoi:10.1111/j.1365-2486.2005.01097.x
- Langvatn, R., Albon, S.D., Burkey, T. and Clutton-Brock, T.H. (1996) Climate, plant phenology and variation in age of first reproduction in a temperate herbivore. Journal of Animal Ecology, 65, 653-670. Hdoi:10.2307/5744
- Currie, P.O., Volesky, J.D., Adams, D.C. and Knapp, B.W. (1989) Growth patterns of yearling steers determined from daily live weights. Journal of Range Management, 42, 393-396. Hdoi:10.2307/3899546
- Bauman, D.E. and Currie, W.B. (1980) Partitioning of nutrients during pregnancy and lactation: A review of mechanisms involving homeostatis and homeorhesis. Journal of Dairy Science, 63, 1514-1529. Hdoi:10.3168/jds.S0022-0302(80)83111-0
- Freetly, H.C., Nienaber, J.A. and Brown-Brandl, T. (2006) Partitioning of energy during lactation of primiparous beef cows. Journal of Animal Science, 84, 2157-2162. Hdoi:10.2527/jas.2005-534
- Tarr, B. (2007) Cold stress in cows. Factsheet #420/51, Ontario Ministry Agriculture, Food and Rural Affairs. Hhttp://www.omafra.gov.on.ca/english/livestock/beef/facts/07-001.htmH
- Wiltbank, J.N, Bowden, D.W., Ingalls, J.E., Gregory, K.E. and Koch, R.M. (1962) Effect of energy level on reproductive phenomena of mature Hereford cows. Journal of Animal Science, 21, 219-225.
- Franko, K.L., Forhead, A.J. and Fowden, A.L. (2010) Differential effects of prenatal stress on glucocorticoid administration on postnatal growth and glucose metabolism in rats. Journal of Endocrinology, 204, 319-329. Hdoi:10.1677/JOE-09-0390
- Fowden, A.L., Forhead, A.J., Coan, P.M. and Burton, G.J. (2008) The placenta and intrauterine programming. Journal of Neuroendocrinology, 20, 439-450. Hdoi:10.1111/j.1365-2826.2008.01663.x
- Vermeire, L.T., Heitschmidt, R.K. and Rinella, M.J. (2009) Primary productivity and precipitation-use efficiency in mixed-grass prairie: A comparison of northern and southern US sites. Rangeland Ecology and Management, 62, 230-239. Hdoi:10.2111/07-140R2.1
- Izaurralde, R.C., Thomson, A.M., Morgan, J.A., Fay, P.A., Polley, H.W. and Hatfield, J.L. (2011) Climate impacts on agriculture: Implications for forage and rangeland production. Agronomy Journal, 103, 371-381.
- Campbell, B.D. and Stafford Smith, D.M. (2000) A synthesis of recent global change research on pasture and rangeland production: Reduced uncertainties and their management implications. Agriculture, Ecosystems and Environment, 82, 39-55. Hdoi:10.1016/S0167-8809(00)00215-2
- Heitschmidt, R.K. and Vermeire, L.T. (2005) An ecological and economic risk avoidance drought management decision support system. In: Milne, J.A., Ed., Pastoral Systems in Marginal Environments. Proceedings of a satellite workshop of the 20th International Grasslands Congress, Glasgow, 178, Wageningen Academic Publishing, Wageningen.
- Willham, O.S. (1937) A genetic history of Hereford cattle in the United States. Journal of Heredity, 28, 283-294.
- Burrow, H.M. (2001) Variances and covariances between productive and adaptive traits and temperament in a composite breed of tropical beef cattle. Livestock Production Science, 70, 213-233. Hdoi:10.1016/S0301-6226(01)00178-6
NOTES
1USDA, ARS, Northern Plains Area, is an equal opportunity/affirmative action employer. All agency services are available without discrimination. Mention of a proprietary product does not constitute a guarantee or warranty of the product by USDA or the authors and does not imply its approval to the exclusion of other products that may also be suitable.