Agricultural Sciences
Vol.3 No.2(2012), Article ID:18383,7 pages DOI:10.4236/as.2012.32023
US red meat production from foreign-born animals*
![]()
US Department of Agriculture, Economic Research Service, Washington DC, USA; #Corresponding Author: KJones@ers.usda.gov
Received 4 December 2011; revised 30 January 2012; accepted 10 February 2012
Keywords: Beef; Livestock; Pork; Trade
ABSTRACT
The North American Free Trade Agreement (NAFTA) propelled the integration of livestock markets among the United States, Mexico, and Canada. Along with vertical integration within the respective industries, different sectors of the cattle and hog industries have shifted their production locations based on resource efficiencies. Imports of live cattle and hogs, as well as beef and pork, in the United States have been steadily increasing since the implementation of NAFTA, except during the restrictions on cattle and beef imports from Canada due to bovine spongiform encephalopathy (bse) discoveries there in 2003. There are limited empirical sources that relate the importation of livestock to the domestic US production of meats. This paper introduces a methodology to estimate the amount of US beef and pork production that can be attributed to foreign-born cattle and hogs. The procedure uses official US trade data to quantify livestock imported at various weights and stages of production and projects the final production date and weight using existing data and literature.
1. INTRODUCTION
In 2010, the United States imported 1.04 billion kg of beef and veal from foreign sources, about 7.8 percent of total US beef supplies, and 0.39 billion kg of pork, 3.6 percent of total US pork supplies. While it is easy to track the amount of meat and the number of individual animals that enter the United States, there are few estimates for the amount of meat produced in the United States from animals which originated from outside the country [1]. This requires quantifying the number of animals which are imported at each stage of the production process, projecting the production of that animal, and comparing it to the total domestic production. The purpose of this report is to describe a method by which the proportion of domestic beef and pork that is produced from imported cattle and hogs can be estimated.
The implementation of the North American Free Trade Agreement (NAFTA), starting in 1993, has facilitated increased trade in the animal product complex, across products and species [2]. NAFTA reduced trade barriers and fostered integration between the United States, Canadian, and Mexican markets, particularly in the beef and pork complexes. Since 1993, there has been an increase in imports of live animals and beef1 from Mexico and Canada and pork from Canada. As a result, there has been a vertical integration between the industries in all three countries; especially between the United States and Canada who have very similar production systems and markets.
Meat production generally consists of breeding, feeding, and slaughtering processes, regardless of the species. Markets exist for animals at each of these production stages. The integration of the North American market has increased the volume of trade in each of these stages. Increasing trade in livestock and meat has coincided with an increased customer and policy awareness of tracking and labeling the country in which the product was produced.
2. PATTERNS OF TRADE
2.1. Hogs
Although some breeding stock is imported from other countries, nearly all hogs imported into the United States originate from Canada. The Canadian herd is approximately one-quarter the size of the herd in the United States. Likewise, Canadian pork production has averaged 1.7 billion kg per year from 2000 to 2010, compared to 9.5 billion kg in the United States. Canada also relies more heavily on export markets than the United States, exporting approximately 51 percent of the production compared to 12 percent in the United States [3].
While production systems in the United States and Canada are very similar, structural changes have led to a more consolidated, vertically integrated North American industry. To minimize feed costs, hog feeders have concentrated near the production centers of feed inputs over the past 15 years—namely soybeans and corn. In turn, packing houses have concentrated near feeders. As a result, the hog industry has concentrated in the Corn Belt of the United States, where corn and soybeans are grown; in particular, in the state of Iowa [4]. This change has led to an increase in the number of feeder hogs imported into the United States and decreased the number of hogs imported for immediate slaughter.
As a result of the structural changes to the market, live hogs from Canada are increasingly imported for feeding purposes as opposed to immediate slaughter. Over 80 percent of imported hogs in 2010 were feeder hogs, compared to less than 32 percent in 1994. Increasingly, these hogs are mostly destined for major feed-grain-producing states in the Midwest, particularly Iowa [4]. Hogs are generally weaned after 1 month and then fed for 5 to 6 additional months before slaughter [5]. According to government trade figures, most feeder hogs are imported at less than 3.2 kg. Hogs destined for immediate slaughter are generally greater than 49.9 kg.
2.2. Cattle
The United States imports live cattle for immediate slaughter, feeding, breeding, and dairy purposes. Cattle imports originate, almost exclusively, from Mexico and Canada. While trade in live cattle exists with other countries, it is generally reserved to a small number of animals for breeding stock due to the high costs of meeting quarantine requirements and transporting them by airplane or ship.
Like pork production systems, beef production systems in the United States and Canada are similar [2]. Both countries produce high-quality, grain-fed beef for their domestic consumers, as well as the export market. Heifers that are not retained as breeding animals and steers are taken off pasture about 12 to 14 months after birth. After coming off pasture, they are generally placed in a feedlot and intensively fed a grain-based diet for approximately 5 to 6 months [5]. After they reach the desired finishing weight, they are sent to slaughter houses and processed into beef.
Cattle in all observed weight categories are imported from Canada into the United States. Most Canadian cattle imports are slaughter-weight fed steers and heifers, but slaughter cows and bulls are also imported for immediate slaughter. Large numbers of imported feeder cattle are placed directly in feedlots, with some lighterweight cattle placed in backgrounding programs. Finally, breeding stock and dairy animals are imported into the United States. Most of these animals will also enter the beef production system as cull animals at some point after importation. The implementation of NAFTA and the similarities in production systems have allowed the Canadian and US markets to become increasingly integrated. Imports of cattle have been primarily determined by relative prices of feeder and slaughter cattle, feed costs, and exchange rates of the two countries.
The discovery of bovine spongiform encephalopathy (bse) in the North American2 herd disrupted the normal trade flows between the United States and Canada [6]. Imports of cattle from Canada were banned in June, 2003. Despite a brief resumption in trade by the end of the year, subsequent discoveries kept the ban in place until July 2005, and even then imports were restricted to cattle under 30 months of age. This restriction effectively banned all cull cows and bulls and included a moratorium on beef from animals over 30 months of age. In November, 2007, restriction on cattle over 30 months were relaxed and imports of Canadian cows and bulls resumed.
Additionally, the discovery of bse in the United States and Canada affected criteria for US and Canadian products other countries would accept. The loss of exports decreased the cut-out value for packing houses, and subsequently affected the values of live animals all the way back through the supply chain. Relative prices, which determine the directions and extent of trade, shifted, and, as a result, the volume of live cattle trade between Canada and the United States was affected.
In Mexico, there are two distinct cattle markets: one north and one south [7-9]. Cattle in the northern part of the Mexico are almost exclusively raised for export to US feedlots. Cattle in the Gulf and southern parts of the country are typically dual-purpose cattle (dairy and meat production) and kept on pasture or finished with supplemental forages. While some cattle feeding occurs in Mexico, the cost of grains in Mexico makes feedlot systems in which cattle reach a high level of finishing less economically feasible than other systems. Cattle that are intensively fed in Mexico are generally finished using grass-based forages or other feeds like byproducts from other agricultural production processes, such as citrus, sugar, or tortilla production. The demand for highlymarbled beef in Mexico is lower than in the United States or Canada, although shifts have begun to take place recently. The feeding regime in Mexico reflects this demand.
The United States imports primarily lightweight feeder cattle from Mexico. Generally, these cattle are raised in the northern states of Mexico and graze on pastures that are similar to those found in the southwestern states in the United States. Once they cross the US border, they are placed in feedlots or stockered on pasture typically in the southwestern part of the United States [2,9]. Trade is primarily driven by weather and pasture conditions in Mexico and the price of feeder cattle in the US markets. Imports of cattle from Mexico declined after NAFTA was enacted due to a weakening peso as the agreement was implemented, but gradually increased, particularly when restrictions place on Canadian cattle due to bse were imposed from 2003 to 2005.
3. DATA SOURCES
The United States typically imports about 2 million head of cattle (Table 1). However, the contribution to the total US supply of beef from these animals is not known. While others have attempted to estimate these quantities [2], data were not available by which to construct estimates of the quantity of meat represented by these imported animals before 1989. Since 1989, data have been available for imported livestock by weight category that, when combined with a set of assumptions about the growth patterns of these imported animals (Table 2), can be used to estimate production and timing of production from imported animals. By knowing animal weights at importation, average daily gain at each stage of growth (weight), and weights at slaughter, it is possible to determine the time animals would have been in the United States before being slaughtered. By knowing or assuming dressed weights at slaughter, the total quantity of beef or pork produced in any month from imported animals can be estimated. These estimated contributions can then be subtracted from the total and combined with imports of meat into the United States to gain a better idea of the share of meat consumption in the United States that is due to foreign livestock and the share attributable to US breeding livestock.
Import data for both hogs and cattle were collected from the Census Bureau’s trade figures. Quantities were collected and aggregated by the 10-digit Harmonized Schedule (HS) code level, which presents imported numbers by weight category. Data include 12 categories of cattle (4 weight categories for steers, the same 4 for heifers, and 4 categories of cattle imported for immediate slaughter (steers, heifers, cows, and bulls)) and 5 categories for hogs (4 weight categories plus a separate category in the 50-plus-kg category for hogs imported for immediate slaughter). Specific weights for each weight category are outlined in column 1 of Table 2. Definitions for each code (not included here) were from the Harmonized Tariff Schedule, published by the International Trade Commission. HS data is available starting in 1989.
Canadian and US cattle and hog feeding technologies are very similar and differences have to do with the slight differences in body size of Canadian cattle and hogs. As a result, it was assumed that cattle and hogs imported from Canada and fed in the United States would perform similarly in either country. Live weights of cattle imported from Canada and slaughtered in the United States were proxied with Nebraska live weights of cattle slaughtered [10]. Further, it was assumed that Canadian dressed weights would be a good proxy for dressed weights of Canadian animals grown, fed, and slaughtered in the United States. Monthly average dressed weights of

Table 1. Numbers and values for live cattle imported into the united states from canada and mexico.
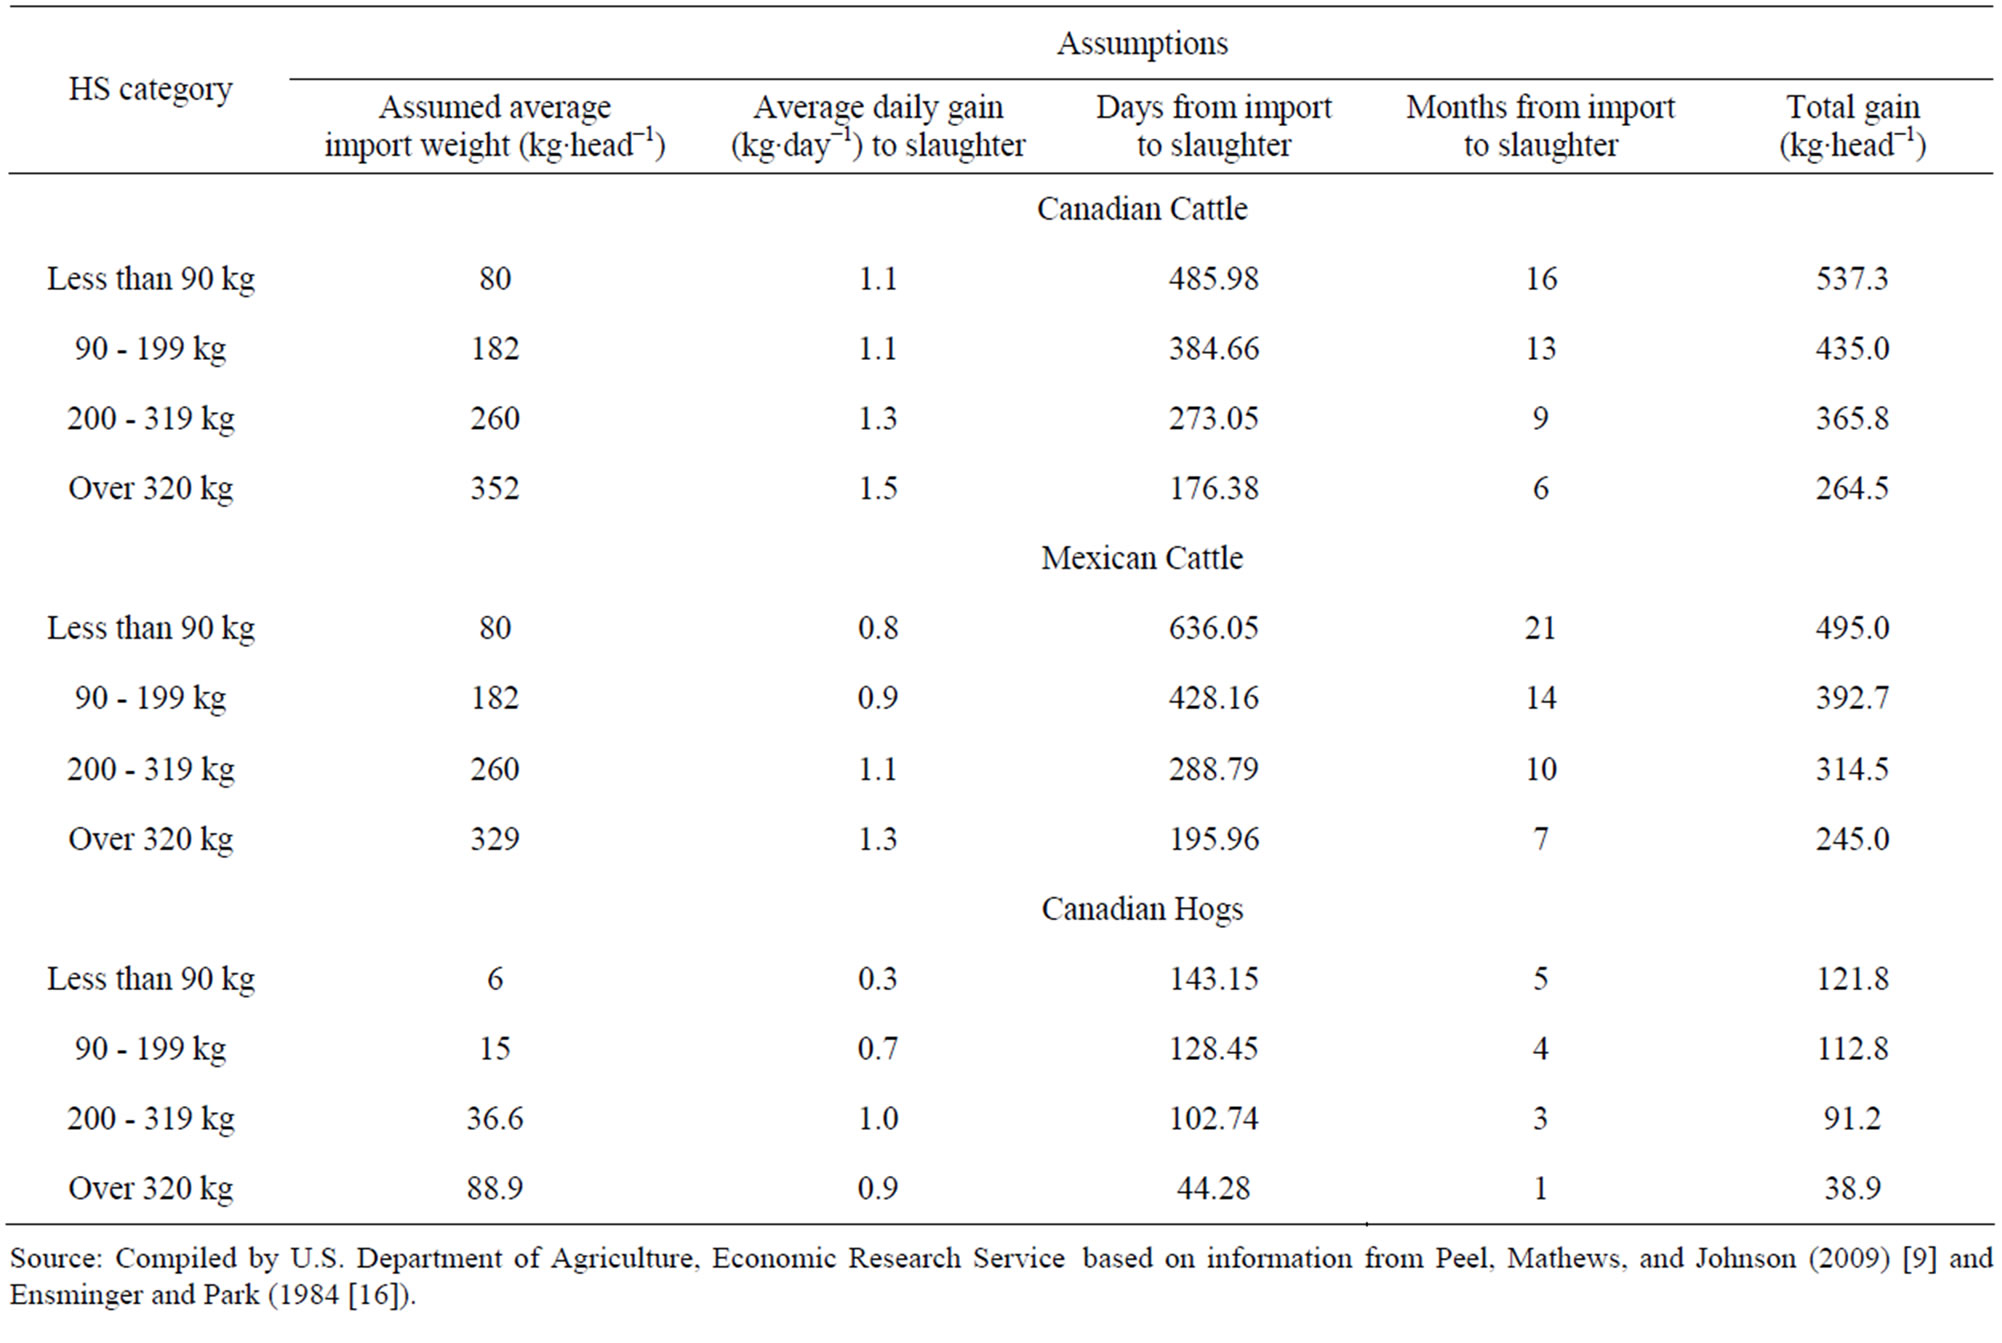
Table 2. Growth assumptions for foreign born cattle and hogs.
both Canadian hogs and cattle slaughtered in Canada were provided by AgCanada [11,12]. These data were from 1995 through 2008 for hogs and 1999 through 2010 for cattle. Number of head slaughtered in the United States and total US beef and pork production data were taken from Livestock Slaughter publications [13].
Due to differences in production systems, slaughter weights in Mexico were not seen as accurately characterizing dressed weights for feeder cattle imported from Mexico and fed and slaughtered in the United States. Since most Mexican feeder cattle are placed in feedlots located in the Southern Plains and Southwestern United States, it was assumed that AMS weights reported for the Southern Plains [14] would reflect the slaughter weights of Mexican cattle fed in that area and, therefore, serve as a useful proxy for the performance of Mexican cattle imported into and fed in the United States. Data collected by the Agricultural Marketing Service on fed steer weights in Texas, Oklahoma, and New Mexico [14] going back to 1993 were used as a proxy. However, this series had a gap from March 2001 to November 2002. To address this gap, a regression using data from the Hoelscher cattle feeding survey—which also contains final weight data from a subset of Southern Plains cattle feeders [14]—was developed.
3.1. Feeding Assumptions
Not all animals imported into the United States are slaughtered immediately. Lighter-weight animals that are imported for feeding are slaughtered several months after they enter the United States. These slaughter lags vary by species and depend on the weight and age of animals when they are imported. In general, the smaller an animal is when imported, the lower will be its average daily gain for its total tenure in the United States and the longer it will be in the United States (Table 2). For feeder cattle and hogs, weight categories defined within the HS categories were combined with assumptions about length of feeding periods and gains and used to project dates at which imported animals were slaughtered. Projections were based on imported weight, average daily gain calculations, and final slaughter weights (Table 2). For example, it was assumed that less-than-90-kg steers (or heifers) would weigh an average of 80 kg, would gain 0.8 kg·day−1 for 636.05 days (Table 2).
3.1.1. Canadian and Mexican Cattle
Assumptions about the performance of feeder cattle imported from Canada were based on a slaughter weight of 615.5 kg, the Nebraska 2007 annual weighted average direct slaughter weight for steers, all grades (USDA/ AMS, LM_CT175[10]) (Table 2). Cattle were assumed to enter the feedlot at 351.5 kg. Prior to entering a feedlot, cattle were assumed to grow on pasture to placement weight, with the rate of gain varying according to the weight of the animal at the time of importation. Cattle were assumed to gain 1.5 kg·day−1 in feedlots. Using Canadian dressed-weight data for steers, heifers, cows, and bulls and the assumptions about the amount of time the animals were in the United States before reaching slaughter weight, the monthly Census trade data were adjusted to reflect this beef production from imported cattle.
Assumptions about the performance of feeder cattle imported from Mexico were derived similarly to those for Canadian cattle, based on an average slaughter weight of 573.3 kg, the 2007 Texas/Oklahoma/New Mexico annual weighted average direct slaughter steers, all grades (USDA/AMS, LM_CT173[14]). Mexican cattle assumptions were based on slightly lower placement weights, pasture gains, and feed lot average daily gains (Peel, personal communication).
The series used as a proxy for Mexican fed cattle was not continuous. Data from March 2001 to December 2002 were missing. As a result, steer and heifer finishing weights were estimated by regressing steer and heifer finishing weights on final weights from the Holscher data series and a lagged dependent variable. Separate regressions were run for steers and heifers. The equation for this regression was the following:
 (1)
(1)
With FedWeightit being the final weight of fed cattle from the AMS series [14]; HolFedWeightit being the weight reported by the Hoelscher series [15]; FedWeightit−1 being the reported AMS weight lagged on month, I = {steers, heifers}, and t = time. The equation fit the data well (R-squares of 0.87 (steer equation) and 0.82 (heifer equation)) (Table 3). Estimates for the missing time period were simulated using Eq.1, substituting the model results for the lagged weight variable.
3.1.2. Canadian Hogs
Feeding periods for hogs only take into account the intensive feeding period, since hogs are not put on pasture. Otherwise, the feeding periods for Canadian hogs were calculated similarly to cattle (Table 2). Assumptions for hog gains were based on a 2007 slaughter weight of 127 kg [12]. Average daily gains for hogs in each imported weight category, ranging from 0.3 kg·day−1 for pigs under 7 kilograms to 1.0 kg·day−1 for those over 50 kilograms, were based on information from [16]. The adjustment from import month to production month was made accordingly.
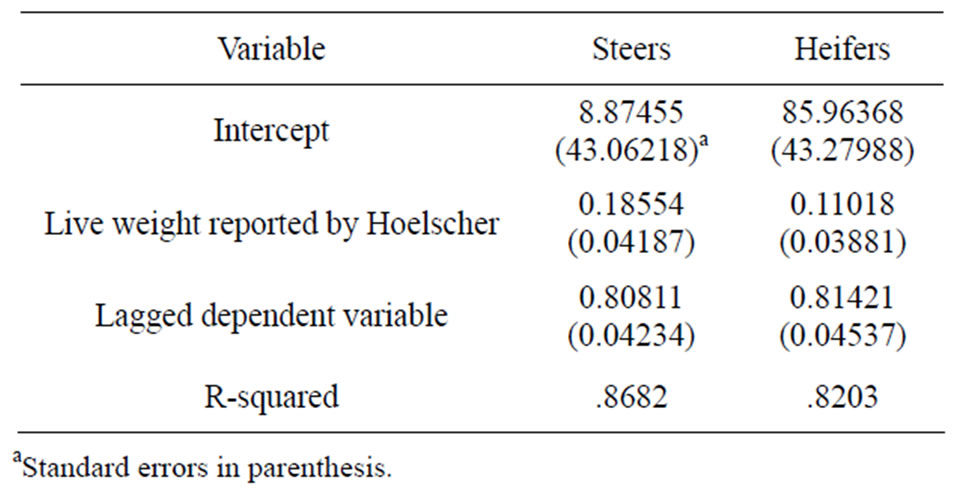
Table 3. Estimated parameters for regression of monthly steer and heifer live weight sb.
3.2. Import Assumptions
3.2.1. Cattle
The United States also imports breeding animals and dairy heifers, almost entirely from Canada, most breeding animals and dairy heifers also enter the US beef production system, but were not accounted for in our calculations because of the difficulty in estimating when they are slaughtered at the end of their productive periods in the United States. They also represent a much smaller proportion of cattle imported into the United States; thus, it was assumed that their contribution to the production system is negligible (Table 2).
3.2.2. Hogs
Similar to Cattle imports, the United States imports breeding hogs from Canada. Again, most of these animals will be slaughtered for pork production at some point, but it is difficult to estimate how long they will be used for productive purposes before being culled. As a result, imported hogs used for breeding are excluded, assuming that their contribution to production is negligible (Table 4).
The Harmonized Tariff Schedule’s codes changed during the period analyzed, which required adjustment to hog feeding periods. Prior to July 2000, there were three import codes: one for purebred, one for hogs less than 50 kg and one for hogs greater than 50 kg. Beginning in July 2000, hogs over 50 kg were broken into hogs for immediate slaughter and not for immediate slaughter. Beginning in July, 2003, hogs less than 50 kg were further disaggregated into separate weight categories: under 7 kg, between 7 and 23 kg, and between 23 and 50 kg. Finally, in January 2005, hogs greater than 50 kg not for immediate slaughter were disaggregated into animals for breeding3 and for other purposes.
To address hogs greater than 50 kg, the proportion of each category of hogs was estimated and used to distribute the aggregated group of hog imports. Based on regression analysis (not reported here), there were no sig-
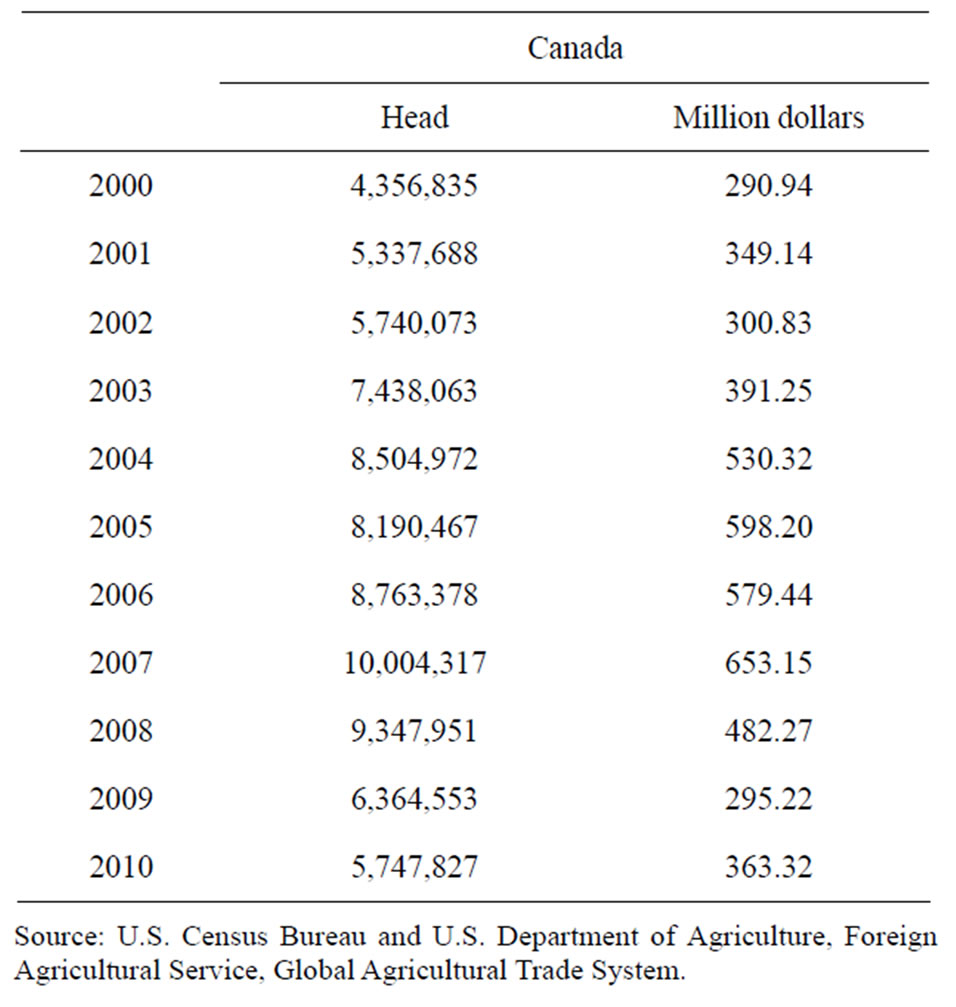
Table 4. Numbers and values for live hogs imported into the United States from Canada.
nificant time trends or seasonal patterns observed. Nearly all hogs over 50 kg were for immediate slaughter. Adjusting for a shift in slaughter hogs after a change in HS codes in 2005, aggregated hogs were adjusted so that 91.53 percent of hogs imported over 50 kg were used for immediate slaughter. Since the bulk of hogs imported over 50 kg were for immediate slaughter and given the problems associated with transporting hogs in latter stages of feeding/finishing, the rest of the imported over −50 kg hogs were assumed to be breeding pigs.
4. RESULTS
4.1. Cattle
The results of the procedure show that on average, foreign-born cattle account for 8.1 percent of monthly production (Table 5). There is a seasonal pattern, where foreign-born animals account for the highest percentage of US beef production in September. Most beef production from foreign-born animals takes place in the first quarter because of the large numbers of feeder cattle imported and placed on feed in the fall. The percentage has been trending upward since 1999. The highest proportion reached thus far has been 13.6 percent in February of 2006, while the lowest has been 2.9 percent in June of 20034.
By weight, production attributed to foreign cattle averages over 79.8 million kg per month. The highest
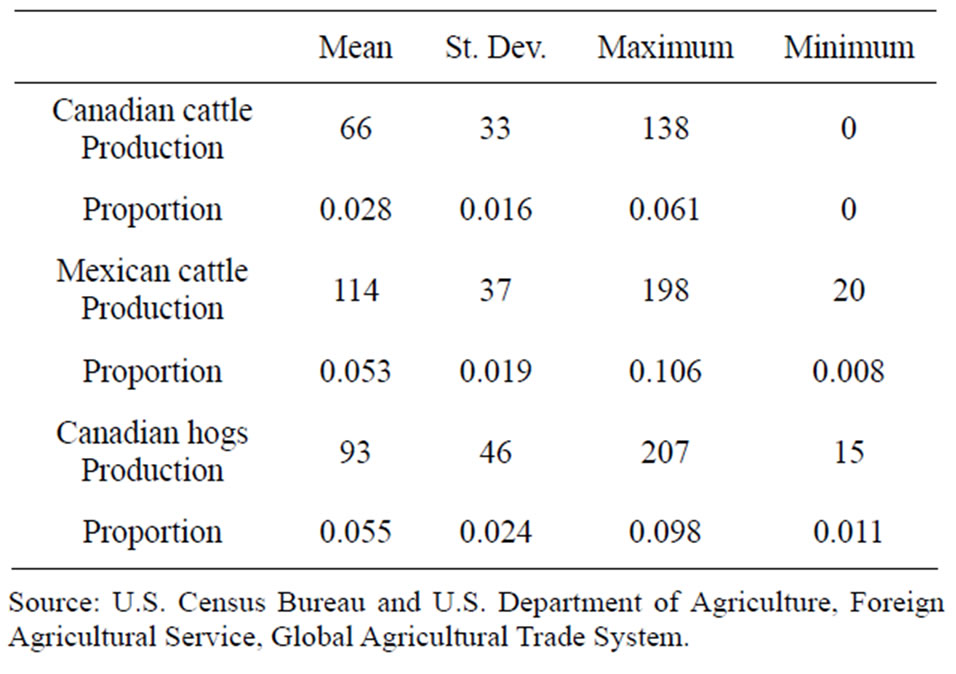
Table 5. Statistics for imports of foreign livestock into the United States.
monthly total was in September 2008, at 133.4 million kgs, while the lowest was in June 2003, at 31.8 million kgs, the month after bse was confirmed in Canada.
In 2003, the discovery of bse in Canada and the subsequent trade bans led to a temporary decline in production attributed to Canadian cattle, leaving only production from cattle imported from Mexico. Production from Mexican animals trended upward from 2003 to 2006, as live cattle imports increased during the ban of Canadian cattle. However, as Canadian cattle less than 30 months of age were again allowed to be imported into the United States in 2005—extended to cattle over 30 months of age in 2007, production from Canadian cattle increased. As production from Canadian cattle increased post-bse, production from Mexican cattle declined.
Canadian cattle have accounted for 2.8 percent of monthly beef production during 1999-2010, inclusive of the seven months following bse when no production was attributed to Canadian cattle. However, during this period, cattle already in the United States continued through the production process.
4.2. Hogs
Pork production attributed to Canadian-born hogs averaged 5.5 percent of total US production since 1995, or just over 42.2 million kg per month (Table 5). Total pork production trended upward throughout the period analyzed. The percentage of production attributed to hogs of Canadian-born hogs also increased.
The pork series is smoother than the beef series, primarily attributed to the fact that there were no trade bans due to sanitary-phytosanitary issues or animal disease events. Additionally, there was only one major exporter of live hogs to the United States. The highest percentage of US production that was accounted for by Canadianborn pigs was 9.8 percent in July of 2007. The smallest was 1.1 percent in February of 1995, the second point in the dataset. By weight, the largest month was January of 2008, at 94 million kg. The smallest was also February 1995 at 6.8 million kg.
5. CONCLUSIONS
Since the implementation of NAFTA, there has been increased integration among the North American livestock markets. International trade now plays a significant role in all stages of meat production, from breeding and raising animals to production and fabrication of meat products. The result has been shifts of production centers to their most efficient locations. These locations have primarily been in the United States, in particular for intensive feeding and slaughter of hogs and cattle.
US imports of hogs and cattle have increased since 1989, except the declines attributable to animal-disease related trade restrictions. Using existing data and literature, estimates were made in order to determine how much domestic meat production can be attributed to foreign-born animals. The proportion of domestic production attributed to foreign-born animals has trended upwards for both beef and pork. While beef production from foreign born animals decreased dramatically from restrictions on Canadian cattle due to bse concerns, the upward trend continued shortly after the shock. Pork production has consistently trended upward, without any major shocks. Over the last decade, imports of meat into the United States and meat produced in the United States from foreign livestock have accounted for roughly 18 percent (beef) and 10 percent (pork) of US beef and pork supplies.
Market integration between the NAFTA countries is expected to continue. There are already data sources for the trade of live animals and meat products individually. However, there is an increasing need to understand the relationship between imported livestock and their contribution to US domestic production. This paper has presented a method of estimating meat produced from foreign-born cattle and hogs that facilitates understanding of the share of US beef production attributable to foreign sources and points out the relative importance of foreign sources for US meat supplies. These estimates provide a basis for further and future analysis of that relationship as well as for assessing production parameters related to economic and production efficiencies.
REFERENCES
- Brester, G.W. and Marsh, J.M. (1999) US beef and cattle imports and exports: Data issues and impacts on cattle prices. Trade Research Center, Policy Issues Paper No. 9. http://ageconsearch.umn.edu/bitstream/29162/1/pip09.pdf
- Hahn, W., Mildred, H., Leuck, D., Miller, J. J., Janet P., Taha, F. and S. Zahniser (2005) Market integration of the north american animal products complex. Economic Research Service, Washington DC.
- United States Department of Agriculture, Foreign Agriculture Service (FAS), PS&D Database Online. 2009. http://www.fas.usda.gov/psdonline/psdQuery.aspx.
- Haley, M.M. (2004) Market integration in the North American hog industries. Economic Research Service, Washington DC.
- Stillman, R., Haley, M. and Mathews, K. (2009) Grain prices impact entire livestock production cycle. Amber Waves, USDA, Economic Research Service, March 2009. http://www.ers.usda.gov/AmberWaves/March09/Features/GrainPrices.htm
- Mathews, K.H. Jr., Vandeveer, M. and Gustafson, R.A. (2006) An economic chronology of bovine spongiform encephalopathy in North America, US Department of Agriculture, Economic Research Service, June 2006. http://www.ers.usda.gov/publications/ldp/2006/06Jun/ldpm14301/ldpm14301.pdf
- Peel, D.S. (2005) The Mexican cattle and beef industry: demand, production, and trade. Western Economics Forum, 2005. http://ageconsearch.umn.edu/bitstream/27996/1/04010014.pdf.
- Peel, D.S., Johnson, R.J. and Mathews, K.H. Jr. (2010) Cow-calf beef production in Mexico. Outlook Publication, November 2010. http://www.ers.usda.gov/Publications/LDP/2010/10Oct/LDPM19601/
- Peel, D.S., Mathews, K.H. Jr. and Johnson, R.J. (2011) Trade, the expanding Mexican beef industry, and feedlot and stocker cattle production in Mexico. US Department of Agriculture, Economic Research Service, e-Outlook, August 2011. http://www.ers.usda.gov/Publications/LDP/2011/08Aug/LDPM20601/ldpm20601.pdf
- United States Department of Agriculture. (2007) Nebraska yearly weighted average cattle report—Negotiated purchases, Agricultural Marketing Service, Washington DC.
- Agriculture and Agri-Food Canada, Beef Supply at a Glance, Various Issues. http://www.agr.gc.ca/redmeat-vianderouge/index_eng.htm
- Agriculture and Agri-Food Canada. Hogs at a glance, Various Issues. http://www.agr.gc.ca/redmeat-vianderouge/index_eng.htm
- United States Department of Agriculture, National Agricultural Statistics Service, Livestock Slaughter, Various issues. http://usda.mannlib.cornell.edu/MannUsda/viewDocumentInfo.do?documentID=1096”
- United States Department of Agriculture. (2007) TexasOklahoma. New Mexico yearly weighted average cattle report—Negotiated purchases, Agricultural Marketing Service, Washington DC.
- Hoelscher, M. (1995) [Monthly] Feedyard analysis. The Miller Publishing Company, Minnetonka.
- Ensminger, M.E. and Parker, R.O. (1984) Swine science. 5th Edition, The Interstate Printers and Publishers, Inc., Danville.
NOTES
*The views expressed here are those of the author(s), and may not be attributed to the Economic Research Service or the US Department of Agriculture.
1Cattle and beef imports were interrupted after the first cases of bse were discovered in both the Canadian and United States’ herds in 2003. Restrictions placed on the movement of cattle in both countries have gradually been lifted.
2The first native-born case of bse was discovered on May 20, 2003 in Canada. The first bse case found in the United States was discovered on December 23, 2003 in a cow imported from Canada.
3Prior, designation for breeding animals was only used for purebred hogs.
4As a result of the first case of bse in North America on May 20, 2003, subsequent trade bans and restrictions were placed on Canadian cattle imported into the United States.