International Journal of Geosciences
Vol. 4 No. 3 (2013) , Article ID: 31722 , 17 pages DOI:10.4236/ijg.2013.43054
Dispersal Patterns of the Late Cretaceous to Early-Tertiary Sediments in the Southern Anambra Basin, Southeastern Nigeria
1Department of Geoscience, Federal University of Technology, Owerri, Nigeria
2First Exploration and Petroleum Development Company Limited, Ikoyi Lagos, Nigeria
Email: Samuel.onyekuru@futo.edu.ng
Copyright © 2013 Samuel Okechukwu Onyekuru et al. This is an open access article distributed under the Creative Commons Attribution License, which permits unrestricted use, distribution, and reproduction in any medium, provided the original work is properly cited.
Received February 25, 2013; revised March 28, 2013; accepted April 26, 2013
Keywords: Dispersal; Patterns; Formation; Sequence Boundary; Facies; Spatial; Complexes; Erosion
ABSTRACT
The dispersal patterns of the Late Cretaceous to Early Tertiary sediments in southern Anambra Basin were studied to delineate spatial facies distributions for improved mapping and hydrocarbon prospectivity. Seven lithofacies distinguished from eleven outcrop sections aided the interpretation of depositional environments for the different depositional units. Interpreted paleoenvironments ranged from estuarine/lagoonal to tidal delta and shallow marine depositional environments. Sequence stratigraphic interpretation of the deposits using vertical relationships between the delineated facies and foraminiferal and palynofacies assemblages and the interpreted environmental setting identified two complete sequences (SEQ-1 and -2) and two incomplete sequences (SEQ-3 and -4) in the study area. The sequiences are enveloped by three Type-1 Sequence Boundaries (SB), two Transgressive Surfaces of Erosion (TSE) and four Maximum Flooding Surfaces (MFS). The identified surfaces were used to delineate formation boundaries and as such would assist in the improved mapping of the Anambra Basin and adjoining depocenters. The massive sand units of the Highstand and Transgressive Systems Tracts constitute good (potential) reservoirs, while the transgressive shales would constitute seals for potential traps in the study area. The delineation of these petroleum system elements, especially those associated with the Transgressive and Highstand Systems Tracts has conferred great hydrocarbon prospectivity potential on the sedimentary sequences in the Basin. The absence of deep marine and slope complexes of the Lowstand Systems Tract (LST) in the interpreted sequences is indicative that the study area is the up-dip section of the Anambra Basin.
1. Introduction
The Anambra Basin extends over a roughly triangular territory, estimated at about 95,000 km2 wide [1]. It is believed to occupy a geographic position among the Benue Trough, the Middle Niger depression, the Niger Delta and the Abakiliki Anticlinorium (Figure 1).
The dispersal patterns of the Anambra sedimentary fills have not been clearly established, hence, the difficulty in demarcating its geographic boundaries from adjoining Nigerian coastal basins. The northern limit of the basin is arbitrarily placed around 8˚N Latitude while its southern limit is not clear, being masked by the younger Niger Delta deposits [2]. The eastern and western boundaries are also not well established. [1], however, attempted a demarcation of the Anambra Basin from the Benue Trough using lithostratigraphical studies. The basin had also been described as Late Cretaceous to Early Tertiary, a delimitation based on time [3].
The study of spatial facies relationships in a sequence stratigraphic framework would ensure a more accurate description of sedimentation patterns in the Anambra Basin. Sequence stratigraphy offers unifying concepts that provide the ability to predict the position of play elements, rock units’ continuity/extent and the recognition of constrained key surfaces for better mapping and correlation [4].
Oil exploration in Nigeria was earlier concentrated in the Niger Delta sequences of Eocene to Pliocene age. Recently, however, exploration efforts are gradually be-

Figure 1. Geological sketch map of Nigeria showing the bounds of Sedimentary Basins. The Basins are numbered as described: 3. Northern Benue Trough, 4. Central Benue Trough, 5. Southern Benue Trough, 6. Bida Basin, 7. Iullemmeden Basin, 8. Chad Basin, 9. Dahomey Basin, 10. Anambra Basin, 11. Niger Delta Basin [1].
ing shifted to both the offshore (Pliocene-Pleistocene sections) and the flanks of the delta. The Cretaceous prospects (especially the sedimentary sequences of the Anambra Basin, are expected to provide better options for hydrocarbon (gas) prospectivity amongst the new frontiers, based on hopeful implications of thick sediment pile (estimated to be about 5 km thick) and observed hydrocarbon seepages and shows [5,6].
The search for hydrocarbons in the Anambra Basin can be enhanced by the use of an integrated approach for stratigraphic analysis and prediction: sequence stratigraphy [7]. It enables a better understanding of the linkage between sedimentation patterns in different parts of a basin and location of reservoirs, their continuity and seal prone zones (traps). It also perfectly predicts bypassed pay zones and step-out potentials in a basin [8].
To realize optimal hydrocarbon exploration, recovery and production will require the understanding of the depositional setting and location of play elements within the depositional setting for a realistic or near realistic representation of the subsurface and paleo environmental conditions within the basin.
This present study provides a sequence stratigraphic framework for the definition of potentially profitable stratigraphic surfaces, sequences and structures for better mapping and improved predictability of play elements in the southern Anambra Basin.
2. Location of Study
The Anambra Basin is arbitrarily placed between Longitudes 6˚35' and 7˚45'E and Latitudes 6˚00' and 7˚30'N [9] (Figure 1). This study evaluated sediments exposured in the southern part of the basin, covering Alayi, Uturu, Okigwe, Ohafia, Ihube, Leru, Lekwesi, Ubaha-Umuchima and Umulolo (Figure 2).
The landscape of the area of study is mainly dominated by a cuesta, an assymetrical ridge, with its western end at the left bank of River Niger at Idah, where it stretches northeastwards and, very close to the River Benue, turns south past Enugu to just north near Arochukwu at the right bank of the Cross River.
3. Geological Setting
The Anambra Basin was created after the Santonian thermotectonic event. Sedimentation in the newly-formed basin commenced in the Campanian with a short marine transgression followed by a regression: the Nkporo Shale and its lateral equivalents, the Enugu Shale and Owelli Sandstone, whuch constitute the basal beds of the Campanian period. The broad shallow sea gradually became shallower because of gradual subsidence, initiating regressive phase during the Maastritchtian that deposited deltaic foresets and flood plain sediments of the Mamu Formation (Lower Coal Measures). The Mamu Formation is overlain by the fluvial-deltaic Ajali Sandstone (Falsebedded Sandstone), followed by a return to partially parallic conditions that deposited the Nsukka Formation. The stratigraphic sequence graphically illustrated in Figure 3 represents the totality of the lithic fills of the Anambra Basin.
The overall structure of the Anambra Basin corresponds to a vast syncline plunging towards the southwest and widely opened onto the Niger Delta where it is concealed by series of Tertiary and Quaternary sediments, [10].
4. Methods of Sudy
4.1. Lithostratgraphical Studies
Lithostratgraphical studies involved the review of previous work on the Late Cretaceous-Tertiary stratigraphic successions in Anambra Basin.
This was followed by detailed geological mapping of the area to study eleven (11) outcrop sections and lithofacies relationships of the profiles. Lithologic logs of the sections were scketched to mimic grain size profiles, while photographs of important features were taken. Acquisition of basic sedimentological data such as contacts of bounding surfaces, and sedimentary structures, among
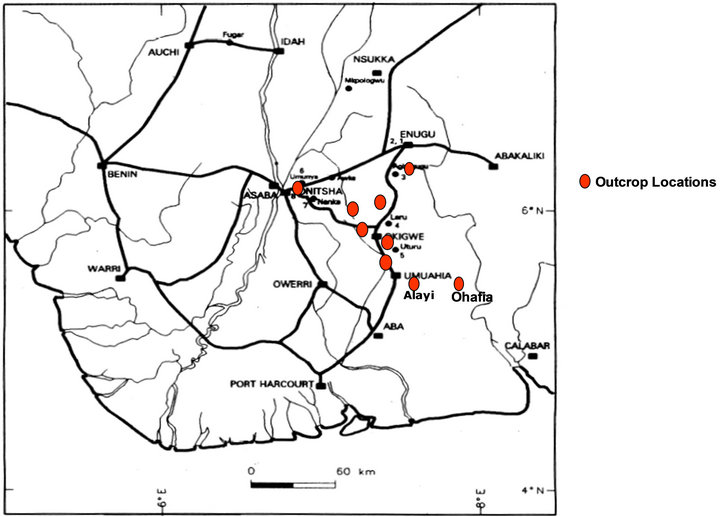
Figure 2. Map of southern Nigeria showing the outcrop locations.
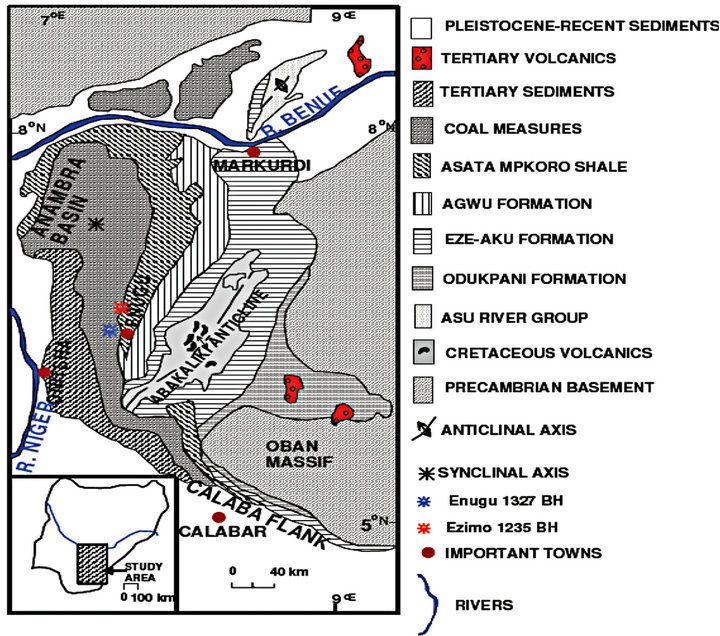
Figure 3. Geological map of southeastern Nigeria showing the study area [12].
others was done to establish relationship between accommodation and sediment supply.Resentative samples were obtained and labeled for further studies in the laboratory and referencing of all the studied locations to the base map was achieved with the Geographical Positioning System (GPS).
4.2. Facies Analysis
Lithofacies analysis done in the study area was mainly descriptive and based on the motif principle which considered the mode or style of vertical succession of facies with respect to Walther’s Law of facies succession. The end result however, recognized that each lithofacies represented a characteristic depositional process.
The preliminary strategy adopted involved the extraction of characteristic lithofacies motifs described from the 10 stratigraphic sections. Facies and local facies sequences were interpreted by considering possible depositional processes that might have given rise to the facies as indicated by the inherent primary sedimentary structures, textures and stacking patterns. The comparism of local summaries with established facies models helped in the interpretation of the environments of deposition of the studied units.
4.3. Sequence Stratigraphy
The sequence stratigraphic interpretation of sections in the study area was based on vertical relationships between lithofacies, macrofossil, palynological and foraminiferal assemblages and on the existing stratigraphic framework of the Late Cretaceous-early Tertiary deposits in southeastern Nigeria [11,13]. On the basis of data obtained from the successions of facies in the studied sections, shallowing-upward (SU) successions were recognized, including flooding surfaces such that parasequences were delimited. Vertical trends in the range of water depths present in successive parasequences were used to identify stacking patterns and surfaces that marked turnarounds from one parasequence set to another.
Sequence boundaries were clearly defined by erosional truncations and onlap, direct evidence of subaerial exposure, abrupt basinward shifts of facies and change in parasequence stacking pattern. Likewise, potential condensed sections were recognized based on unusual burrowing of surfaces by substrate-controlled ichnofossil suites, such as Glossifungites ichnofacies associations of the Skolithos, Ophiomorpha, and Rhizocorallium ichnogenera [14]; abundant diagenetic materials, fossil concentrations, closely-spaced bentonite beds, or radioactive shales.
From the recognition of parasequence sets and potential sequence boundaries and condensed sections, systems tracts and other major stratal surfaces, including the Transgressive Surface of Erosion (TSE) and Maximum Flooding Surface (MFS) were recognized using depositional sequence model [4].
5. Results
5.1. Lithofacies and Paleoenvironmental Interpretations
A total of seven lithofacies were carefully distinguished from the 11 studied sections and given informal designations-AF, BF, DF, EF, FF, HF and KF, for easy handling.
5.2. Interstratified Calcareous Mudstone and Shale Facies (AF)
This lithofacies was observed in the Mamu Formation exposure at Ohafia, KMs 52 and 76, on the Enugu-Port Harcourt Expressway. The Facies was also observed in the Nsukka Formation exposure at Ubaha-Umuchima.
The shale members of lithofacies AF are grey to dark grey in colour, fissile, ferruginuous and in places interbedded with thin calcareous mudstone beds and siltstone lenses. These beds are laminated with mm-scale parallel lamination and lenticular in some sections. They are highly fossiliferous as evidenced by the presence of bivalves and large assemblage of palynomorphs and forams [6]. Pyritic nodules occasionally are sporadically scattered within the beddings. In some of the sections, for example the Ohafia section, the nodules are also calcareous.
Lithofacies AF is interpreted as deposits in environments ranging from lagoonal to shallow, open marine shelf, in a transgressive marine setting [15]. The presservation of primary laminations in the dark grey shales suggests absence of mud-eating benthos. The formation lamination in the Cretaceous is usually considered to have been related to warm climate and consequent stagnant oceans [16]. Occasional climatic changes that formed chemical weathering and reduced clastic input, in conjunction with deepening, may have promoted the precipitation of microcrystalline calcite (micrite). The low diversity and dwarfed nature of forms suggest bottom anoxia for the dark grey shales. Such anoxia probably resulted from bottom water stagnation due to density stratification caused by high input of terrigenous organic matter and poor circulation [17,18]. This condition is also responsible for the occurrence of pyritic noodles in the lithofacies. Faunal and palynomorph assemblages recovered from facies AF are comprised of foraminifera, ostracod, gastropod, among others, which indicate shelf setting [19,20]. The general absence of burrows in the sediments of this low energy environment is attributable to hostile bottom conditions that precluded bottom organisms.
5.3. Horizontal and Cross-Stratified Sandstone Facies (BF)
Horizontal and Cross-Stratified Sandstone Facies (BF) was observed in sections representing the Ajali Sandstone and Mamu Formation, typified in sections observed both in an abandoned quarry near KM 65 Uturu-Afikpo road location and near Leru-Isuochi junction.
The facies consists of sandstone and mudstone interbeds with minor conglomerates. The lithofacies sometimes displays normal grading packages with basal concave-upward shapes. They are planar or trough crossbedded, occasionally, laminated and generally, poorly sorted sands. Furthermore, abundant reactivation surfaces terminate cross-bedded packages that are locally marked by mud drapes. The pebbles in Facies BF are attributed to tidally-influenced fluvial channel. The presence of concave-upward basal deposits (scoured surface), though not exclusive to this facies, is suggestive of flow confinement in channels. Where this feature was not observed, the upward grading facies successions are bounded by sharp, erosional basal surfaces and attest to deposition during decreasing flow energy, as typical of channel fills. Facies BF is, therefore, attributed to tidally-influenced fluvial channels formed in proximal estuarine areas, near the limits of the fluvial realm. This is because weak tidal currents might reach the inner estuarine areas and rework sediments brought from the fluvial channel.
5.4. Heterolithic Shale and Siltstone Facies (DF)
Facies DF was observed in sections both at Km 52 on the Port Harcourt-bound side of the Enugu-Port Harcourt Road and KM 65 along Uturu-Afikpo Road. The sequence is comprised of a succession of siltstone-shale interbeds with sharp bases. They may be rippled or parallel laminated and bioturbated. Siltstone thicknesses and frequency of occurrence increase upwards in the sections. The lithofacies has high abundance of palynomorphs, especially in the Uturu-Afikpo road-cut section. Among the significant, terrestrially derived pollen and spores from the section are Proteacidites longispinosus and Foveotriletes margaritae. The lithofacies also occurs in association with carbonaceous detritus, little bioturbation, shallow marine foraminiferal suites dominated by Haplophragmoides and Ammobaculites and abundant palynormorphs. Hence it is interpreted as prodelta to shallow marine shelf deposit (possibly lower shoreface). He associated carbonaceous shale is interpreted as marsh swamp deposit on account of its stratigraphic position, overlying a scoured surface and similarity to modern delta deposits [21]. The abundance of plant debris in the form of thin lignite beds and fragments, disseminated plant debris, carbonized rootlets and fossil wood fragments show that this facies is a parallic-coaliferous regime. These environments receive large volumes of fine constituents (silt and clay) carried across the levees during floods. The combined accumulation of the organic remains of the luxuriant marsh swamp vegetation and the floods of fine inorganic detritus account for the considerable thickness of marsh deposits [21].
5.5. Poorly Stratified Sandstone Facies (EF)
Facies EF comprises fine to medium-grained sandstones with scattered pebbles and admixtures of mudclasts. The facies is also characterized by poorly developed internal structures or faint indistinct stratifications. It sometimes exhibits stacking and may be ripple laminated. Lisen structures are usually present especially in sections representing the Mamu Formation, Ajali and the Nsukka Formations. The Poorly Stratified Sandtone Facies (EF) is usually associated with Facies FF and hence interpreted as distributary channels/fluvial point bars.
5.6. Red Sandstone Facies (FF)
The Red Sandstone Facies (FF) was observed at three sections of the Mamu Formation in Okigwe area. It is fine-medium-grained, clayey and ripple bedded at most places. It is highly bioturbated and was used as marker bed in sections where they cropped out.
In consideration of stratigraphic relationships, sedimentary structures, lithology, texture and micofauna, the Red Sandstone Facies (FF) is interpreted as barrier island (Shoreface to Beach) deposits.
5.7. Oolitic Sandstone Facies (HF)
The Oolitic Sandsone Facies (HF) consists of dark brown, medium-coarse-grained sandstones. The individual grains of the facies are ooliths of about 0.25 to 0.65 mm in diameter. The oolitic sandstone facies is generally well sorted and consists of carbonates cemented by calcite. This facies was observed in the Ohafia section.
The oolitic sandstone facies (HF) occurs in high energy environments like tidal deltas, as shown by their modern analogues. Ooliths in modern sediments are also known to occur in shallow coastal areas with high turbulence, such as the breaker zone. Ooliths occurrence on the Great Bahama Banks in turbulent waters is good example [22]. The oolitic sandstone facies in the study area is obviously assiociated with turbulent waters within shallow, marginal marine depositional environment.
5.8. Heterolithic Muddy Sandstone Facies (KF)
The Heterolithic Muddy Sandstone Facies (KF) was observed mainly in the Ajali Sandstone. The facies consists of interbeds of fine-medium-grained, brownish, bioturbated sandstones and mudstones with flaser and lenticular bedding. The sands are friable to hard in some places and appear as bundles. The beds may be cross-bedded, laminated, rippled and sometimes show convolute laminations. Locally, vertical and horizontal burrows (e.g. Thallassinoides and Planolites sp) may be present. The Muddy Sandstone Facies (KF) was best developed in the quarry site near Leru Junction with a mud thickness of about 2 m, bioturbated and laterally continuous in the quarry and in close association with facies HF. Facies KF is interpreted as the record of tidal flat settings. Deposition in a flat-lying area was suggested by the tabular geometry and great lateral continuity of the mudstone units in the association. The mudstones indicated deposition from suspension in a low energy environment. The heterolithics conform to a setting with alternating traction and suspension deposits [15]. The heteroliths thus show features which are considered diagnostic of tidal deposits [23]. Internal features of the facies also favour deposition under the influence of tidal currents. Generation of the associated internal structures requires fluctuating current energy, as occurs in most tidal settings. Of particular importance, is the succession of alternating thicker and thinner bundles of hetherolithic sand and mud facies attributed to sediment aggradation under the influence of tidal currents that vary in strength on a daily and monthly basis. The association of sandier and muddier packages may be related to neap-spring tidal variations [24]. This typically normal grading upward succession suggests tidal channels being filled up more or less continuously during rising sea level [23].
5.9. Sequence Stratigraphical Intrepretations
Sequences 1 and 2a: Leru Composite Sections I and II (Nkporo and Mamu Formations)
Two Type-1 Sequence Boundaries (SB-1 and SB-2), a condensed section and two chronostratigraphic significant surfaces (Maximum Flooding Surface-MFS) had been delineated in the Leru 1 and II sections [6] (Figure 4). The sequence boundary identified at the 68 m level in Leru 1 was used as the surface that provided the boundary between the Nkporo Shale and the Mamu Formation in the Leru I section [6]. The same interpretations are adopted in the present study to represent sediment packages of the lowermost sequence (Sequence 1) presumably overlying the Basement Complex in the study area. The sections also revealed the earlier sediment packages (i.e. TST and HST packages of Sequence 2).
Sequence 2b: KM 52 Section near Leru (Mamu Formation)
The KM 52 section consists of a Sequence Boundary

Figure 4. Correlation of Leru I and II sections using MFS (adapted from Onyekuru and lwuagwu, 2010).
(SB), a High Stand Systems Tract (HST) and a Transgressive Systems Tract (TST; Figure 5). Even though the section is an incomplete sequence [25], the lower section is perhaps a continuation of Sequence 2 delimited in the Leru I and II sections (Figure 4). The lowermost section, consisting of shoreface settings with progradational parasequence is interpreted as a Highstand Systems Tract (HST). A sequence boundary (SB-3) was identified at approximately the 7.3 m interval, which marked an incised valley bottom with sharp discontinuity caused by differential erosion. The surface is also studded with pebbles made of quartz, which separates the medium-coarsegrained sandstone (Poorly Stratified Facies, EF), thought to be shoreface facies from medium-coarse-grained, pebbly sandstone interpreted as distributary/fluvial point bar to tidal sandstone deposits. The surface is evidently an unconformity and satisfies the criteria for the establishment of another Type 1 sequence boundary (SB-3) in the section. SB-3 thus marks the end of Sequence 2.
The early TST packages inferred as incised valley fills in the inner shelf setting were observed at the top of the section, marking the beginning of Sequence 3 (Figure 5).
Sequence 3a: KM 76 on the Enugu Port Harcourt Road (Mamu Formation)
The KM 76 section consists of TST, MFS and a HST. The section is also an incomplete sequence [25] and obviously represents the continuation of Sequence 3 observed at KM 52 section (Figure 5).
The sequence starts with tidally influenced channel and bar complexes (Facies KF and FF associations) inferred as retrogradational packages, indicative of low sediment supply and high accommodation. The packages represent a Transgressive Systems Tract (TST) with a net landward shift of facies that filled valleys incised in the shelf during previous sea level drops.
The characteristics of the sandstone interval at about the 11 m interval (Figure 6) aided the identification of a Transgressive Surface of Erosion (TSE), using the series of diagnostic features [26]. The surface bounds the underlying incised valley fills and the overlying Interstratified Calcareous Mudstone and Shale packages (Facies AF). The shales are of shallow marine origin based on forms (including Haplophragmoides sp, Ostracoda and Gastropoda) recovered from the section [6]. This environment

Figure 5. Sequence stratigraphic interpretation of Km 52 section near Leru.
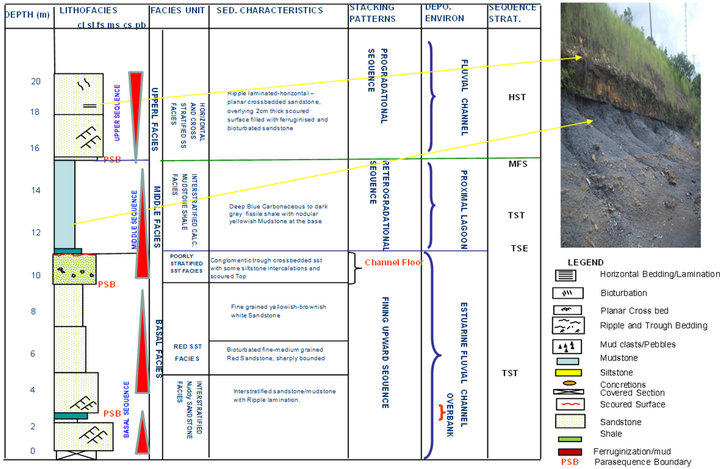
Figure 6. Litholog and interpretation of Km 76 Section on the Enugu-bound side of the Enugu-Port Harcourt Expressway.
is indicative of a more deepening paleobathymetry indicative of net landward shoreline migration relative to the early TST observed in the KM 52 sectionThe MFS inferred at the 15 m interval is associated with a condensed section with bored hardground (Figure 7) and anomalously high content of forms, including Haplophragmoides banchensis, Ammobaculites sp, Haplophragmoides sahariense, Haplophragmoides sp, Ammobaculites benuersis, Pracbulimina longe, Trachammina sp, Ammobaculites jessensis Miliammina pindigensis tsogensis, among others.
The overlying HST that starts at about the 15 m interval represents a stable sea grading into shallowing stages, inferred from the pronounced increase in sand content upsection (coastal aggradation). This HST represents fluvial/tidal channels (Figure 6) believed to be deposits of the Ajali Sandstone.
Sequence 3b: KM 65 Uturu-Afikpo Section (Mamu Formation)
This sequence starts with a retrogradational proximal complex, representing a late TST (Figure 8). A Maximum Flooding Surface (MFS) is inferred at about the 8 m interval based on stacking patterns, palynological and foraminiferal assemblages of the lithofacies.
Among the significant, terrestrially derived pollen and spores from the studied sections are Proteacidites longispinosus and Foveotriletes margaritae. This section represents sequences in the non marine realm, when rivers are no longer confined to valleys, resulting in more floodplain preservation and low meandering (fluvial) systems conducive for coal formation as indicated by the presence of minor lignite and rootlets in the section. The overlying Highstand Systems Tract (HST) that starts from the 8 m interval represents a stable sea grading into shallowing stages. This condition is revealed by the tendency towards a progressive increase in sand content upsection. This HST represents fluvial channels probably of the Ajali Sandstone.
Sequence 3c: Ndiokereke Ohafia Section (Mamu Formation)
The Ndiokereke section consists of a Transgressive Systems Tract (TST) representing marine retrogradational patterns of sea level rise (Figure 9). The maximum of this rise, which would have represented a turn around to shallowing patterns, was not observed. The facies represents neritic sequences. However, the highly fossiliferous and micritic facies probably represents the condensed sections associated with the identified Maximum Flooding Surface (MFS) in Okigwe area.
Sequence 4a: Quarry near KM 65, Uturu-Afikpo Road
Figure 10 shows only Transgressive Systems Tract (TST) packages formed as a result of a retrograding sequence following continued sea level rise and net landward shift of facies. The event caused the deposition of estuarine and tidally influenced fluvial channel fills.
The underlying Sequence Boundary (SB) above the HST in Sequence 3 (Figure 8) was not observed in the sections, hence, the inferred TST marks the beginning of another sequence (i.e. Sequence 4) in the Ajali Sandstone.
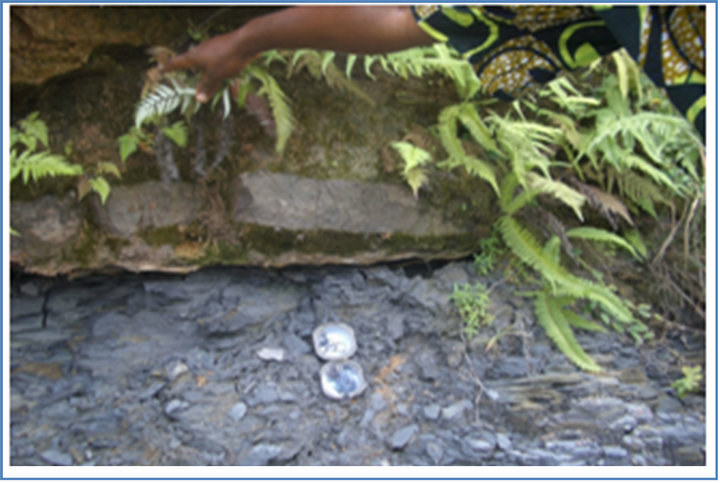
Figure 7. Sharp upper contact of the shale and mudstone units (hardground) with load casts and sparse bioturbation at the KM 76 section.
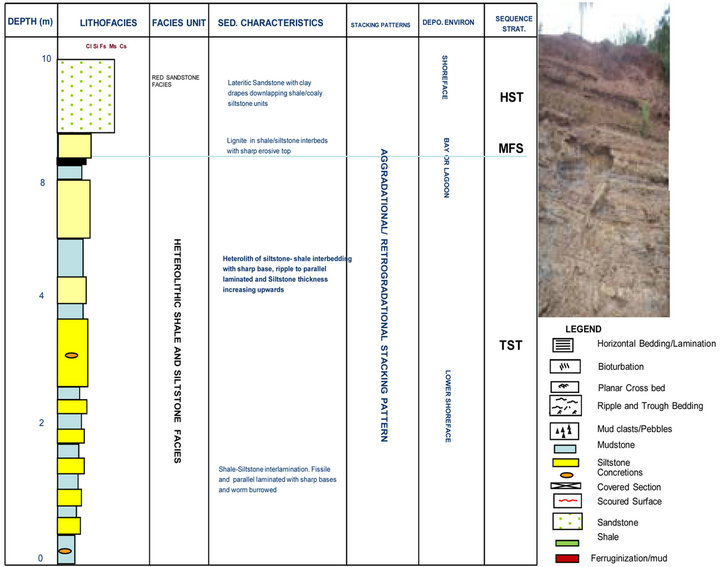
Figure 8. Lithology and interpretation of Km 65 section (along Uturu-Afikpo Road).
Sequence 4b: Quarry near Leru (Ajali Sandstone)
The quarry section near Leru displays retrogradational parasequence sets of tidally influenced channels inferred as packages of a Trangressive Systems Tract (TST). Additionally, a Transgressive Surface of Erosion (TSE) is inferred at about the 6.5 m interval where an incised valley fill of pebbly sandstone and mudclasts directly overlie a bioturbated erosional surface (Figure 11). The surface is better preserved at a section in the Onyekaba Mine, near Okigwe town (Figure 12). The erosional surface (TSE) was used to define the contact between the Ajali Sandstone and the overlying Nsukka Formation. The overlying TST that formed from the surface is interpreted as sequences of the Nsukka Formation.
Sequence 4c: Nsukka Formation
The Nsukka Formation sediments that crop out at Alayi-Item near Ohafia, Umulolo-Okigwe and Ubaha-Umuchima exhibit similar depositional patterns and sequences. All the three sections (Figures 13-15) have as basal facies, about 3.5 - 4.5 m shallow marine sediments (Cross Stratified Sandstone Facies-BF) that pass upwards to marine sediments (Interstratified Calcareous Mudstone Shale Facies-AF). Facies AF is characterized by abundant fossils (including Ammaostuta nigeriana, Ammobaculites coproithiforms, Ammotium nkalagum, Ammotium bornum, Ammobaculites amabens, among others). At the Umulolo section, the marginal marine sediments are overlain by foreshore, brackish deposits indicating increased paleobathymetry and net landward shoreline shift. A Maximum Flooding Surface (MFS) inferred in the section at about the 8 m interval using foraminiferal abundance and diversity data marks a turn around from retrogradational to progradational stacking patterns interpreted as HST. Facies AF and BF that display retrogradational stacking patterns are interpreted as Trangressive Systems Tract (TST) packages.
The transgressive facies at the Alayi section, however, continues upwards into black shale lithofacies with thin bands of limestone. The shaly-limestone interval from 7 to 12 m probably represents the condensed section asso-
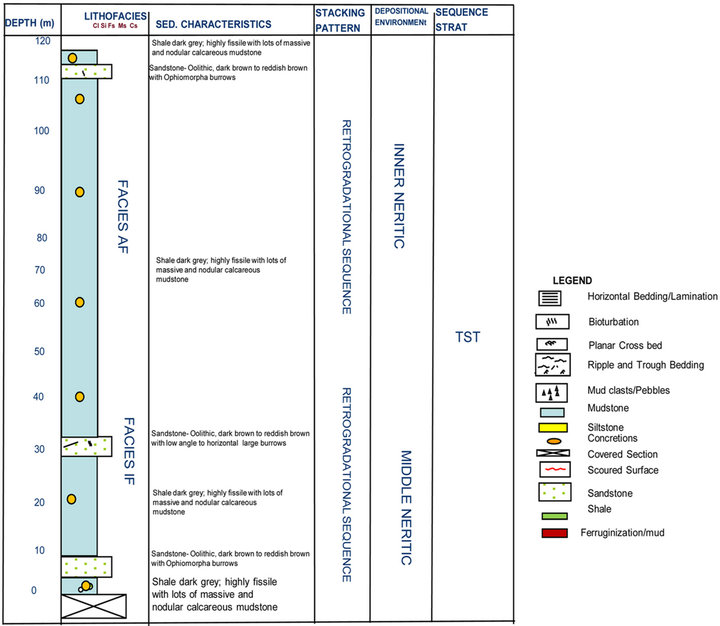
Figure 9. Lithology and the Mamu formation section at Ndiokereke JNC, Ohafia.
ciated with the inferred MFS for the Nsukka Formation.
6. Discussion
6.1. Control on Sedimentation and Sequence Development in the Southern Anambra Basin
Sedimentation in the post-Santonian Anambra Basin provides a good example of the interrelationship between relative sea level changes (eustacy) and tectonics. Evidence from tectono-geomorphologic analysis of the Anambra Basin, accompanying facies sequences and architecture and distribution of seismically induced soft sediment deformational structures within the successions suggest that the basin subsided asymmetrically at least three times during the Campanian-Maastrichtian period [12]. Changes in subsidence rates influence the geometry of sequences generated in basins with relatively high sediment input, such as was the case in the Anambra Basin. A complex architecture of alternating progradational sets with different geometries (reflecting variations in accommodation), will be expected when variations in subsidence rates become the sole factor responsible for the formation of individual sequences. Such complex progradational systems were not observed in the present study. Thus, vertical movement (subsidence) was not likely the sole cause of sedimentation and sequence development in the study area.
Erosional unconformities (sequence boundaries) and other constrained surfaces (for example, Maxmum Fooding Surfaces; MFS), identified in the sequences in the study area have been correlated with major drops in global sea levels [27]. Such correlations highlight the relationship between eustacy and sequence development.
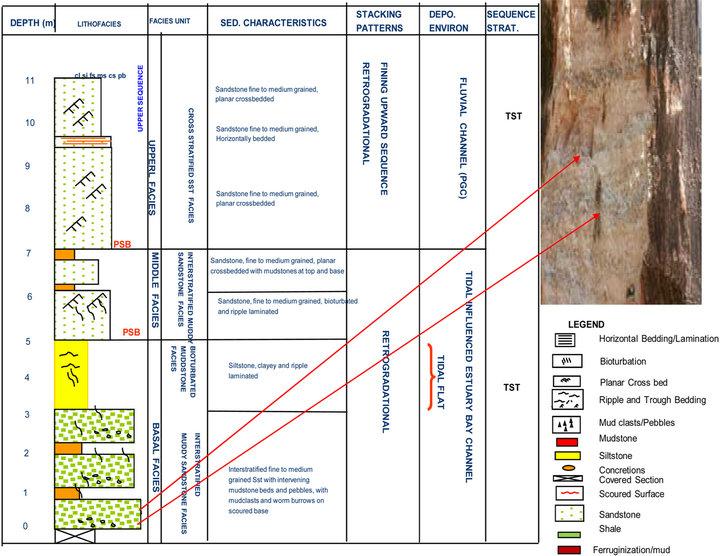
Figure 10. Litholog and interpretation of the Ajali Sandstone Section at the Abandoned Quarry, near Km 65 Uturu-Afikpo Road.
Similarly, cycles of fluvial-shallow marine strata identified in the study area provide strong indication of the interplay between tectonics and relative sea level changes.
6.2. Sequence Stratigraphy and Petroleum Potential of the Southern Anambra Basin
The summary of the outcrop-based sequence stratigraphic packages in the southern Anambra Basin is shown in Table 1. Two complete sequences and two incomplete sequences were interpreted from eleven outcrop sections. The sequences are bounded by three sequence boundaries (SB_1-3), with intervening four Maximum Flooding Surfaces (MFS) and two Trangressive Surfaces of Erosion (TSE). The SBs were generally interpreted where incision (erosion) into underlying beds was evident and/or stratal termination patterns typified by onlap [4]. These unconformities were also interpreted as Type-1 Sequence Boundaries formed by falls in relative sea level greater than subsidence at the shelf edge with visible erosional surfaces in updip areas and visible in outcrops [28].
The surfaces were not dated due to lack of absolute control on foraminiferal and palynological data. Some of the surfaces, however, provided the required surfaces for the placement of boundaries between the various formations in the study area (Table 1). The surfaces will thus assist in solving formation boundary problems in the Anambra Basin.
The accompanying systems tracts in the sequences form distinct complexes consisting of a number of genetically linked retrogradational, progradational and aggradational deltaic systems.
Mapping of reservoir-quality sands and seals, together with an understanding of source rocks and migration paths, would enable the selection of high-quality prospects, such as those associated with the Transgressive and Highstand Systems Tracts.
It is also important to stress, that not all of the constrained surfaces or systems tracts were identified in the sequences from the outcrop sections. The absence of one
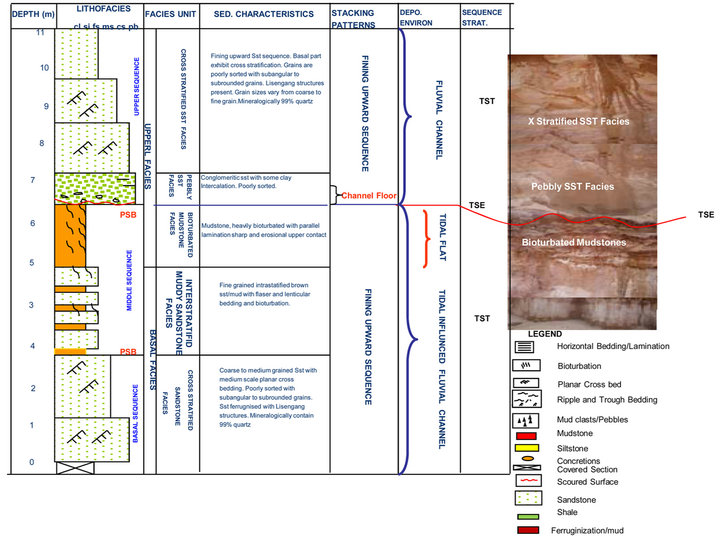
Figure 11. Litholog and interpretation of Ajali Sandstone section at about 2 Km form Leru Junction, off Old Enugu-Port Harcourt Road.
Figure 12. Transgressive Surface of Erosion (TSE) recognized at the base of a feruginized conglomeratic layer that defines the contace between the Ajali Sandstone and the Nsukka Formation at the Onyekaba Mine.
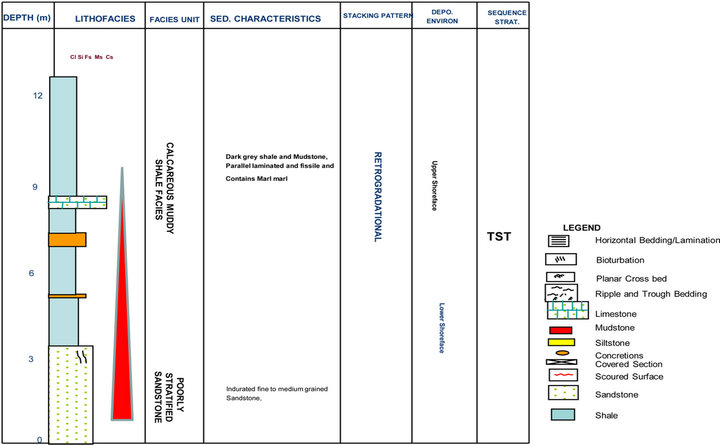
Figure 13. Ligholog and interpretation of section at Alayi-Item.

Figure 14. Lithology and interpretation of the Nsukka Formation section along Okigwe-Arondizuogu Road Section, Umulolo, Okigwe.

Figure 15. Litholog and interpretation of Nsukka Formation section at Umuchima, Ubaha-Okigwe.
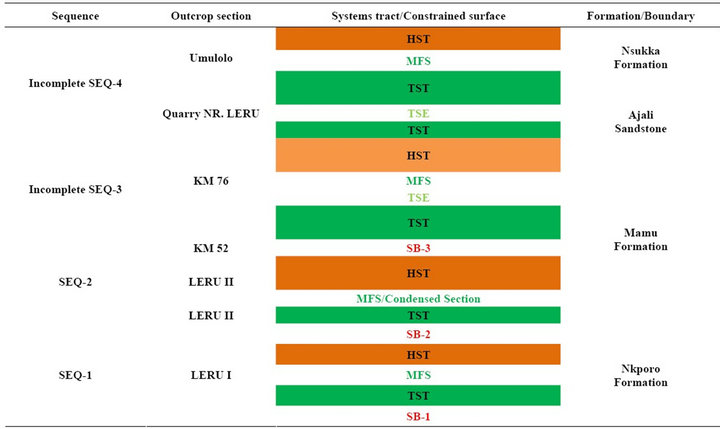
Table 1. Sequence stratigraphic correlation in the Southern Anambra Basin.
or more surfaces or systems tracts may provide important clues to the relative position of the outcrop within the basin. For example, Lowstand Systems Tracts (LST) are commonly absent in updip areas where the Transgressive Surface (TS) and Sequence Boundary (SB) are merged as one surface. In such areas, significant portions of the Highstand Systems Tract (HST) may have been eroded away and the SB is marked by the beginning of retrogradational stacking. Conversely, in the downdip areas, the Transgressive Systems Tract (TST) and Highstand Systems Tracts (HST) may be thin and relatively mud-rich, whereas the Lowstand Systems Tract (LST) may be characterized by an abrupt appearance of thick sandy facies. Many more variations are possible and many basins are characterized by a typical pattern of sequence architecture.
Based on the foregoing, therefore, the southern portion of the Anambra Basin under investigation represents the up dip sections of the basin and as such explains the obvious absence of deep marine and slope complexes of the Lowstand Systems Tract.
7. Conclusion
The study has examined the depositional patterns of the late Cretaceous and Tertiary sediments in the Anambra Basin with respect to lithostratigraphy, biostratigraphy, facies analysis and sequence stratigraphy. These aspects aided the delineation of four depositional sequences and nine surfaces in the southern Anambra Basin. Accompanying systems tracts have high hydrocarbon prospectivity, while some of the surfaces have been used to place boundaries between formations in the study area, thus enhancing surface geological mapping in the basin.
8. Acknowledgements
I am grateful to the Federal University of Technology, Owerri, Nigeria for the award of study fellowship, during my Ph.D. program.
REFERENCES
- C. S. Nwajide, “Anambra Basin of Nigeria-Synoptic Basin Analysis as a Basis for Evaluating Its Hydrocarbon Prospectivity,” In: C. O. Okogbue, Ed., Hydrocarbon Potentials of the Anambra Basin, Great AP Express Publishers Limited, Nigeria, 2005, pp. 1-46.
- G. J. Genik, “Petroleum Geology of Cretaceous-Tertiary Rift Basins in Niger, Chad and Central African Republic,” AAPG Bull, Vol. 77, No. 8, 1993, pp. 1405-1434.
- K. Burke, “Longshore Drift Submarine Canyons and Submarine Fans in Development of Niger Delta,” American Association of Petroleum Geologists, Vol. 56, No. 1, 1972, pp. 1975-1983.
- J. C. Van Wagoner, H. W. Posamentier, R. M. Mitchum, P. R. Vail, J. F. Sarg, T. S. Loutit and J. Hardenbol, “An Overview of Sequence Stratigraphy and Key Definitions, In: C. W. Wilgus, Ed., Sea Level Changes: An Integrated Approach, Society of Economic Paleontologists and Mineralogists, Vol. 42, 1988, pp. 39-45.
- C. M. Ekweozor, “Searching for Petroleum in the Anambra Basin,” In: C. O. Okogbue, Ed., Hydrocarbon Potentials of the Anambra Basin, Great AP Express Publishers Ltd., Nigeria, 2005, pp. 1-110.
- S. O. Onyekuru and C. J. Iwuagwu, “Depositional Environments and Sequence Stratigraphic Interpretation of the Campano-Maastrichtian Nkporo Shale Group and Mamu Formation Exposures at Leru-Okigwe axis, Anambra Basin, Southeastern Nigeria,” Australian Journal of Basic Applied Sciences, Vol. 4, No. 12, 2010, pp. 6623-6640.
- C. E. Bassey and A. O. Ojesina, “Sequence Stratigraic Interpretation of E-Bock in Western Offshore, Niger Delta, Nigeria,” Global Journal of Applied Science, Vol. 5, 1999, pp. 227-233.
- J. Neal, D. Risch and P. Vail, “Sequence Stratigraphy—A Global Theory for Local Success,” Oilfield Review, Vol. 2, No. 1, 1993, pp. 51-62.
- C. E. Okezie, “Geological Map of Nigeria,” Geological Survey of Nigeria, 1974.
- J. Benkhelil, “Structure and Geodynamic Evolution of Intracontinental Benue Trough (Nigeria),” Doctoral Thesis, University of Nice, ELF Nigeria, 1986.
- H. Doust and E. Omatsola, “Niger Delta,” In: J. D. Edwards and P. A. Santogrossi, Eds., Divergent/Passive Margin Basins, American Association of Petroleum Geologists, Tulsa, Vol. 48, pp. 201-238.
- O. J. Ojo, U. K. Ajibola and S. O. Akande, “Depositional Environments, Organic Richness and Petroleum Generating Potential of the Campanian to Maastrichtian Enugu Formation, Anambra Basin, Nigeria,” Pacific Journal of Scientific Technology, Vol. 10, No. 1, 2009, pp. 614-628.
- F. E. Oboh-Ikuenobe, G. C. Obi and C. A. Jaramillo, “Lithofacies Palynofacies and Sequence Stratigraphy of Paleogene Strata in Southeastern Nigeria,” Journal of African Science, Vol. 41, No. 1-2, 2005, pp. 79-101.
- S. G. Pemberton, J. A. MacEachern and R. W. Frey, “Trace Fossil Facies Models: Environmental and Allostratigraphic Significance,” In: R. G. Walker and N. P. James, Eds., Facies Models: Response to Sea Level Change, Geological Association of Canada, 1992, pp. 47-72.
- C. S. Nwajide and T. J. A. Reijers, “Sequence Architecture in Outcrops: Examples from the Anambra Basin Nigeria,” NAPE Bull, Vol. 11, 1996, pp. 23-32.
- J. E. Francis and L. A. Frakes, “Creataceous Climates,” In: V. P. Wright, Ed., Sedimentology Review, Blackwell Scientific Publications, New York, Vol. 1, 1993, pp. 17-30. doi:10.1002/9781444304534.ch2
- S. W. Petters and C. M. Ekweozor, “Petroleum Geology of the Benue Trough and Southeastern Chad Basin Nigeria,” AAPG Bull, Vol. 66, No. 8, 1982, pp. 1141-1149.
- S. W. Petters and J. J. Edet, “Shallow Shelf and Anoxic Facies in the late Campanian-Early Maastrichtian of S. E. Nigeria,” Geologie de I’Afrique et de I’Atlantque Sud Actes Colloques Angers, 1996, pp. 219-233.
- P. H. Heckel, “Recognition of Ancient Shallow Marine Environment,” In: J. K. Rigby, Ed., Recognition of Ancient Sedimentary Environments, Society of Economic Paleontologists and Mineralogists, Tulsa, Vol. 16, 1972, pp. 226-286.
- W. V. Sliter, “Cretaceous Foraminiferas-Depth Habits and Their Origin,” Nature, Vol. 239, No. 5374, 1972, pp. 514- 515.
- H. R. Gould, “The Mississippi Delta Complex,” In: J. P. Morgan and R. H. Shaver, Eds., Deltaic Sedimentation: Modern and Ancient, Society of Economic Paleontologists and Mineralogists, Tulsa, Vol. 15, 1970, pp. 3-30.
- E. G. Purdy and J. Imbrie, “Carbonate Sediments, Great Bahama Bank,” 1964.
- R. W. Dalrymple, “Tidal Depositional Systems,” In: R. G. Walker and N. P. James, Eds., Facies Models: Response to Sea Level Change, Geological Association of Canada, 1992, pp. 195-218.
- S. D. Nio and C. S. Yang, “Diagonistic Attributes of Clastic Tidal Deposits, A Review,” In: D. G. Smith, B. A. Zaithin, G. E. Reinson and R. A. Rahamani, Eds., Classical Tidal Sedimentology, Canadian Society of Petroleum Geologists, Calgary, 1991, pp. 3-27.
- W. W. Wornardt and P. R. Vail, “Revision of the PlioPleistocene Based on Seismic Sequence Stratigraphy,” 11th Annual Research Conference, Gulf Coast Section, SEPM, Program and Extended and Illustrated Abstracts, 1990, pp. 391-397.
- G. R. Baum and P. R. Vail, “Sequence Stratigraphic Concepts Applied to Paleogene Outcrops, Gulf and Atlantic Basins,” In: C. K. Wilgus, B. S. Hastings, H. Posamentier, J. Van Wagoner, C. A. Ross and C. G. Kendall, Eds., Sea Level Changes: An Integrated Approach, Society of Economic Paleontologists and Mineralogists, Tulsa, 1988, pp. 309-326.
- C. E. Ukaonu, S. O. Onyekuru, E. M. Bassey and M. N. Oti, “Delineation of the Cretaceous/Paleogene Boundary Using Outcrops and Well Data in the Nsukka Formation Anambra Basin Nigeria,” NAPE Bull, Vol. 24, No. 1, 2012, pp. 60-77.
- B. U. Haq, J. Hardenbol and P. R. Vail, “Mesozoic and Cenozoic Chronostratigraphy and Cycles of Sea-Level Change. Sea-Level Changes: An Integrated Approach,” 1988.