Journal of Minerals and Materials Characterization and Engineering
Vol.2 No.1(2014), Article ID:41967,9 pages DOI:10.4236/jmmce.2014.21007
Mineralogical Characterization of Sieved and Un-Sieved Samples
NRCan-CANMET Mining, Ottawa, Canada
Email: rlastra@nrcan.gc.ca
Copyright © 2014 Rolando Lastra, William Petruk. This is an open access article distributed under the Creative Commons Attribution License, which permits unrestricted use, distribution, and reproduction in any medium, provided the original work is properly cited. In accordance of the Creative Commons Attribution License all Copyrights © 2014 are reserved for SCIRP and the owner of the intellectual property Rolando Lastra, William Petruk. All Copyright © 2014 are guarded by law and by SCIRP as a guardian.
Received September 26, 2013; revised October 29, 2013; accepted November 9, 2013
KEYWORDS
Mineral; Liberation; Sieved; Un-Sieved
ABSTRACT
Mineralogical characterization applied to mineral processing is now widespread. The first step for a mineralogical characterization study is usually size fractionation. Preparation of polished sections is done on size fractions to reduce complications in making representative cross sections of particles with large size differences. A sample is commonly fractionated into five or six size intervals. The drawback of this procedure is that it makes liberation studies more expensive, because one sample actually produces five or six sub-samples that need to be studied, i.e. one from each size interval. Thus to reduce cost of liberation studies, it would be desirable to study the unsized sample. This paper provides a comparative liberation study of a set of samples both using size fractions and using the un-sized samples. The samples studied are the feed, the concentrate and the tails of a lead rougher flotation circuit. The results consistently show significant differences between the sized and the un-sized samples. Nevertheless, the results indicate that un-corrected liberation data from un-sized samples can be used for comparative studies that involve several related samples. Thus, it is possible to improve (or further understand) a concentrator circuit by using mineralogical data from un-sized samples around such circuit.
1. Introduction
The objective of the mineralogical characterization applied to mineral processing is to determine the mineral quantities, the mineral liberation and the mineral association. Automated mineralogical characterization by instruments such as the QEM * SCAN, the MLA and the TIMA is now quite widespread. In the world, there are about 200 such instruments.
Sample preparation for quantitative mineralogical characterization commonly involves the splitting of each sample in size fractions. A polished section is prepared from each size fraction and studied with the mentioned advanced instruments. Size fractionation was indicated as the first step of sample preparation for mineralogical liberation studies, many years [1] before the development of instruments for automated mineralogy. Each size fraction is mounted in epoxy resin, polished and used for the quantitative mineralogical characterization. The method to mount the size fraction in epoxy resin must be such that the resulting polished surface is as representative as possible of the three dimensional sample. The use of size fractions to prepare polished sections reduces complications in making representative cross sections of particles with large size differences. Also it simplifies the application of stereological corrections to the measured mineralogical liberation. The stereological corrected data and the weight proportion of each size fraction are used to reconstruct the data for the whole sample. However, this implies that one sample produces several products; commonly the sample is fractionated into five or six size intervals. This increases the cost and the complexity of the quantitative mineralogical studies. For many years, many of the professionals involved in these mineralogical characterization studies have wondered if it is possible to perform quantitative mineralogical characterization using un-sized samples. This paper presents a comparative case study of data obtained from sized samples and from unsized samples.
The case study is from a concentrator plant in Canada that processes a base-metal ore with pyrite, galena, sphalerite, chalcopyrite and siliceous gangue. The processing of the ore requires quite a complex flotation plant. Figure 1 shows a very simplified flowsheet of the flotation plant. The plant first involves a CuPb rougher flotation circuit where a CuPb concentrate is produced, this concentrate is further processed by flotation to separate the copper concentrate and the lead concentrate. The tailings from the CuPb rougher circuit are further processed by flotation to obtain a zinc concentrate and the final tailings. This plant experienced CuPb-ZnFe selectivity problems. For many years, it was considered that the problems of selectivity were due to lack of liberation of the base metal sulphides, thus the general trend was to move to grind finer (from 80% −60 µm ··· to 80% −45 µm ··· to finer). Despite this, the CuPb-ZnFe selectivity problems were not satisfactorily resolved. A quantitative mineralogical characterization study was performed at CANMET Mining to further understand the problem. This was a rare case where the client had both the budget and the scientific curiosity to request that the quantitative mineralogical characterization should be performed with both the un-sized samples and the size fractionated samples.
The instrument used was the MP-SEM-IPS developed at CANMET Mining for quantitative mineralogical characterization studies. The MP-SEM-IPS system was originally assembled in 1984 and first reported by Petruk in 1988 [2]. The system has been updated several times, and presently, it is based on a KS400 image analyzer (ZEISS), hosted in a modern computer and interfaced to an electron microprobe (JEOL 733) with two types of X-ray detectors: four detectors for wavelength dispersive analysis (WDS) and one XFlash silicon drift chamber detector (SDD) for energy dispersive analysis (EDS). The SDD is capable of a high X-ray count rate of up to 400,000 counts per second. The MP-SEM-IPS system can identify minerals by any combination of backscattered elec-

Figure 1. Simplified flowsheet of a Cu-Pb-Zn flotation plant.
tron (BSE) images and X-ray data (WDS & EDS).
The study of the flotation plant involved many samples, under various different regimes. The results of this study were reported to the client [3] and were published in a much summarized form [4,5]. The comparative results of the un-sized and the sized samples were only partially published [6]. Despite the differences between the MP-SEM-IPS and the modern QEM-SCAN and MLA instruments, it is considered that these comparative results for the un-sized and size fractionated samples should be interesting for the researchers performing studies of quantitative automated mineralogy. For simplification the results of only the key samples are presented in this paper.
2. Methodology
2.1. Sample Preparation
The samples around the flotation rougher lead concentrator circuit are presented. These samples are the feed, the concentrate and the tailings of this rougher circuit.
One representative portion of the samples was left unsieved. Another representative portion of the samples were sieved into six size fractions using the following intervals: +75 µm, 53 to 75 µm, 37.5 to 53 µm, 26.5 to 37.5 µm, 26.5 + 20 µm and −20 µm. Table 1 gives the weight distribution into each size fraction. Polished sections were prepared for each of the un-sieved samples and also for their respective size fractions. In the preparation of the polished section, the samples were mounted into epoxy resin using a method to obtain a near monolayer of particles on surface of the section. The epoxy resin is made of five parts of Araldite 502 and one part of hardener HY 956 (CIBA-GEIGY). The liquid resin mixture was degassed for ~3 minutes using a vacuum oven at 40˚C. A cylindrical mould of 31 mm diameter was used and approximately 400 mg of sample were mixed into the mould with only a few drops (~1 g) of degassed resin,
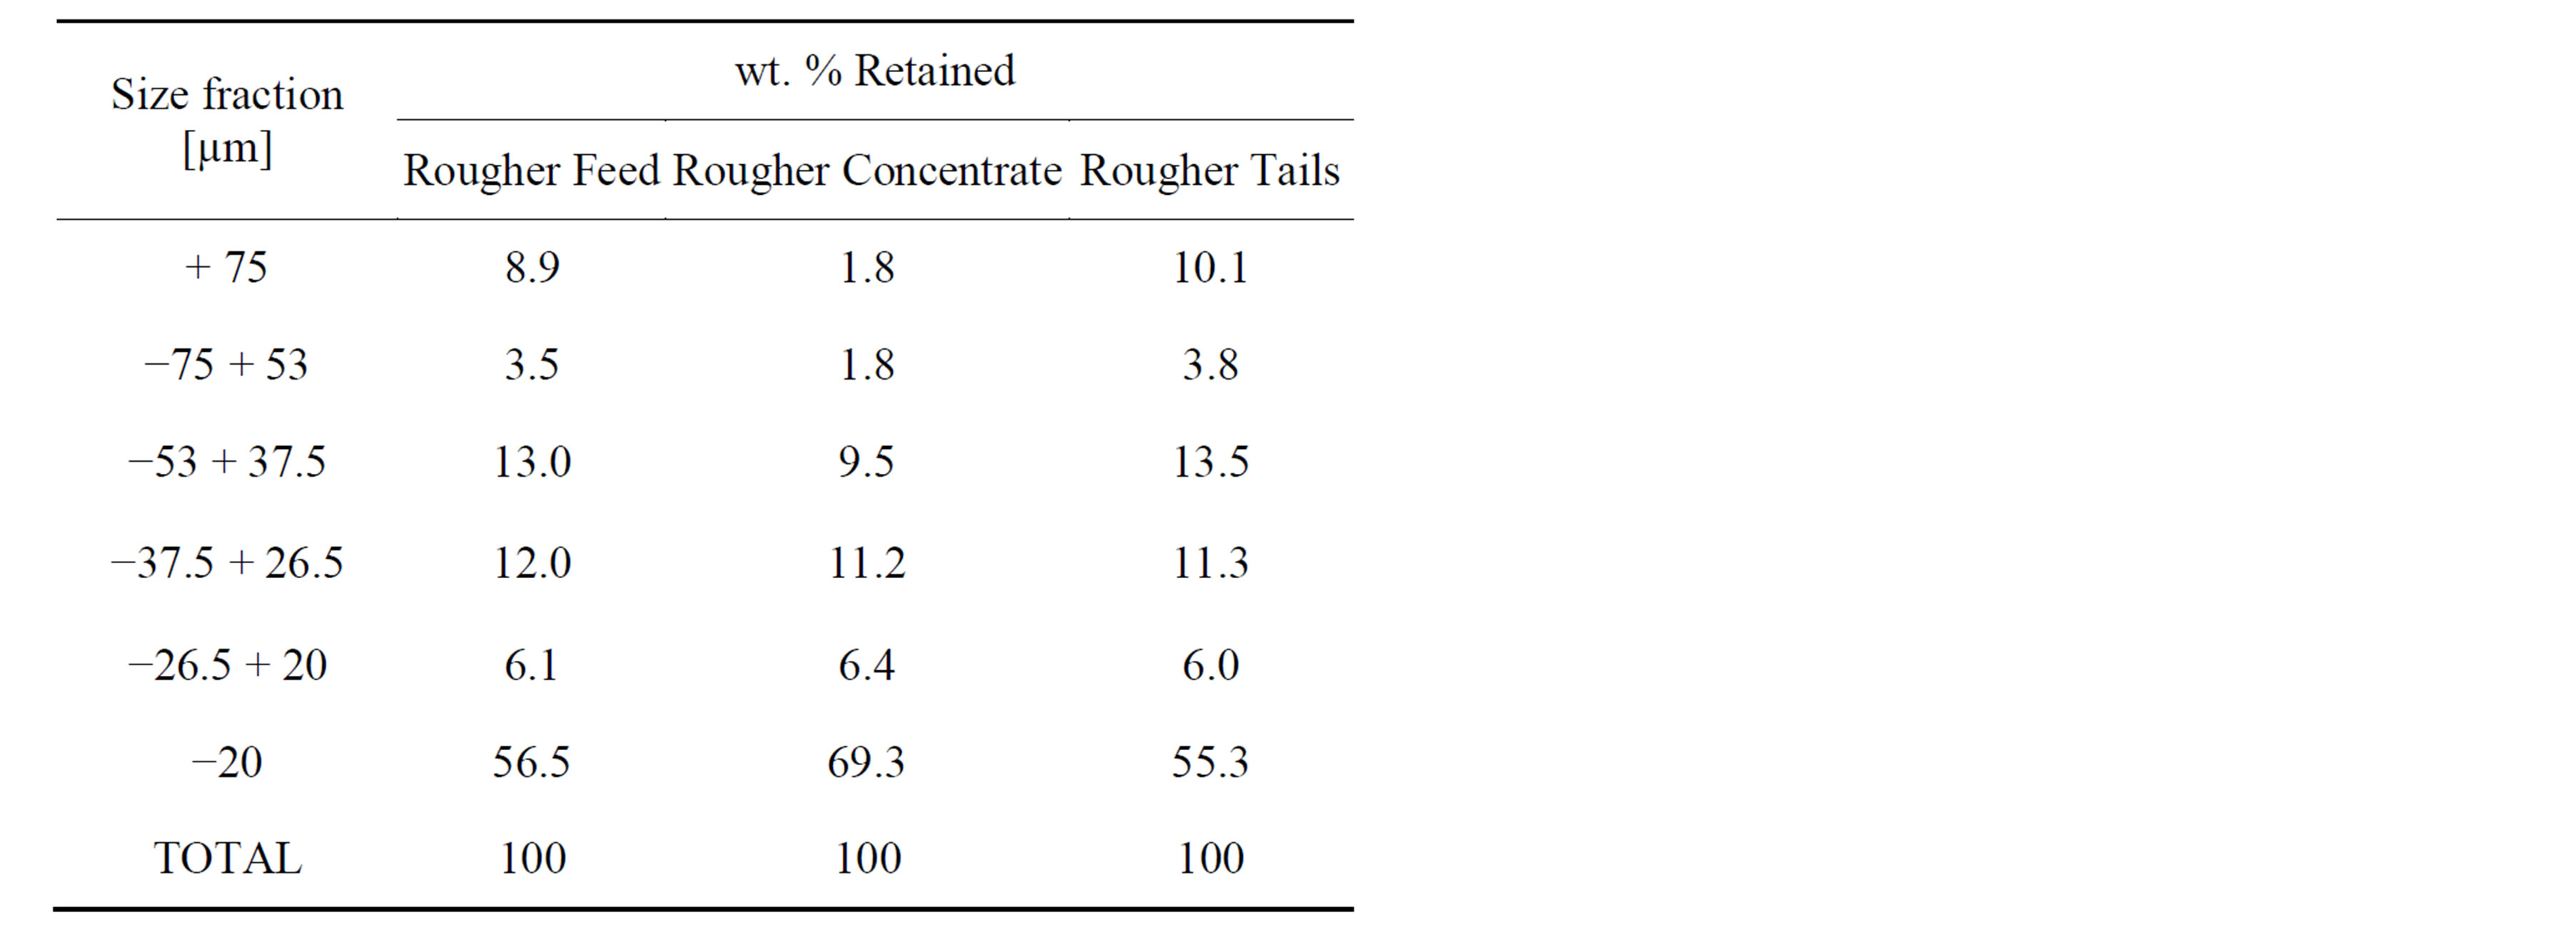
Table 1. Weight distribution into each size fraction of the samples.
allowed it to harden for 1 hour and filling the rest of the mould with degassed liquid resin. After 24 hours of hardening, the solidified resin cylindrical block was demounted and polished using standard techniques for minerals [7]. The plane grinding was done with an impregnated diamond (15 µm) disk and the polishing was done using successive diamond abrasive suspensions of 9, 6, 3 and 1 µm on Pelon (or Textmet) paper.
2.2. Image Analysis
A thin carbon coating (~10 nm) was applied onto the polished sections, which were studied using the MP-SEMIPS image analyzer at CANMET. A specific image analysis program was written to determine the mineral quantities, the mineral liberation and the apparent particle and grains sizes. The general methods and approaches used to make the image analysis program are given somewhere else [8].
The image analysis program to determine the mineral quantities and the mineral liberation used only the backscattered electron (BSE) images. With polished sections, the grey level of the BSE images is a function of the average atomic number of the mineral grains. The electron microprobe is equipped with a beam stabilizer that, every second, checks and maintains a constant beam current. Thus, during all the run, the grey level range of each mineral is maintained constant. The operating conditions for the electron microprobe were 20 kV of accelerating voltage and 15 nA of beam current. Under those conditions, it was possible to use grey levels of the BSE image to classify the minerals of interest into the following groups:
• g group: Non-sulphide gangue minerals, silicates and carbonates, composed mainly of quartz, plus some calcite and minor proportions of dolomite and ankerite
• ox group: Oxide minerals, composed mainly of ilmenite, rutile, hematite and magnetite
• py: Composed mainly of pyrite plus traces of marcasite
• po: Composed mainly of pyrrhotite
• cp: Composed mainly of chalcopyrite
• sp: Composed mainly of sphalerite plus traces of bornite
• asp: Composed mainly of arsenopyrite, plus traces of cobaltite
• ba: Composed mainly of barite
• ot group: Other minerals such as tetrahedrite, tennantite, cassiterite and stannite
• ga: Composed mainly of galena Each polished section was studied with a meander of 49 to 100 fields analyzing 15,000 to 20,000 particles. The image analysis program determined the quantities and the liberation of the minerals (or minerals groups) listed above. The average analysis time for each polished section was ~30 minutes.
Liberation data from size fractions can be subject to correction for stereological bias. However, sterological corrections may not be appropriate for liberation data from un-sized samples. For comparison consistency, all the liberation data is presented without any stereological corrections.
3. Results and Discussion
3.1. Assays
Table 2 gives the assays and distribution for lead and zinc. The table shows that the CuPb rougher concentrate has about 18% Pb but it also has a zinc assay that is similar to the one of the CuPb rougher tails. Nevertheless, about 84% of the zinc reports to the CuPb rougher tails.
3.2. Particle Size Distribution
Figure 2 gives the particle size distribution for the sieved (dashed line) and un-sieved samples (solid line). The particle size distribution for the un-sieved samples was solely obtained from the measurement made by the image analyzer. The image analyzer measures the area of each particle and calculates the particle size as the square root of the particle area. For random polished sections, the fundamental stereology theorem indicates that area percent is equivalent to volume percent and equivalent to weight percent. Thus, from the measured particle area and the total area of all measured particles, it is possible to calculate the weight percent of the sample at each size class, and then calculate the particle size distribution. The particle size distribution of the sieved samples, in the range between 100 to 20 µm of Figure 2, corresponds to the cumulative weight of the size fractions obtained by sieving. In addition, the measurements of the image analyzer performed on the –20 µm size fraction were used to extend the curves to the fine size range.
Figure 2 shows, that in general the particle size distribution of the un-sieved samples is shifted to a coarser size distribution. The cleaning of the binary images involved a number of erosion steps followed by twice as much dilations, followed by a Boolean AND operation with the original binary image. Removal of the obvious
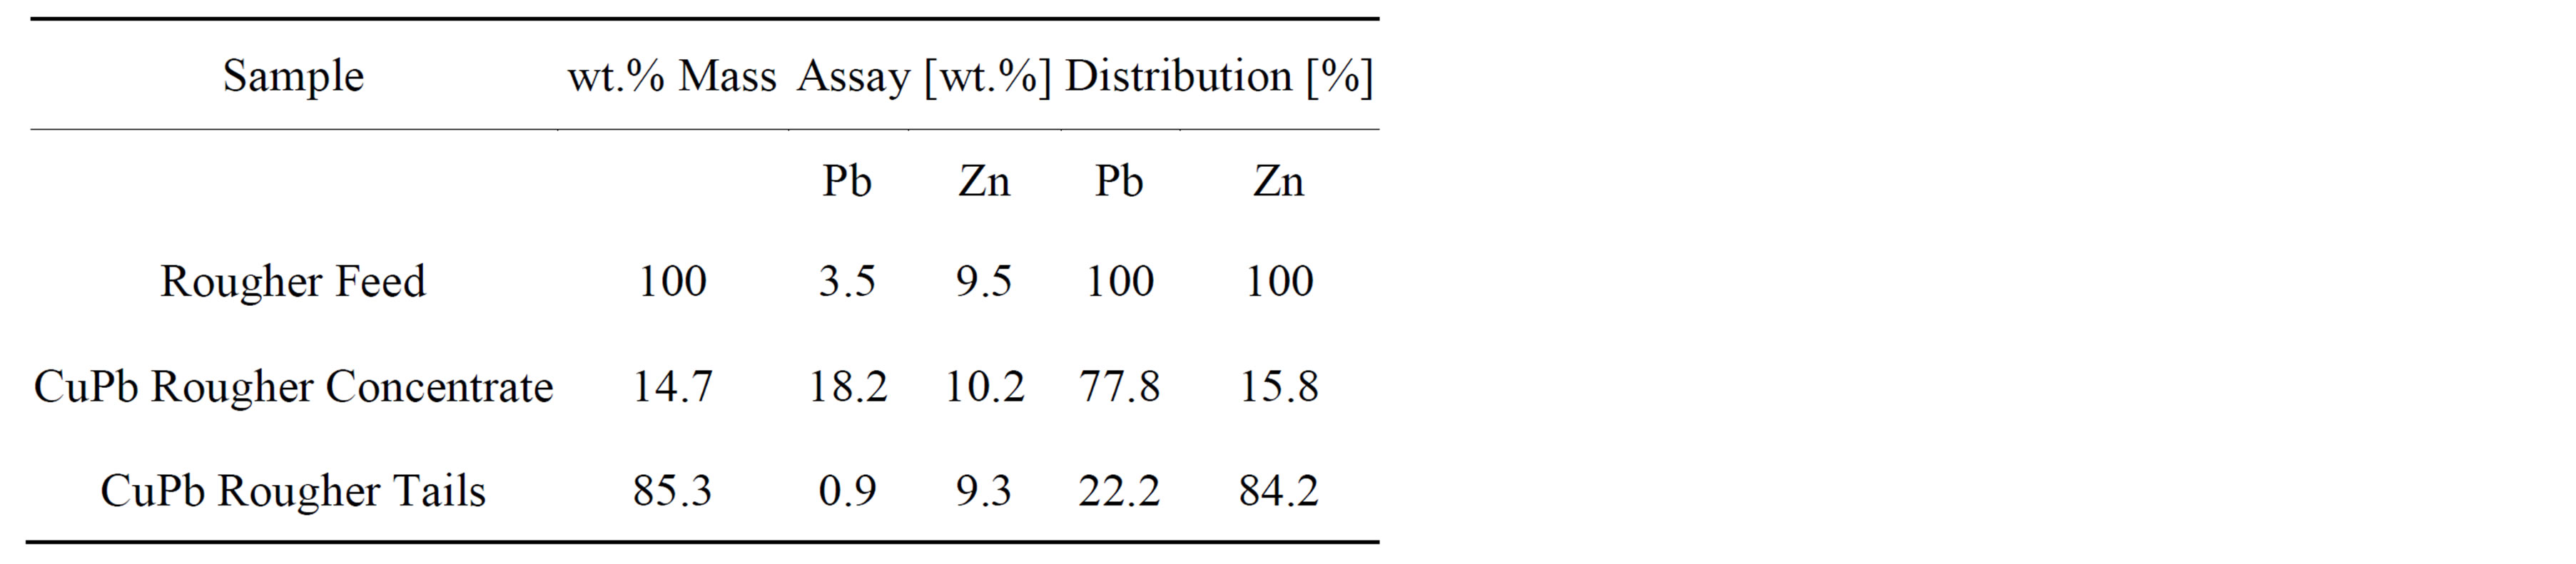
Table 2. Samples from the Cu-Pb rougher circuit.
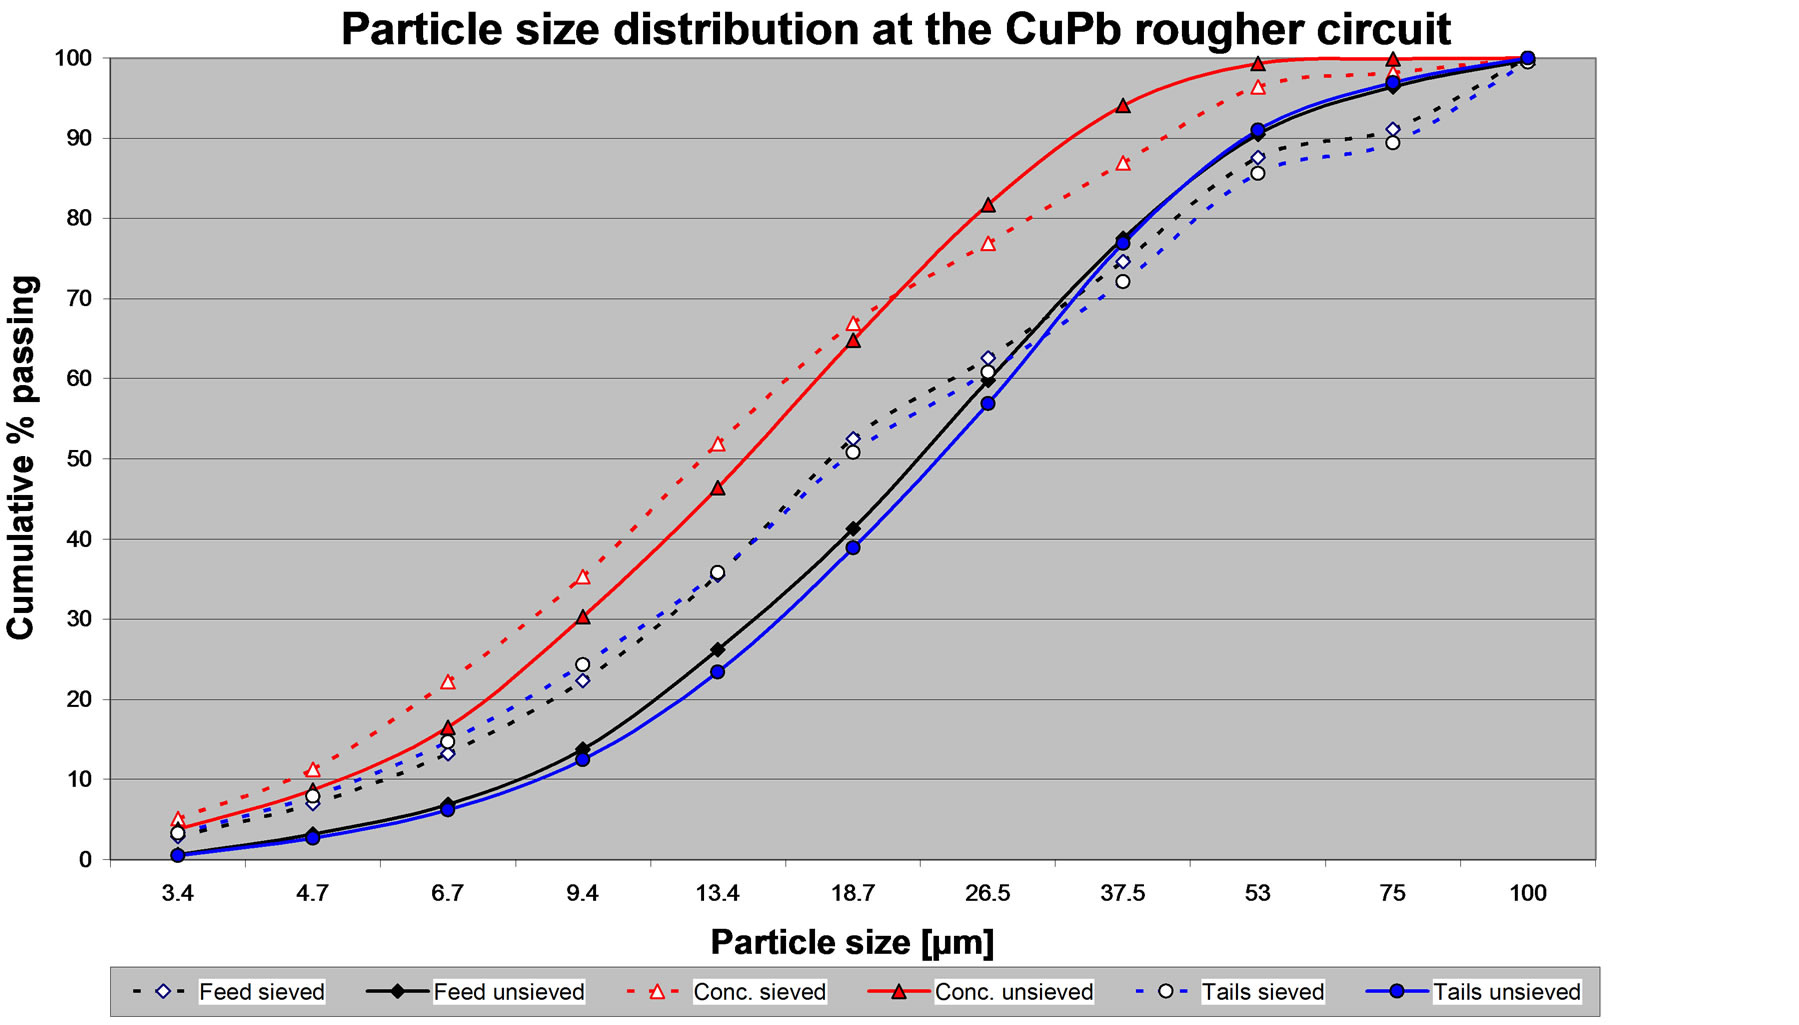
Figure 2. Particle size distribution for the sieved and un-sieved samples of the feed, the concentrate and the tailings of the CuPb flotation circuit.
segmentation artefacts controls the number of erosion steps used. The binary images of the un-sized samples contain a larger range of particle sizes than the binary images of the sized samples. It is possible that the required binary cleaning to remove artefacts of the large particles may also remove small particles. To reduce this problem the binary image of the particles was divided into two images, one containing particles larger than 2000 pixels and the other containing particles smaller than 2000 pixels. Then each of these images was subjected to the cleaning. Then the two clean binary images were combined into one single binary image. Despite this, it is obvious that the cleaning of the binary image deletes some of the small particles. This explains the coarser particle size distribution for the un-sized samples.
In mineral processing the P80 value is commonly used to describe the size of a material. The P80 is the size in micrometers through which 80% of the material passes. Taking the horizontal at 80% cumulative passing at Figure 2, it is possible to observe that the P80 value is similar for the sized and un-sized samples.
Figure 2 also shows that the particle size distribution of the feed and the tails is similar, whereas the particle size distribution of the concentrate is finer. The fact that the concentrate is finer is logical since it is made by particles carried by bubbles. Figure 2 indicates that for this campaign the plant was grinding the ore to P80 ~38 µm (400 mesh), which is quite a fine grind. This observation can be obtained by using either the data from the sieved or the un-sieved sample.
3.3. Mineral Quantities
As explained, mineral quantities were determined by the image analyzer for each of the ten mineral (or groups). For simplification purposes, only the results for some mineral of interests are presented. Figures 3 to 5 give the quantities of selected minerals of interest in the feed, the concentrate and the tailings respectively. These figures compare the mineral quantities obtained from the sized fractions, the un-sized samples and the mineral quantities calculated from the chemical assays.
Figure 3 shows the quantities of selected minerals in the feed to the CuPb flotation circuit. It is clear that there are differences in the amount of minerals determined from the sized sample or the un-size sample. However the trend observed for the sieved sample is similar to that observed for the un-sieved sample and both follow the same trend to the calculated mineral quantities using the assays. Figure 3 shows that the feed to the CuPb flotation circuit has more pyrite in the fine size fractions, whereas the amount of gangue minerals is more important in the coarse size fractions. The amount of sphalerite in the feed is approximately constant at ~15% irrespective of the size fraction. The amount of galena in the feed is low. These observations can be arrived by using either the data from the sieved or the un-sieved sample.
Figure 4 shows the quantities of selected minerals in the concentrate of the CuPb flotation circuit. Again, it is clear that there are differences in the amount of minerals determined from the sized sample or the un-size sample. However the trend observed for the sieved sample is
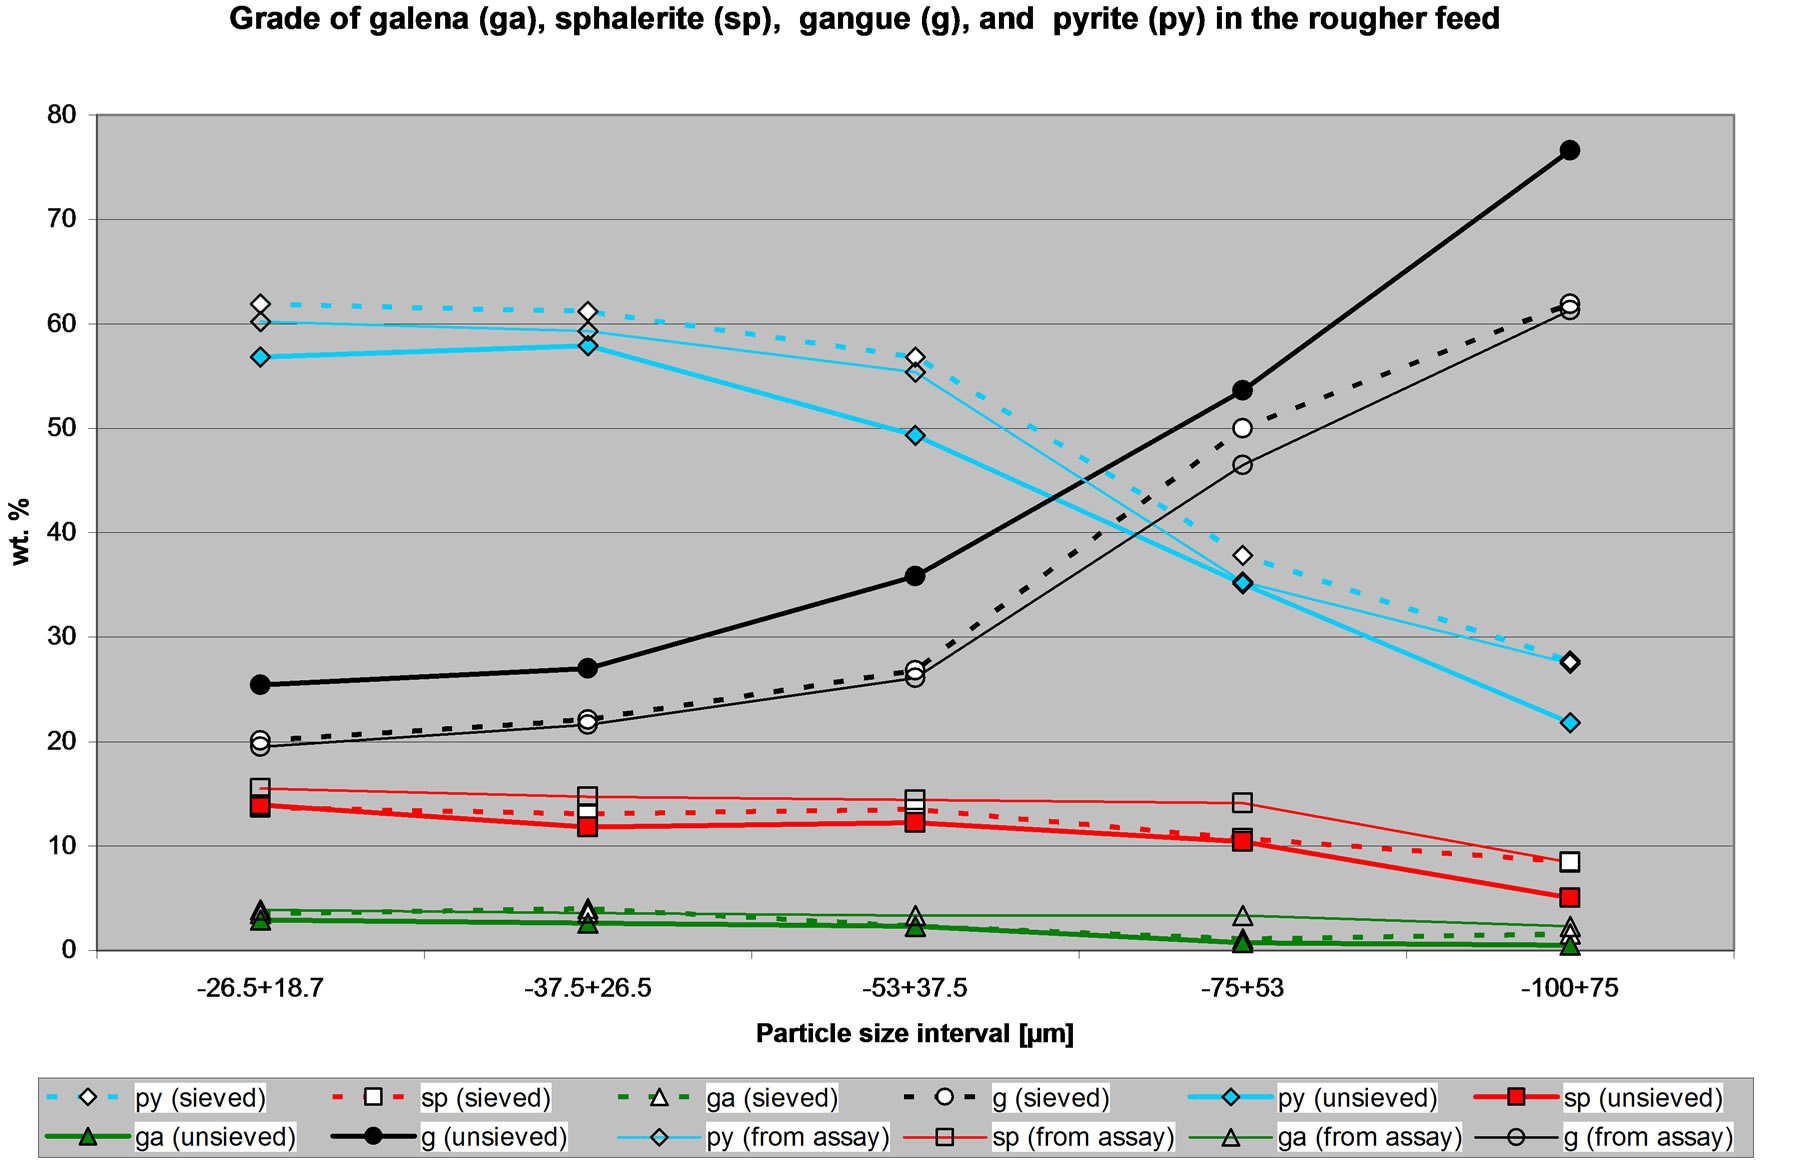
Figure 3. Quantities of selected minerals in the feed to the CuPb flotation circuit.
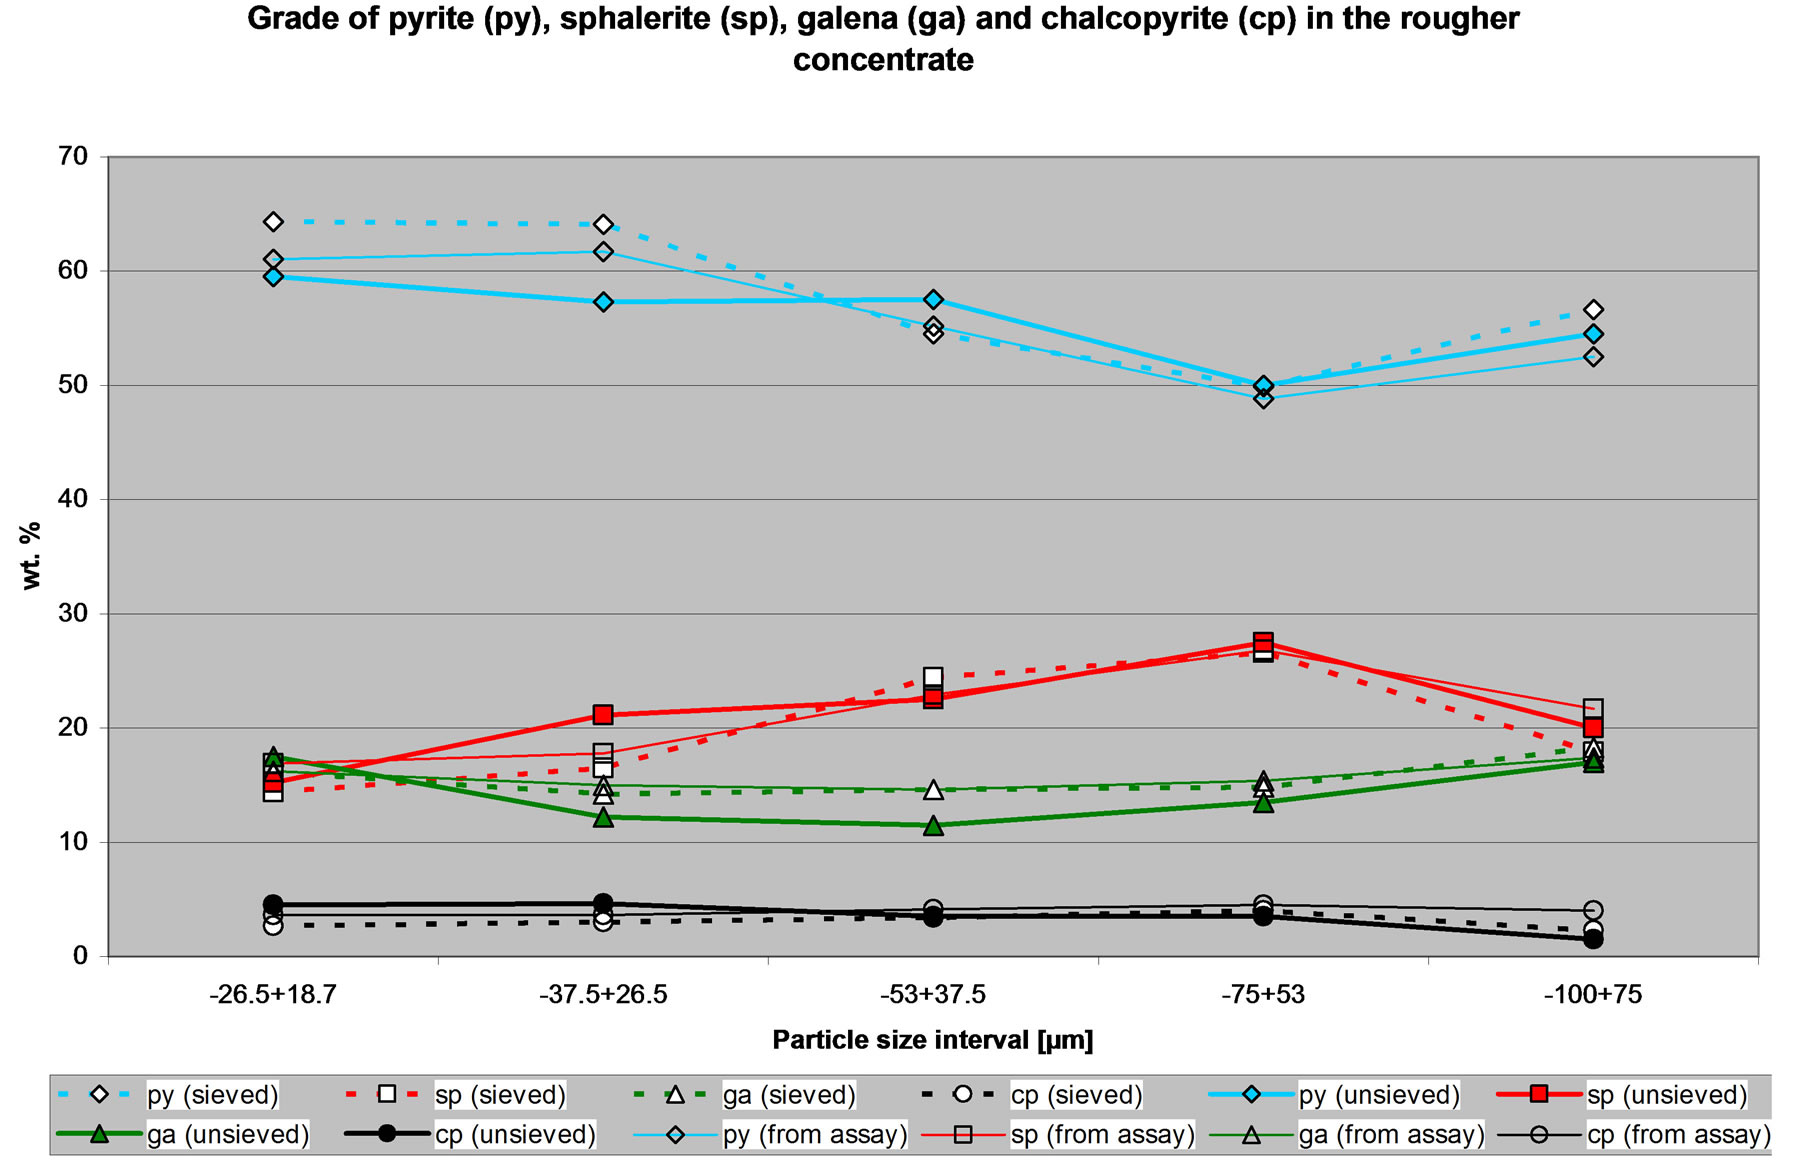
Figure 4. Quantities of selected minerals in the concentrate of the CuPb flotation circuit.
similar to that observed for the un-sieved sample and both follow the same trend to the calculated mineral quantities using the assays. As indicated, the objective of this circuit is to produce a concentrate containing the chalcopyrite and the galena and rejecting in the tailings the gangue, the pyrite and the sphalerite. Thus, this con-
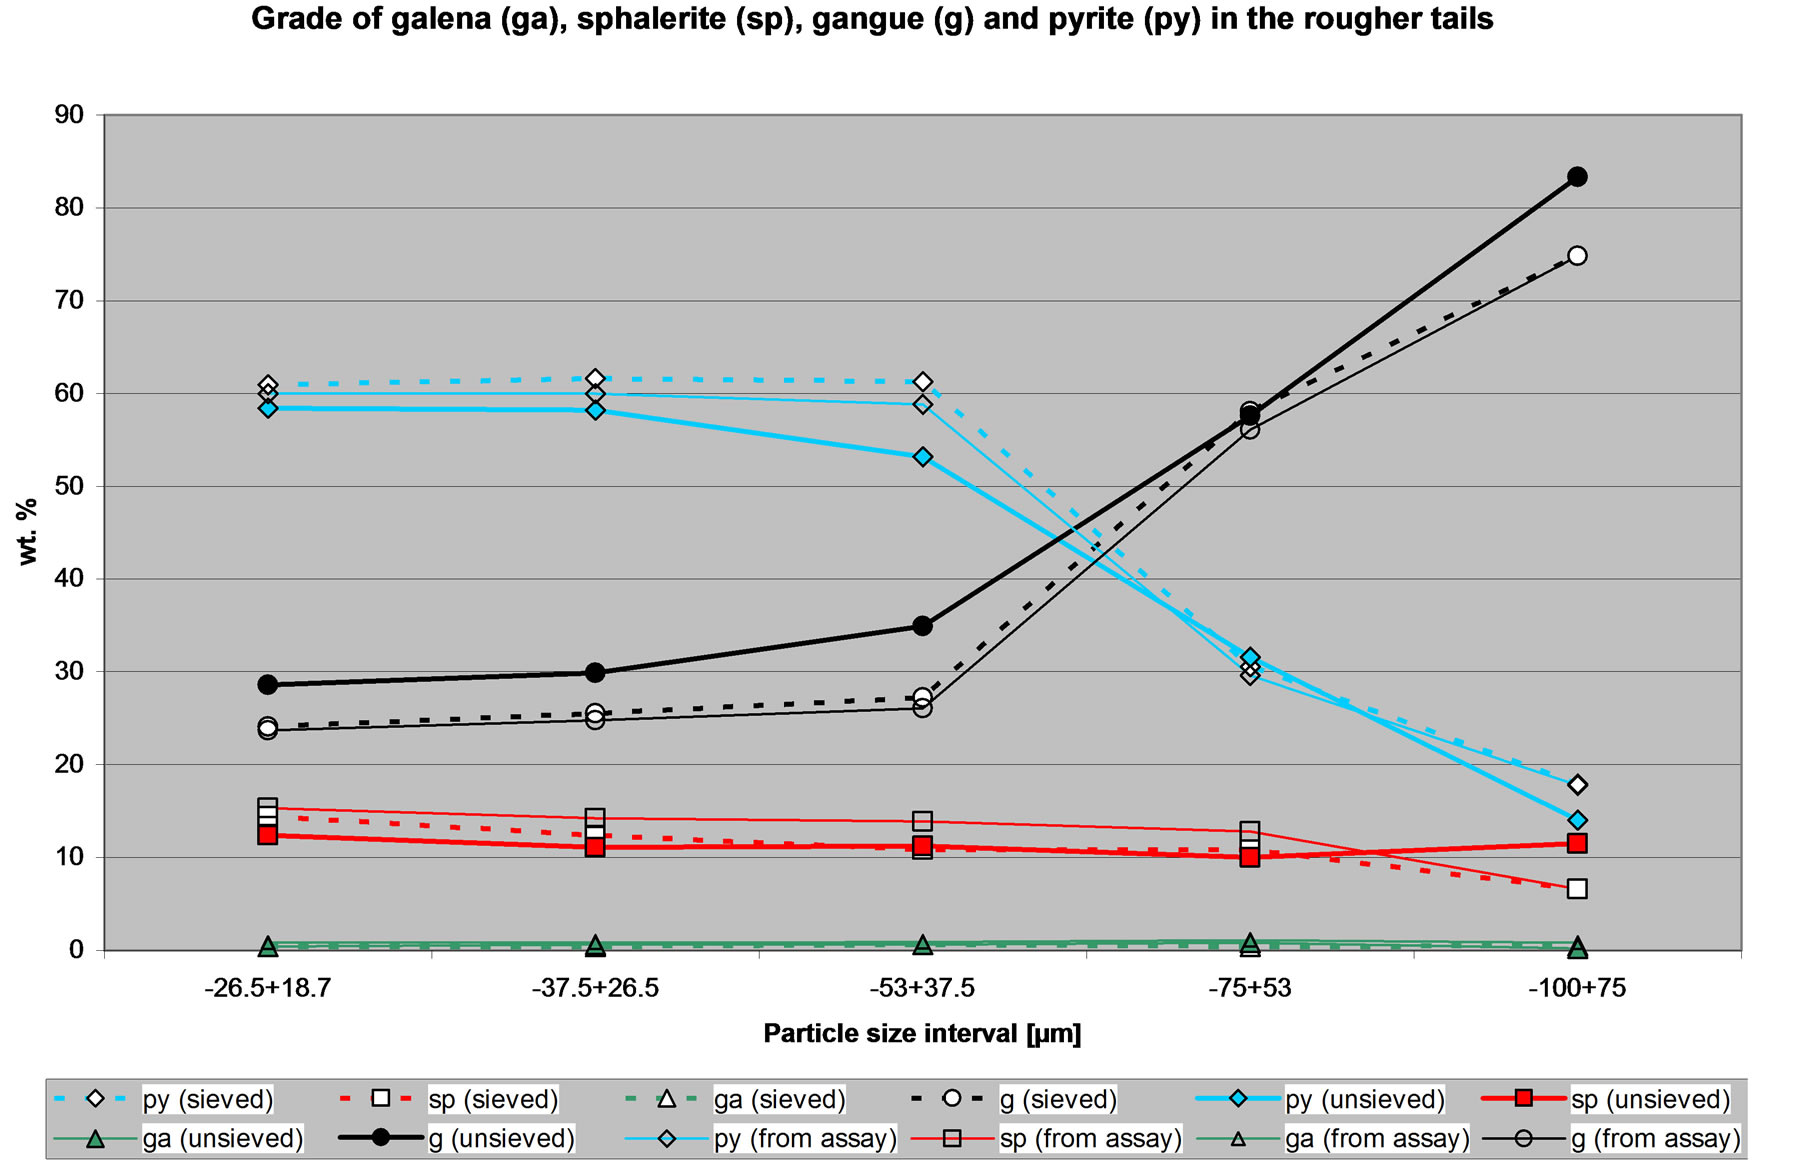
Figure 5. Quantities of selected minerals in the tailings of the CuPb flotation circuit.
centrate is supposed to be a CuPb concentrate. However, it has more pyrite and sphalerite than chalcopyrite and galena. The circuit is not performing as planned; Figure 4 shows that the circuit has CuPb-ZnFe selectivity problems. Again it should be noted that these observations can be arrived by using either the data from the sieved or the un-sieved sample.
Figure 5 shows the quantities of selected minerals in the tailings of the CuPb flotation circuit. Again, it is clear that there are differences between the amount of minerals determined from the sized sample and the un-size sample. However the trend observed for the sieved sample is similar to that observed for the un-sieved sample and both correspond to the calculated mineral quantities using the assays. It can be seen that the tailings are indeed rich in pyrite and gangue minerals, but the amount of sphalerite is similar, if not less than in the feed to the circuit. Thus this flotation circuit is failing to produce tailings rich in sphalerite. Figure 5 is showing the effect on the tailings of the CuPb-ZnFe selectivity problems. Again it should be noted that these observations can be arrived by using either the data from the sieved or the un-sieved sample.
3.4. Mineral Liberation
Figure 6 shows the liberation of galena in the feed, the concentrate and the tailings of the CuPb flotation circuit. As noted the liberation data is uncorrected for stereological bias. The CuPb circuit is a rougher flotation, thus this circuit should be capable of concentrating particles with at least 70% of the mineral of interest (galena or chalcopyrite) and reject particles with at least 70% of pyrite, sphalerite or gangue. In other words, for a rougher flotation, particles with at least 70% of a given mineral can be considered liberated.
Figure 6 shows differences between the liberation of galena from sized and from the un-sized samples. The specific amount of galena that is liberated in the feed, concentrate and tailings is different if the data obtained from the sieved or the un-sieved samples is used. However, in general it is possible to state that the liberation of galena in the feed is high, the concentrate is pulling particles with a high liberation degree, and the tails contain particles with a very low liberation degree. The rougher flotation circuit is working well with respect to the galena. These general observations can be made with either the liberation data from the sieved or the un-sieved samples.
Figures 7 and 8 show the liberation of pyrite and the liberation of sphalerite in the CuPb concentrate. Pyrite and sphalerite are unwanted in the rougher concentrate. Again, it is clear that there are differences between the liberation obtained from sized and from the un-sized samples. However, in general Figures 7 and 8 clearly show that the concentrate is pulling a lot of liberated pyrite and liberated sphalerite. It is clear that CuPb-FeZn
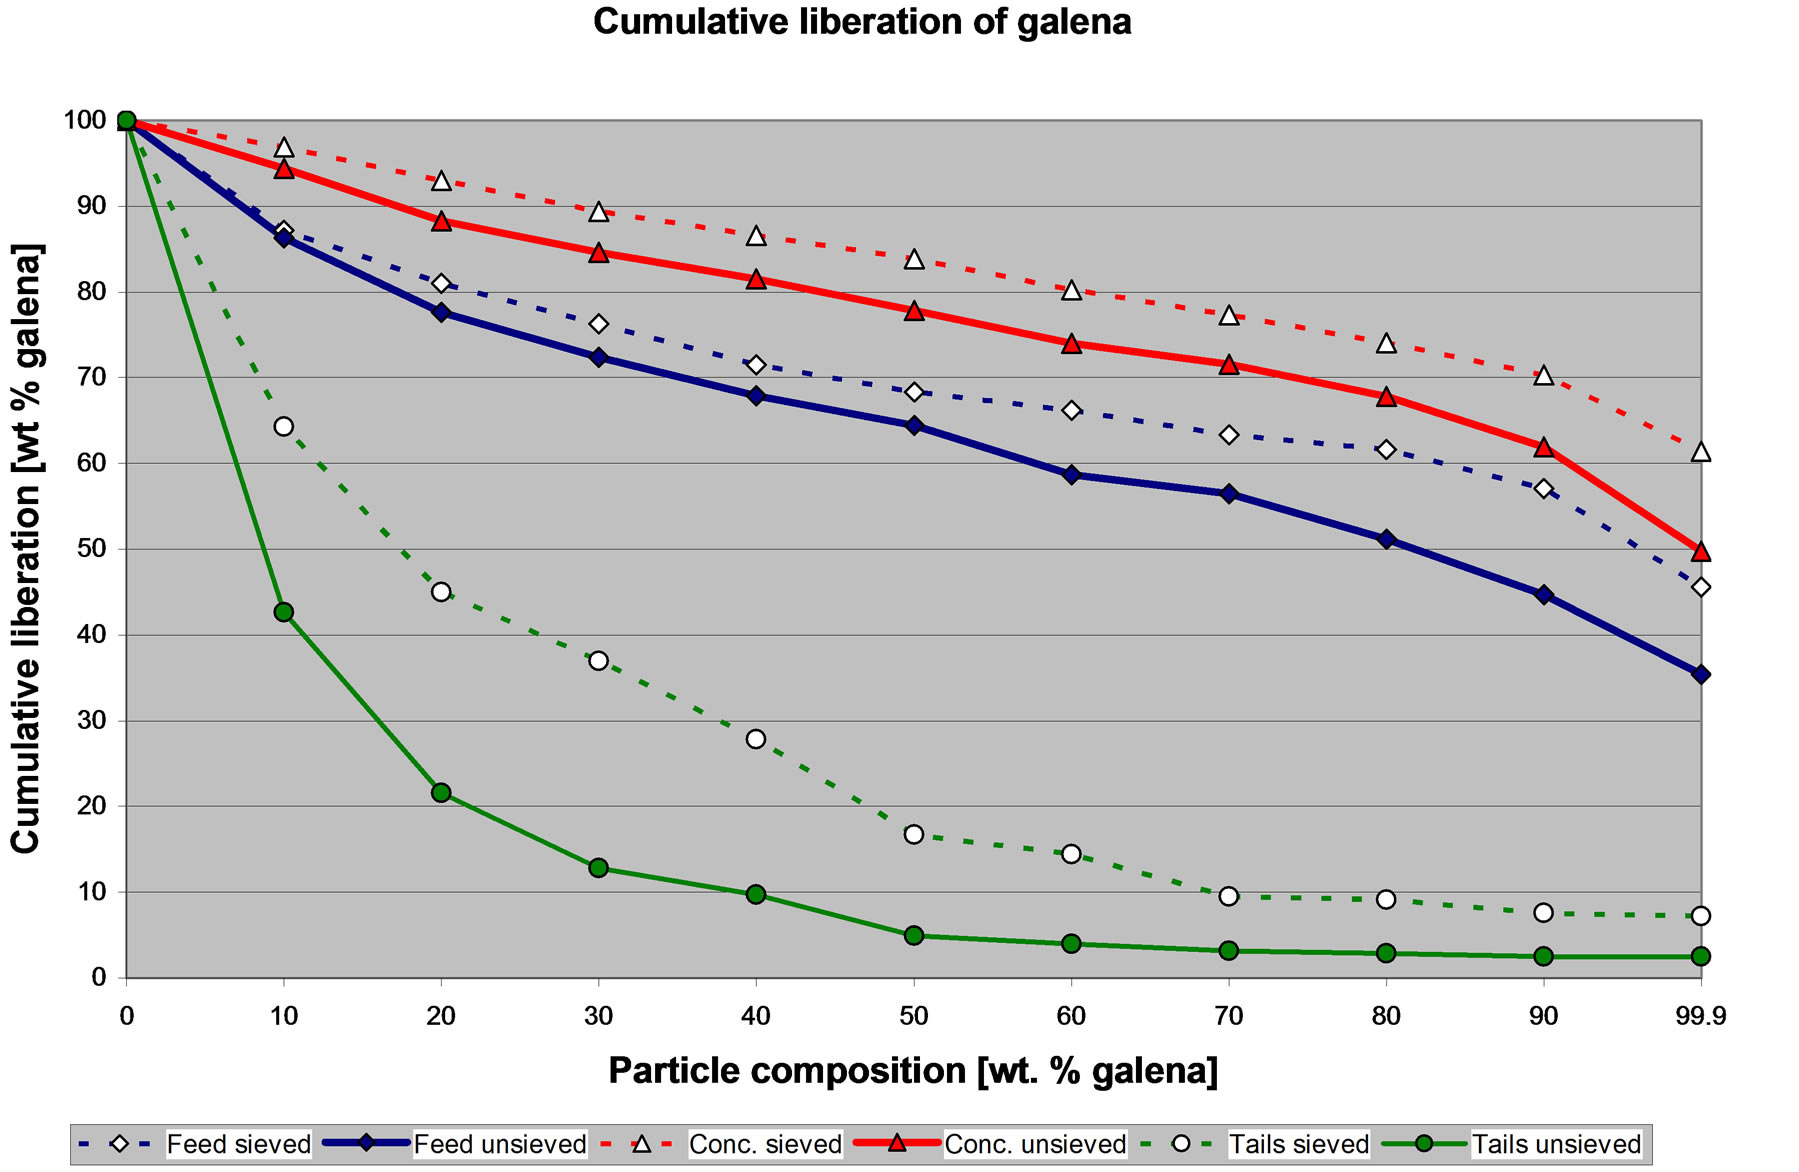
Figure 6. Cumulative liberation of galena in the feed, concentrate and tailings of the CuPb flotation circuit.
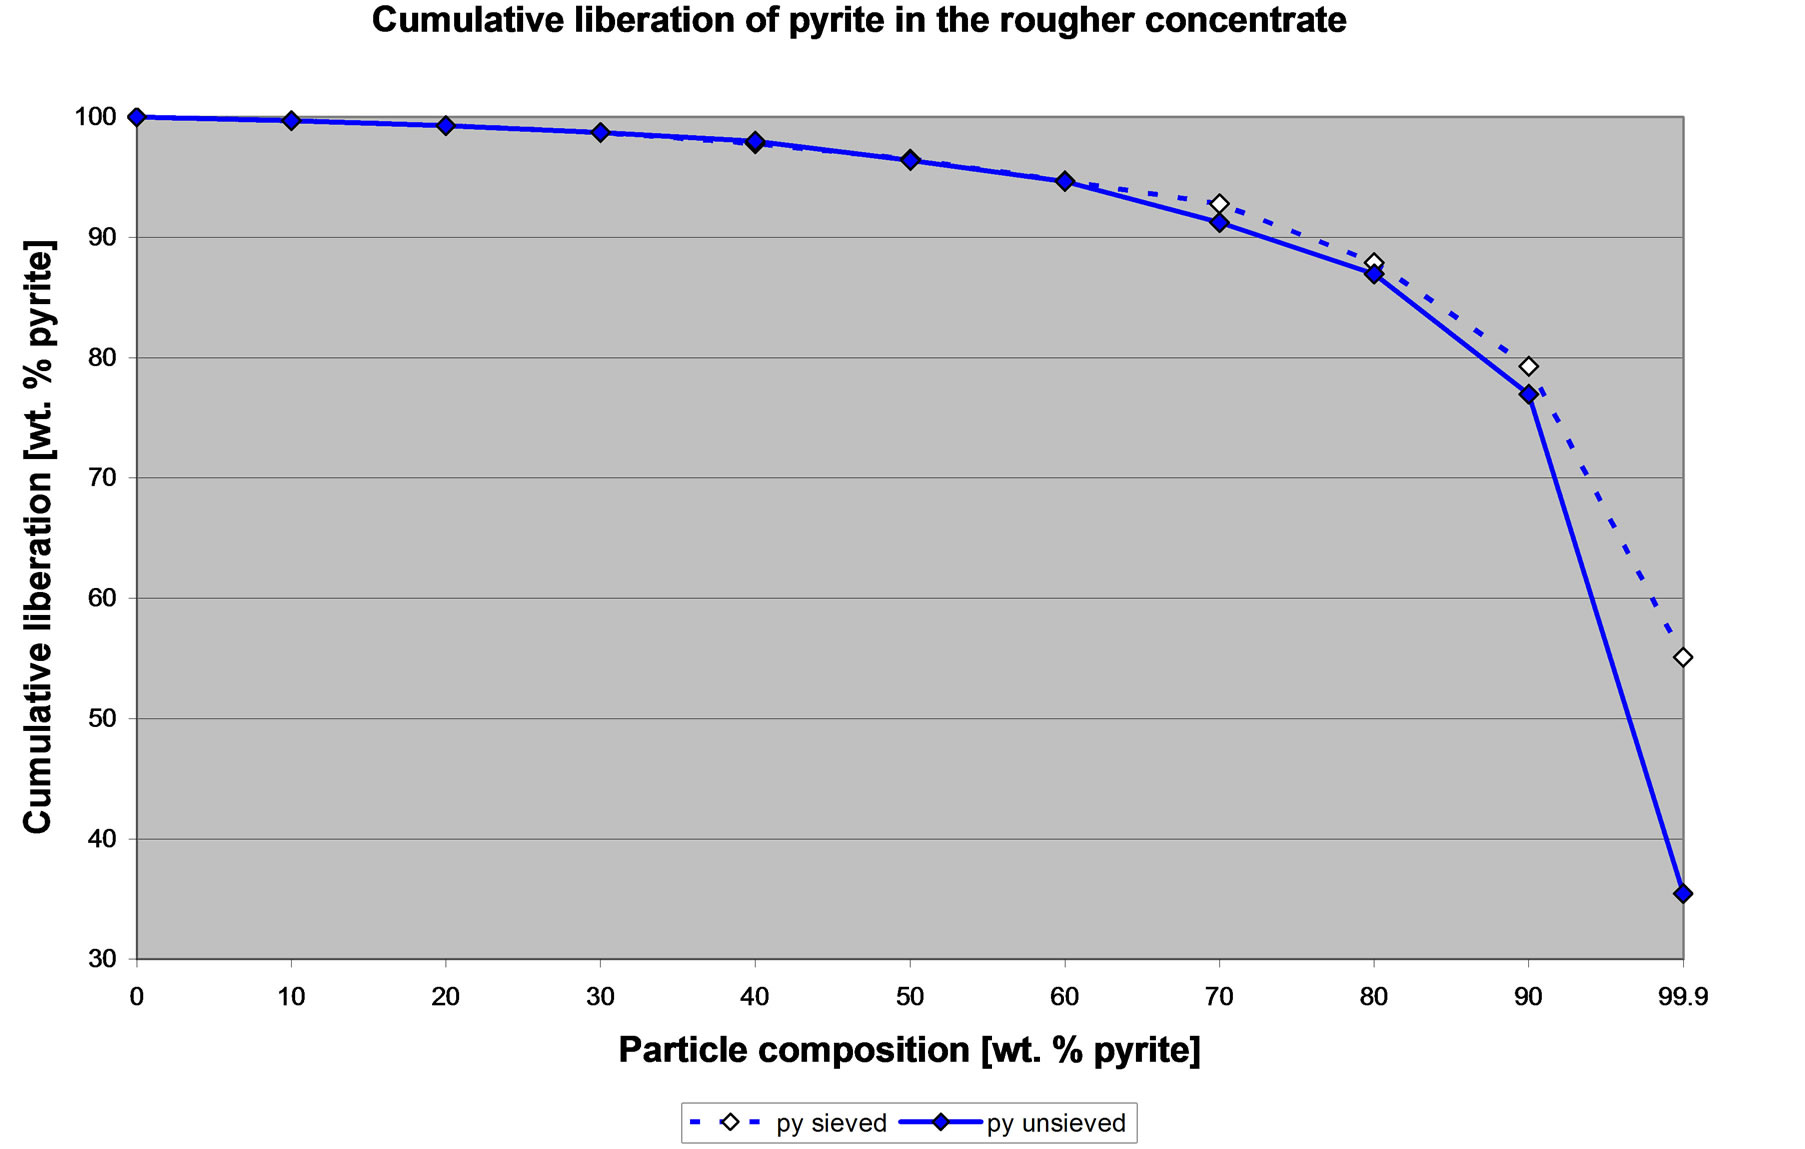
Figure 7. Cumulative liberation of pyrite in the concentrate of the CuPb flotation circuit.
selectivity problem is not due to lack of liberation and that grinding finer will not resolve this problem. The problem is that there is undesired activation of pyrite and sphalerite and thus these liberated minerals report to the concentrate. These general observations can be made with either the liberation data from the sieved or the

Figure 8. Cumulative liberation of sphalerite in the concentrate of the CuPb flotation circuit.
un-sieved samples.
The results of this research prompted another study to analyze the surface of the particles to determine the cause of the undesired activation of pyrite and sphalerite. It was found that the problem was undesired activation by lead ions. This launched a study to control the chemistry of flotation to reduce the unwanted activation of pyrite and sphalerite.
4. Conclusions
Detailed observation of the quantitative mineralogical data obtained using polished sections prepared with sieved and un-sieved samples indicates that there are differences in the mineral quantities and the mineral liberation. Nevertheless, it is noteworthy that it is possible to reach the same diagnostic conclusions with either set of data. This is possible because the study is comparing samples from around a processing node. If a complete set of samples around a processing node is obtained, then a comparative mineralogical study can yield similar conclusions by either using un-sized samples or sized samples.
For the illustrated CuPb rougher flotation circuit, both set of data clearly indicated that the CuPb-FeZn selectivity problem experienced by the plant was not due to lack of liberation and thus grinding finer will not resolve this problem. Undesired activation resulted in that the concentrate contained unwanted liberated pyrite and liberated sphalerite particles.
REFERENCES
- A. M. Gaudin, “Principles of Mineral Dressing,” McGarwHill Book Company, New York, 1932, 554p.
- W. Petruk, “The Capabilities of the Microprobe Kontron Image Analysis System: Application to Mineral Beneficiation,” Scanning Microscopy, Vol. 2, No. 3, 1988, pp. 1247-1256.
- W. Petruk and R. Lastra, “Mineralogical and Image Analysis Study of Samples from the Pb-Cu Circuit of Brunswick Mining and Smelting,” CANMET Mining Division Report 95-10 (CR), CANMET Mining, Ottawa 1995.
- D. Leroux, M. Cooper and W. Petruk, “Mineral Liberation Analysis of Brunswick CuPb Rougher Flotation Systems,” 28th Annual Meeting of the Canadian Mineral Processors, Ottawa, January 1996, pp. 494-506.
- R. Lastra, “Seven Practical Application Cases of Liberation Analysis,” International Journal of Mineral Processing, Vol. 84, No. 1-4, 2007, pp. 337-347. http://dx.doi.org/10.1016/j.minpro.2006.07.017
- W. Petruk, “Applied Mineralogy in the Mining Industry,” Elsevier, Amsterdam, 2000, pp. 64-66.
- C. J. Stanley and J. H. G. Laflamme, “Preparation of Specimens for Advanced Ore-Mineral and Environmental Studies,” In: J. L. Jambor, L. J. Cabri and D. J. Vaughan, Eds., Modern Approaches to Ore and Environmental Mineralogy, Short Course Series Volume 27, The Mineralogical Association of Canada, Ottawa, 1998.
- R. Lastra, W. Petruk and J. Wilson, “Image Analysis Techniques and Applications to Mineral Processing,” In: J. L. Jambor, L. J. Cabri and D. J. Vaughan, Eds., Modern Approaches to Ore and Environmental Mineralogy, Short Course Series Volume 27, The Mineralogical Association of Canada, Ottawa, 1998.