Journal of Minerals and Materials Characterization and Engineering
Vol. 1 No. 2 (2013) , Article ID: 29418 , 7 pages DOI:10.4236/jmmce.2013.12012
Effect of Silicon Additions on the Wear Properties of Grey Cast Iron
1Department of Metallurgical and Materials Engineering, University of Lagos, Lagos, Nigeria
2Department of Materials and Metallurgical Engineering, University of Ilorin, Ilorin, Nigeria
3Department of Metallurgical Engineering, Yaba College of Technology, Lagos, Nigeria
Email: jagunsoye@unilag.edu.ng
Received October 14, 2012; revised January 18, 2013; accepted January 29, 2013
Keywords: Microstructure, Interaction Effect; Hardness; Wear Transition
ABSTRACT
This paper investigates the wear characteristic of grey cast iron composition under dry lubrication conditions. The effects of sliding speed, applied load, time and percentage of ferrosilicon additions, on the wear rate of grey cast iron were studied. The set of experimental data were taken in a controlled and sequential manner. Scanning electron microscope was used to examine the morphology of the samples as well as the worn out surfaces. Linear regression equation and analysis of variances (ANOVA) showed that the main effect of silicon additions, load and speed variable are more pronounced on the wear behaviour of the grey cast iron. Also, the result showed that the additions of silicon improved the wear resistance of the grey cast iron as the wear parameters such as speed, load and time varied. The study showed that wear transition occurred at 3.2% silicon addition.
1. Introduction
Grey cast iron is inexpensive and it is readily available. Its specific characteristics such as low melting point, excellent castability and no freezing contraction enhances its capability for fabrication of complicated components by using the simplest and most economic methods. It is employed in a number of mechanical and structural applications because of its excellent engineering properties such as good thermal properties, vibration damping properties, and good machinability. Some engineering applications of grey iron are diesel engine components, including cylinder heads, piston rings, engine blocks where wear is a significant factor under wet lubrication. The properties of grey cast iron depend heavily on the graphite morphology and volume fraction. Graphite has a lamellar solid with open hexagonal structure. This structure is decisive for the particularly good absorption characteristics. Despite favourable characteristics of grey cast iron, sharp edge of flake graphites contributes to stress concentration and crack formation. This undesirable character resulted from the graphite morphology can also deteriorate the wear resistance of cast iron under applied shear stresses during dry sliding wear specially at high applied loads [1]. The existence of graphite in the microstructure reduces the strength since it decreases the size of the efficient section and causes notch effect as well. The deformation ability is negligibly small and the elongation at rupture is less than 1%. Still, its compressive strength is approximately 3 or 4 times of its tensile strength [2]. Grey iron microstructure is normally determined by the base iron composition, the solidification cooling rate and the inoculation process. In the production of quality cast irons the inoculation process is of vital importance. Silicon has been used as an innoculant in grey cast iron. The role of inoculation is to provide sufficient nucleation sites for graphite that is activated at low undercooling, thus promoting the formation of good type A graphite structures. Hence, inoculation is a means to change the otherwise undesired graphite forms into a more desired form. When comparing uninoculated and inoculated irons, differences in microstructure are easily revealed, this again will strongly affect the final mechanical properties of the casting. Several researchers have investigated the contributions of various elements to the properties of grey cast iron. For example, Boron has been found to extend the usefulness of grey cast iron by uniformly distributing the hard particles of cementite throughout the soft matrix of grey cast iron even in certain types of chilled castings [3] as well as improves the wear characteristic of grey cast iron [4]. The addition of nickel refines the pearlite and graphite structure of grey cast iron and improves toughness and evens-out hardness differences between section thicknesses. High hardness of white cast iron bars produced by addition of sodium chloride salt to grey cast iron has been recommended for wear resistance application [5]. Additions of SiC instead of FeSi as a silicon carrier affects variations in the thermal analysis characteristics and microstructure together with increasing fluidity as well as decreasing chill depth [6]. It is obvious from the literature reviewed above that extensive work has not been carried out on grey cast to assess its suitability for application in areas of abrasive wear under dry lubrication. If the toughness of grey cast iron can be improved through alloying, it can be used as liner plates or grinding media balls in low impact ball mills. Hence, this paper attempts to assess the wear behavior of alloyed grey cast iron under different load, speed and time.
2. Research Methodology
Two-number wooden patterns dimension (10.50 × 10.50 × 185) mm rectangular shaped were used to make five pair of cope and drag moulds. The mouldings sand were prepared from a mixture of dried fresh silica sand, water, bentonite and dextrin in accordance with BS14 standard. The five pairs of mould were labeled as Batch 1, 2, 3, 4 and 5 respectively. 10 Kg known quantity of grey cast Iron foundry returns were melted in a 40 kg crucible capacity and poured at 1270˚C into improvised moulds. The first batch which represents the control sample was poured into the mould labeled batch 1 without any alloy addition. Thereafter, a known quantity of 75% Ferro silicon granules were added to the remaining molten bath and heated up to 1282˚C, stirred manually with a dry wooden stick to facilitate a homogeneous bath and poured into the second mould labeled batch 2. This process was repeated for the remaining three batches of moulds with increasing 75% Ferro silicon granule additions. This process was repeated for the remaining three batches of moulds with increasing 75% Ferro silicon granule additions. Necessary precautions were observed while casting to avoid defects in the castings and guarantee consistent pouring temperature. After pouring (1260˚C ± 60˚C), the castings were allowed to solidify and cooled in the mould to room temperature (40˚C) before they were carefully knock out, wire brushed to remove fused sand grain and the gating system knocked out. The cast bars were carefully fettled to the required dimension (10 × 10 × 180) mm and labeled to ensure traceability. From the cast bars (10 × 10 × 180) mm, sample representatives from each bar were cut taken and machined to standard charpy impact coupon for impact, Brinell hardness, and SEM test respectively.
2.1. Compositional Analysis
Samples are taken for compositional analysis from the five batches of casting produced. The results of the spectrometric analysis of the samples carried out with Hilger Analytical Direct Optical Light Emission Polyvac Spectrometer E980C are presented in Table 3.
2.2. Hardness and Charpy Impact Test
The hardness of the samples was determined using Brinell hardness tester carried out under a load of 60 kg and a dwell time of 10 seconds. The impact energy of the samples was determined using a Charpy Impact Machine (specification). The results of the hardness and charpy impact test are graphically represented in Figures 4 and 5 respectively.
2.3. Wear Test
The wear test was carried out on a 210 mm diameter surface 140 µm mesh emery paper mounted on pin-on-disc apparatus to investigate the dry sliding wear characteristic of grey cast Iron. Various wear parameters such as (speed, time and load) were varied during the experiment. Each sample was placed at 85 mm diameter from the centre of emery paper during the test. The initial weight of the samples was measured before and after each test with a measuring electronic scale with 0.01 mg accuracy. Prior to weighing, the worn out samples were cleaned with wool soaked in acetone and wear particles on the emery paper intermittently removed by compressed dry air blower. After running through a fixed distance, the samples were removed, clean with acetone, dried, and weighed to determine the weight loss due to wear. The differences in weight measured before and after tests give the wear loss of the samples. A parameter referred to as wear coefficient, defined as a measure of the efficiency of the material removed for the given amount of work done was used to define the wear severity and calculated using Equation (1). The wear test was carried out with variable sliding speed, time and load as shown in Table 1. Experiments were conducted as per standard 1.8 orthogonal array, with a view to investigate which of the design parameters; speed, load and time most significantly affect the dry sliding wear from the selected combinations. Equation (1) was used to calculate the wear rate.
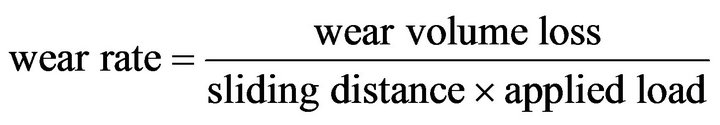 (1)
(1)
Factorial design and linear regression methods are commonly used in engineering analysis. It consists of data acquisition in a consecutive and controlled manner and execution of the experiments in order to obtain information about the behavior of a given process (wear). Two levels of each of the three factors were used for the statistical analysis. The levels for the three factors are entered in Table 1 and the treatment combinations for the two levels and three factors are tabulated in Table 2.
The model equation was obtained by representing the wear value by W, as a of function process parameters below:
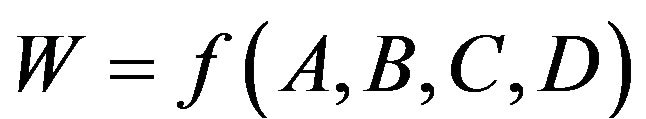 (2)
(2)
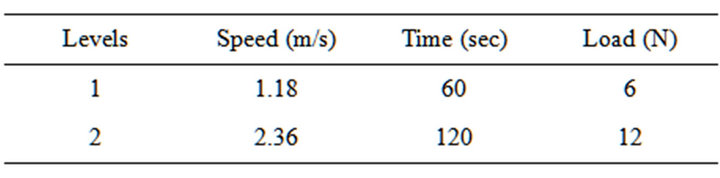
Table 1. Process parameter for the wear test.
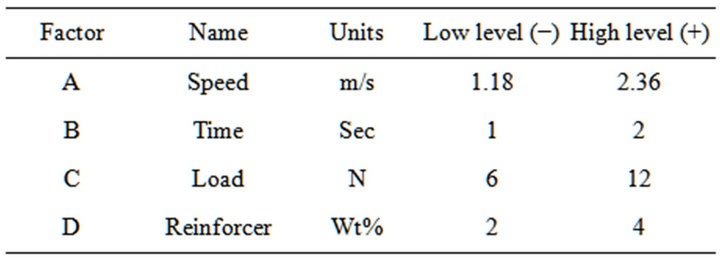
Table 2. Design parameter for the wear process.
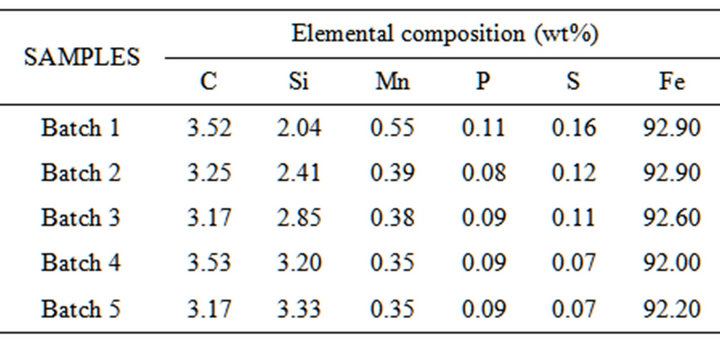
Table 3. Chemical composition of experimental grey cast iron (wt%).
Equation (1) represents the wear as a function of Sliding speed , time
  and, load
 , and
, and  is the percentage Ferro silicon addition.
The model selected includes the effects of main variables first-order and second-order interactions of variables. Hence the general model is represented as:
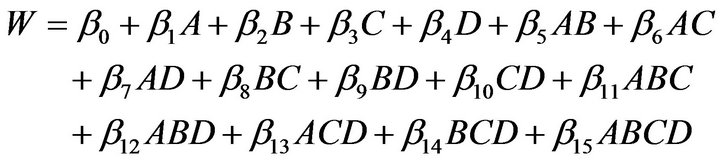 (3)
(3)
where  is average response of W and
  are coefficients associated with each variable A, B, C and interaction.
2.4. Microstructural Analysis
Scanning Electron Microscope (SEM), model EVOMA10 LaB6 Analytical VP-SEM was used to determine the morphology of the grey cast iron samples as well as the worn out wear surfaces respectively at 20 Kv. The results of the SEM micrographs are presented in Plates 1 and 2. Necessary precaution was observed so as to increase surface conductivity.
3. Results and Discussion
Plate 1(a) is the micrograph of the grey cast Iron sample
(a)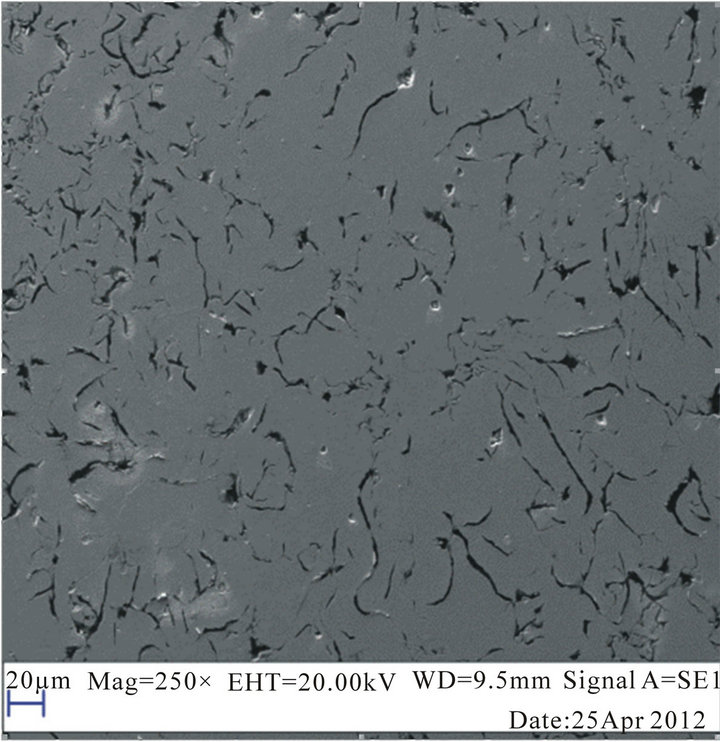 (b)
(b)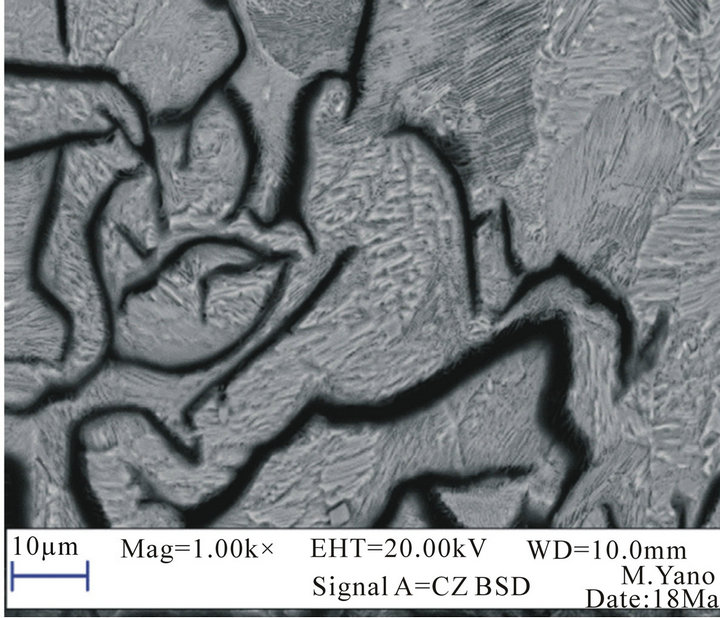 (c)
(c)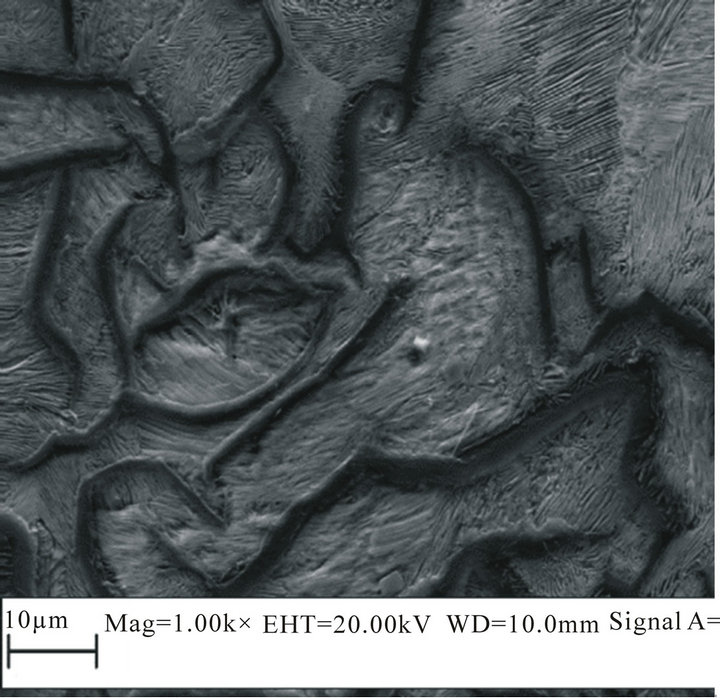 (d)
(d)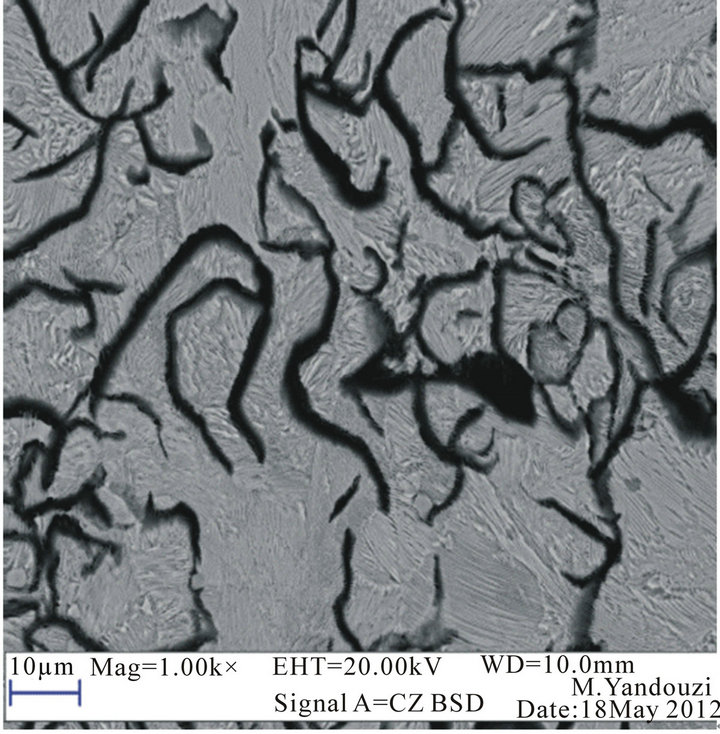
Plate 1.. SEM micrographs of grey cast iron; (a) 2.04% Si (b) 2.41% Si (c) 2.85% Si (d) 3.3% Si additions.
without deliberate additions of ferro silicon. It is the sample with the lowest percentage of silicon. The microstructure represents a typical grey cast iron with large volume of soft graphite flakes embedded in the matrix of the microstructure. Therefore, it is also characteristically not hard (235HRB).
Plates 1(b)-(d) represents grey cast iron with 2.41% Si 2.85% Si & 3.3% Si additions respectively. It can be seen from Plates 1(b) and (c), and d that the volume of the soft graphite flakes increases with increasing silicon additions.
Plates 2(a)-(d) represent the morphologies of the worn out surfaces of grey cast iron at 2.04% Si, 12.25N; 2.41% Si, 12.25N; 2.85% Si, 12.25N and 3.3% Si, 12.25N respectively. As expected, surface damage increased with increasing silicon content. There is progressive and systematic decrease in the hardness value as the percentage silicon increases. There appear to be an orange peel effect at the surface of the worn-out wear samples as a result of the soft graphite flakes on the microstructure and this orange peel effect increases with increasing alloying. Plate 3 represents the fracture surface of the broken piece of impact test sample at the highest level of silicon addition of 3.3%. The fracture surface revealed high level of plastic deformation as can be seen by the severe distortion of the graphite flakes.
3.1. Wear Test Result
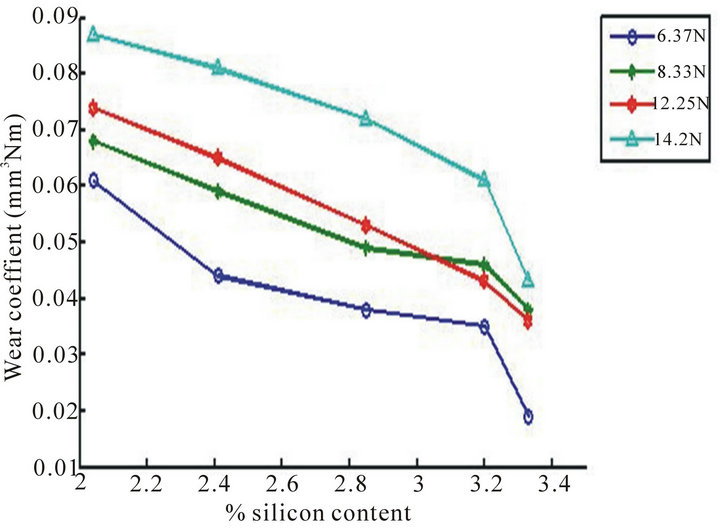
From Figure 1, it can be seen that as the silicon content increases, the wear coefficient decreases with increasing load and the samples with the lowest silicon additions gave the highest wear coefficient . From Figures 2 and 3, under varying applied load and sliding speed, the wear coefficient behaves in a similar manner to Figure 1. It appears from Figures 2 and 3, that as the speed and applied load are varied, the change in the wear coefficient is most pronounced compared to changes observed when the time is varied. This observa-
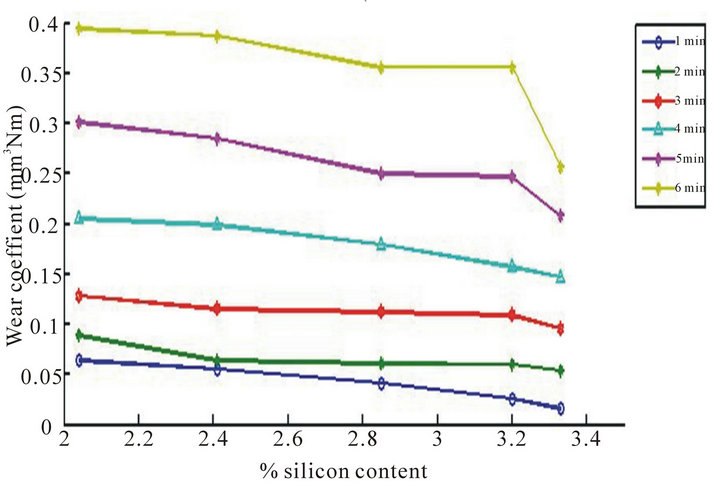
Figure 1. Change in wear coefficient with increasing time.
(a) 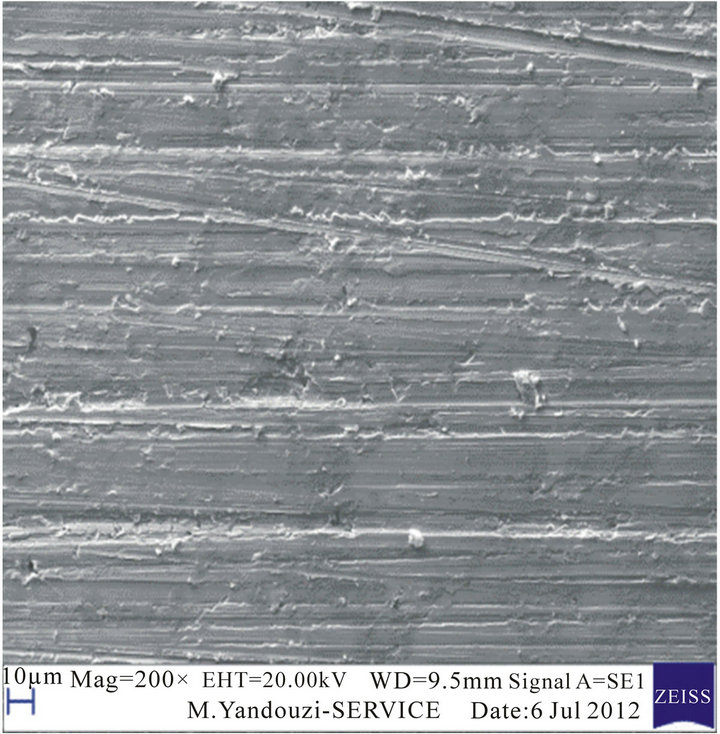 (b)
(b) 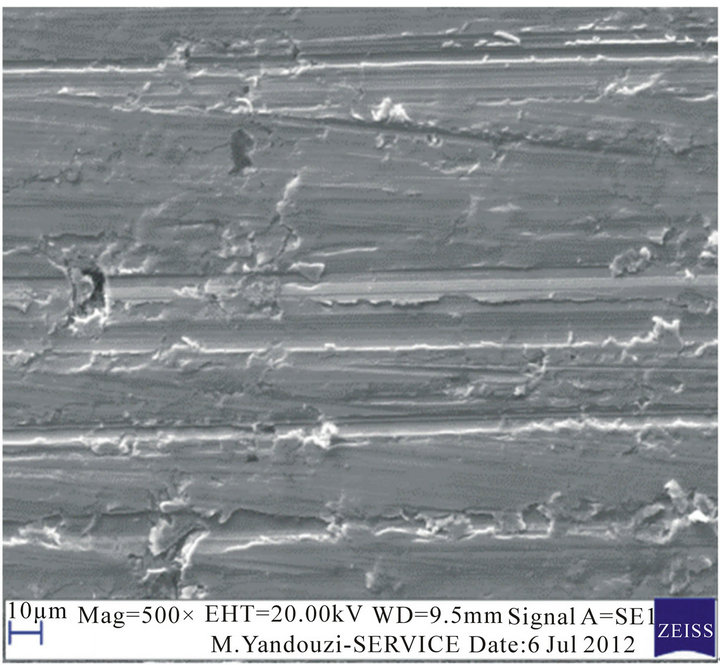 (c)
(c)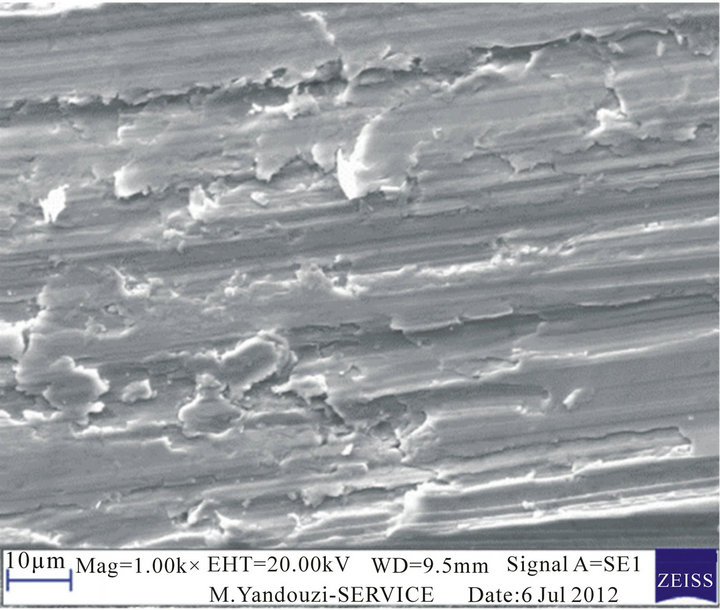 (d)
(d)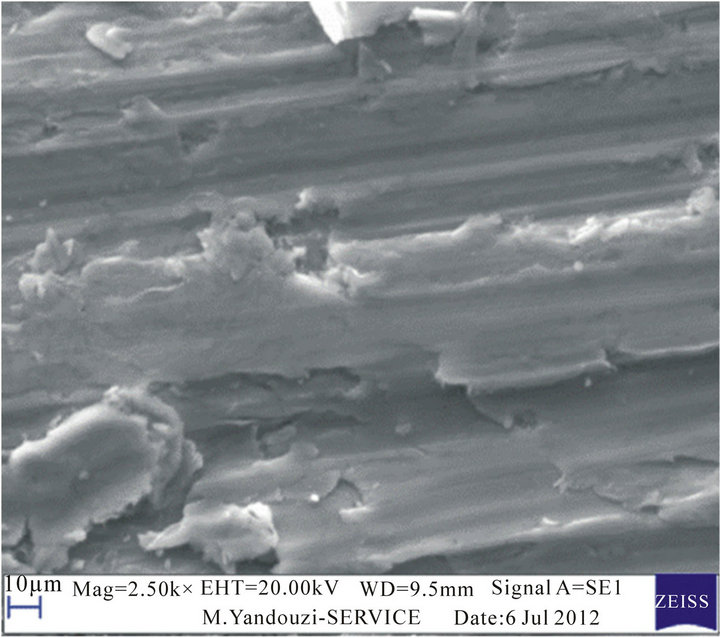
Plate 2.. SEM micrographs worn out surface of grey cast iron: (a) 2.04% Si (b) 2.41% Si (c) 2.85% Si (d) 3.3% Si additions.
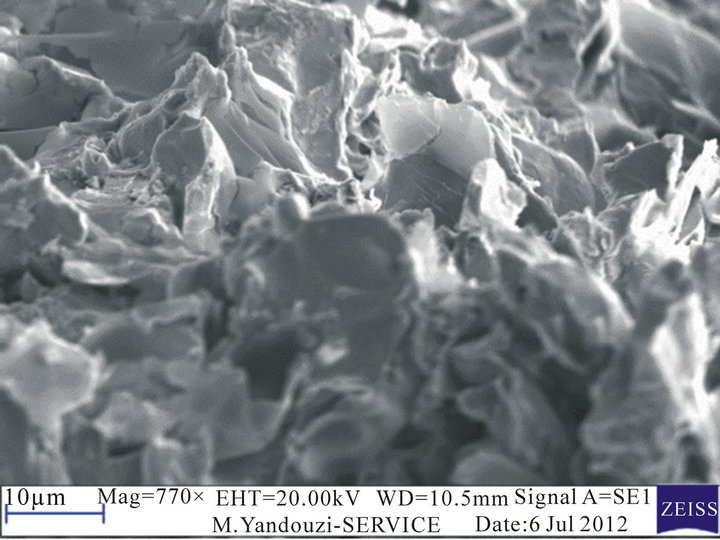
Plate 3.. Micrograph of the fractured surface from the impact test.
 (a)
(a)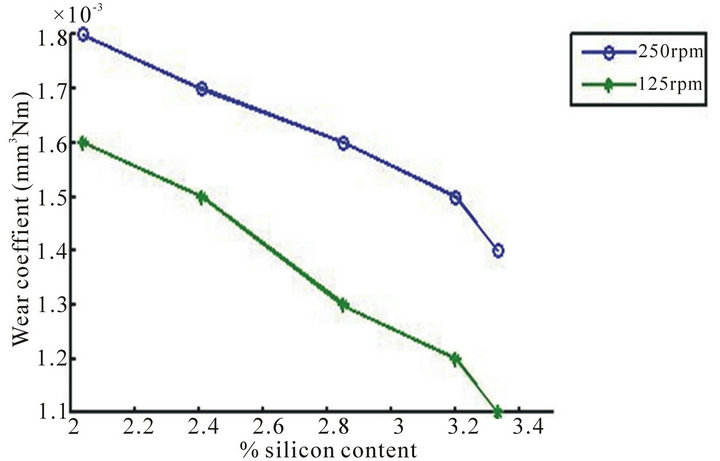 (b)
(b)
Figure 2. Change in wear coefficient with increasing load.
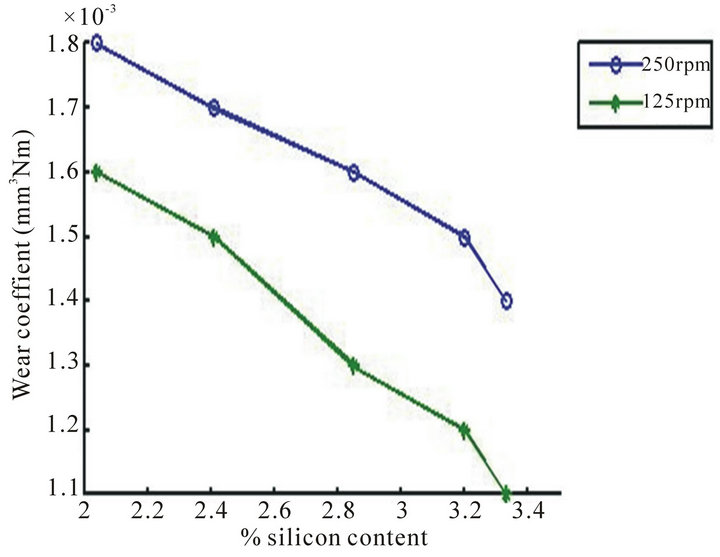
Figure 3. Change in wear coefficient with increasing speed.
tion is indicative of the fact that change in time has the least influence on the wear parameter under these set test conditions. From Figures 1-3 a wear transition occurred at 3.2% silicon addition irrespective of the varied wear parameters (speed, load and time). This can be attributed to lubricating effect characteristic of graphite flake.
Substituting the coded values of the variables for any experimental condition in Equation (3), the wear rate of grey cast iron and the grey cast iron having different additions of silicon can be calculated. The final linear regression equation for the wear rate of the grey cast iron with different additions of silicon when tested against a pin on disc set up can be expressed as follows:
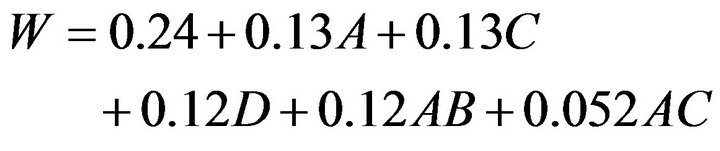 (4)
(4)
The regression coefficients associated with the variables i.e., sliding speed, load and the reinforce (silicon) is positive which indicate that wear rate increases with increasing sliding speed. In line with above explanation, the effectiveness of material removal increases with increasing sliding speed due to increasing depth of indentation. The design layout and response data for the wear study is shown in Table 4.
The analysis of variance was used to investigate which design parameters significantly affect the wear characteristic of the grey cast iron. It was accomplished by separating the total variability of the wear result, which is measured by sum of the squared deviations from the wear rate obtained, into contributions by each of the design parameters and the errors. Examination of the calculated values of Fishers (F) for all control factors also showed a very high influence of silicon additions, applied load and sliding speed on wear rate of grey cast iron. The different parameter levels chosen for the confirmation tests are shown in Table 5. The results of the confirmation test were obtained and a comparison was made between the actual values and the predicted values obtained from the regression model. From Table 6, it can
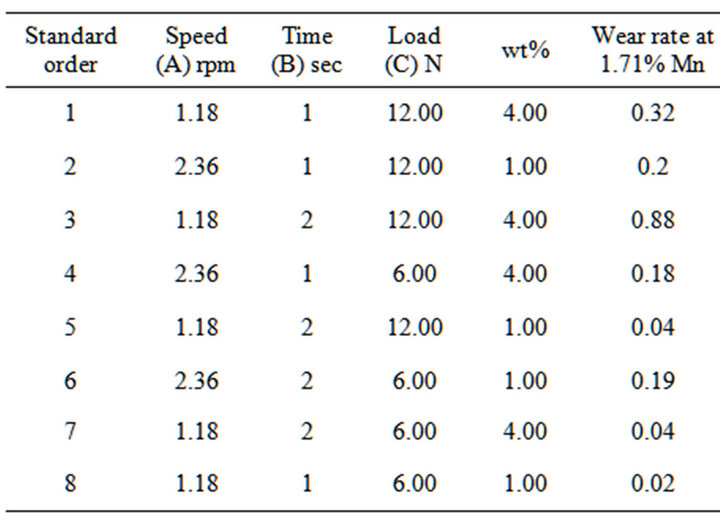
Table 4. Design layout and response data for wear study.
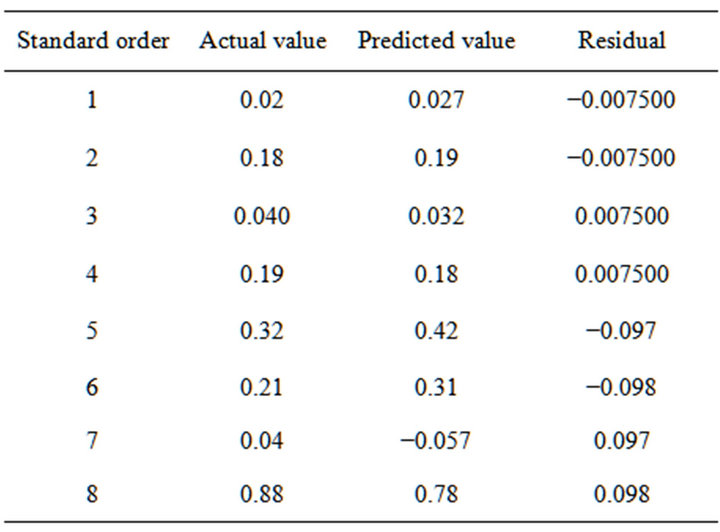
Table 5. Comparison of actual and predicted model values result.
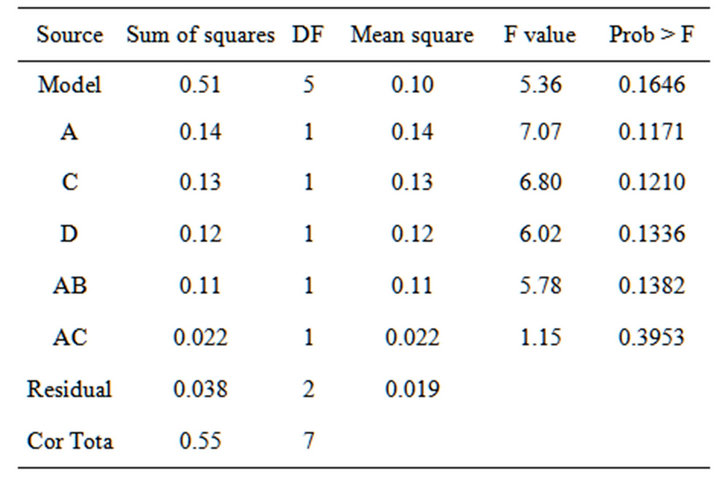
Table 6. Analysis of variance table to identify significant factors influencing wear rate of the grey cast iron.
be observed that the applied load has the most significant effect on grey cast iron. This is followed by the effect of silicon additions and sliding speed respectively. Time has no significant effect on the wear behaviour. This observation agrees with the earlier observation in Figures 1-3. From this statistical analysis, the silicon additions, sliding speed and load all affect the wear behaviour of grey cast iron. The interactions effect of sliding speed and time also shows significant effect on the grey cast iron with silicon. The model F-value of 5.36 implies the model is significant. There is a 16.46% chance that a “Model F-value” this large could occur due to noise. Value of “Prob F” less than 0.0500 indicate model terms are significant. This model can be used to navigate the design space.
3.2. Hardness and Impact Result
The hardness of the examined samples decreases with increase in silicon content (Figure 4). This may be attributed to increase in the volume of the soft graphite flakes as the silicon content increases (Plates 1(b)-(d)).
From Figure 5, it can be observed that as the percentage of silicon increases the impact energy of the samples increases. Also, from Figure 6, it can be observed that the relationship between hardness and impact is such that as the hardness reduces the impact increases. This behaviour is collaborated SEM micrograph from Plate 3 which shows some level of plastic deformation at the fracture surface of impact sample.
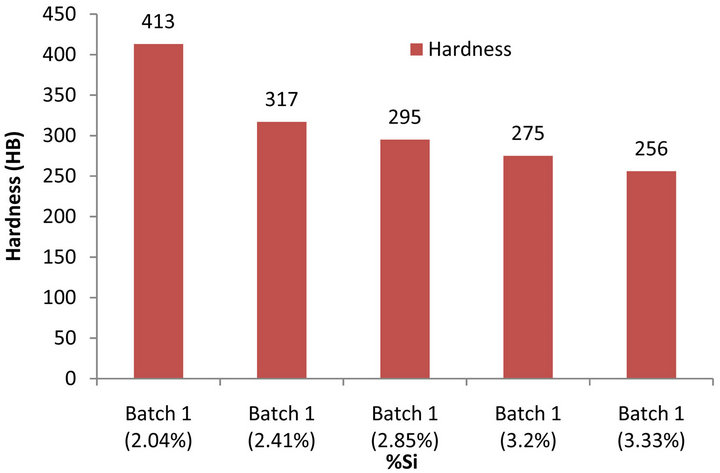
Figure 4. Hardness of the different compositions of grey cast iron.
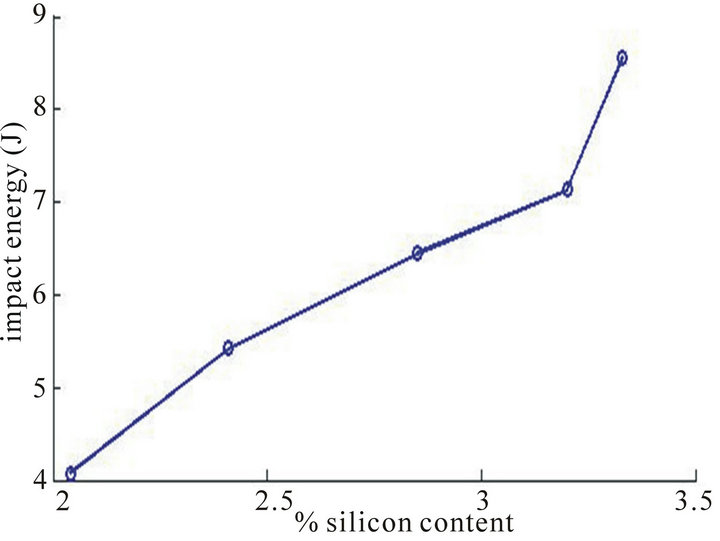
Figure 5. Impact energy of the various compositions of the grey cast iron.
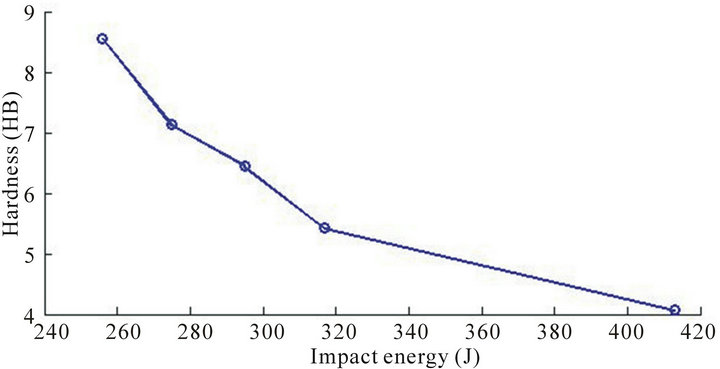
Figure 6. Hardness against impact energy of the grey cast iron.
4. Conclusions
The wear coefficient with respect to increasing load, speed and time decreases with increase in silicon additions for the grey cast iron. A wear transition occurred at 3.2% silicon addition irrespective of the varied wear parameters (speed, load and time). The location of the transition zone (3.2%) with respect to the operating parameters is important to design engineers to save proper materials selection and design.
The morphology and size of the soft graphite flake has a domineering effect on the hardness and consequently wear resistance of the grey cast iron.
Factorial design of the experiment can be successfully employed to describe the wear behavior of grey cast Iron and the developed linear equation models can be used in predicting the wear rate of the materials within the set experimental conditions.
The singular effects of silicon additions, load and speed variables are more pronounced on the wear behavior of the grey cast iron, while time has a less significant effect.
The sliding speed-time interactions effect has the most significant effect on the grey cast iron.
Inverse variation between hardness and impact resistance of the grey cast iron was observed.
From the result of the experimental work, although improved wear was observed with increase in silicon content, it can be concluded that grey cast iron is suitable for application where the impact load is considered low.
REFERENCES
- H. Mohamadzadeh, H. Saghafian and Sh. Kheirandish, “Sliding Wear Behavior of a Grey Cast Iron Surface Remelted by TIG,” Journal of Materials Science & Technology, Vol. 25 No. 5, 2009, pp. 622-628.
- M. A. Shaker, “Note on the Effect of Nodularization Characteristics on the Workability of Quench-Hardened and Tempered Cast Irons,” Journal of Materials Processing Technology, Vol. 32, No. 3, 1992, pp. 545-552. doi:10.1016/0924-0136(92)90252-N
- V. Singh, “Pysical Metallurgy,” Standard Publishers, 2005, pp. 459-462.
- C. Meric, S. Sahin, B. Backir and N. Koksal, “Investigation of the Boronizing Effect on the Abrasive Wear Behavior in Cast Irons,” Materials & Design, Vol. 26, No. 9, 2006, pp. 751-757. doi:10.1016/j.matdes.2005.01.018
- O. Aponbiede and N. M. Okelekwe “The Effect of Chloride Salts on the Mechanical Properties of Gray Cast Iron,” Journal of Emerging Trends in Engineering and Applied Sciences, Vol. 2, 2011, pp. 256-259.
- K. Edalati, F. Akhlaghi and M. Nili-Ahmadabadi, “In- fluence of SiC and FeSi Addition on the Characteristics of Gray Cast Iron Melts Poured at Different Temperatures,” Journal of Materials Processing Technology, Vol. 160 No. 2, 2005, pp. 183-187. doi:10.1016/j.jmatprotec.2004.06.007