Food and Nutrition Sciences
Vol.07 No.12(2016), Article ID:71507,22 pages
10.4236/fns.2016.712108
Informing Food Consumption Choices: Innovations in Measuring and Labelling
Marie-Chantale Pelletier1*, Caroline A. Sullivan1, P. J. Wilson2, Gary Webb2, Garry Egger3
1School of Environment, Science and Engineering, Southern Cross University, Lismore, Australia
2School of Health and Human Sciences, Southern Cross University, Lismore, Australia
3Lifestyle Medicine and Applied Health Promotion, Southern Cross University, Lismore, Australia

Copyright © 2016 by authors and Scientific Research Publishing Inc.
This work is licensed under the Creative Commons Attribution International License (CC BY 4.0).
http://creativecommons.org/licenses/by/4.0/


Received: September 28, 2016; Accepted: October 23, 2016; Published: October 26, 2016
ABSTRACT
The need to inform consumers about the health impact of their food choices is ever more pressing in a world where obesity is a growing problem. Concerns over food safety, its origins and its environmental impacts are also growing, as frequently reported in the popular press in many parts of the world. Nutritional and health information on food labels is quite well developed, but the complex nature of the information presented may hinder widespread use of the existing labels. In comparison, there has been little widespread success of carbon labels on food, and their usefulness in reducing carbon emissions from consumption is uncertain. In an attempt to address the need for clearer information on health and environmental impacts of food purchases, we present a novel dual-purpose food labelling system which provides information on both health and environmental impacts of food items. This paper presents results from a pilot study introducing a novel approach to food labelling: a simplified, combined carbon and health label to inform consumers simultaneously about the environmental and health impacts of their choices. Environmental impacts of various food categories were calculated on the basis of their relative energy use along the supply chain by using a newly designed Food Energy Index. Health impacts were based on the NuVal system developed in the USA in 2010. As part of the Norfolk Island Carbon and Health Evaluation study (NICHE), labels were designed, tested and displayed on 25 food categories for a 3-month period in the main supermarket on Norfolk Island (Australia). The in-store labelling trial was followed by a consumer survey on their attitudes to the labels. The results from this pilot trial indicate that consumers were supportive of food labelling including both environmental and health impacts, but the information provided in the dual labels was not sufficient to induce changes in consumption between food categories. We conclude that simple label design is clearly essential, and our findings warrant further investigation, including a broader study using a larger population and a wider range of food categories.
Keywords:
Food Categories, Food Labelling, NuVal, Nutrition, Carbon Labelling

1. Introduction
1.1. Food Labelling
Since the 1990s, consumers have had access to food labels displaying nutritional information aimed at informing them and helping them make healthier food choices [1] . While early food labels had been described as being of little meaning to consumers, nutrition labels have improved by simplification of the complex information they contain [2] , and there is some evidence of a positive impact on diets [3] [4] . In a range of countries, a variety of alternative labelling schemes have been used, displaying a range of health icons and indices, in monochrome or with a “traffic light” color scheme. Front-of-pack (FOP) labels aim to break through the repetitive nature of food shopping and the limited time shoppers spend deciding between products.
Carbon labelling of food is a much more recent concept with limited implementation to date. In anticipation of government regulations, some retail and food manufacturing companies have instigated carbon labelling schemes. Early schemes such as the Carbon Reduction Label launched in 2007 by the UK Department for Food and Rural Affairs (DEFRA) and the Carbon Trust have paved the way for the UK Publicly Available Standards (PAS) 2050 published in 2008, while the ISO 14067 Carbon Footprint of Products Certification has been available since 2013. These approaches use either a traffic-light system or a foot logo, combined with the quantity of carbon dioxide equivalent (CO2eq) emitted per serve or per pack of a food item. Although these efforts represent progress in the food labelling arena, there remains a range of difficulties both with consumer response and computational methodologies for carbon footprints.
There has been limited research on consumer responses to carbon labels in the shopping environment. Much of the information available is related to consumer attitudes, either derived from focus group consultations [5] [6] [7] , surveys of consumer experience of existing carbon labels [8] [9] , or surveys of attitudes about carbon labels designed for a specific study [10] . While in these studies consumers have repeatedly indicated a clear desire for carbon labelling, the effectiveness of such labelling in influencing consumer food choices is not so clear [5] [7] [11] [12] . A number of factors may be responsible for the low impact of these labels, including poor carbon literacy in consumers and a proliferation of various labelling schemes [6] [9] [11] [13] .
Only a limited number of studies have measured actual consumer behavior using actual carbon labels on food products [13] [14] [15] . Reference [14] found small increases in sales of products with a smaller carbon footprint, with more substantial shifts observed when smaller footprints were combined with lower prices. Footprints in this study were based on the energy required for transport and packaging, with products sourced from further afield and those packaged in smaller portions attracting a higher carbon footprint than locally sourced and bulk-packaged products. Reference [15] compared the use of simple and more comprehensive carbon labels on canteen meals served at a university restaurant in the USA. While the simple black and white logo did not induce any shift in behavior, the more comprehensive traffic-light system logo resulted in a 3% reduction in carbon emissions associated with purchased lunches. The use of Carbon Trust labels on the UK’s largest supermarket chain’s own brand products, however, did not result in any significant shift towards purchases of lower carbon products [13] .
Understanding the differences between consumer attitudes and actual consumption behavior is a challenge. Several studies have tried to evaluate why claims about environmental attitudes are not reflected in behavior [16] [17] [18] . Reference [19] provided early evidence of this attitude-behavior gap, pointing out that this made it difficult to demonstrate the benefit of product labelling. Many barriers have been found to influence environmental action [20] . Nevertheless, consultation through surveys and focus groups consistently show consumer preferences for traffic light indicator systems for both health [21] [22] [23] and carbon labels [5] [7] [9] [15] . Consumers also indicated simple information was preferable to too much detail, and comparisons with other products would help interpretation [6] [7] [9] . Furthermore, the provision of both environmental and health information is likely to reach a larger portion of the population interested in making more informed food choices [24] . In an attempt to build on the findings from these studies, we here present the results of a pilot study on a dual labelling system to represent nutritional and environmental impacts of choices between different food categories.
1.2. This Study
In an attempt to address both the obesity epidemic and increasing carbon emissions in Australia, the federal government funded an investigation into the use of Personal Carbon Allowances (PCAs)1. As a contribution to this broader study, a combined label displaying both health and carbon information has been tested in a pilot trial, with a view to evaluating its potential to influence consumer food purchases. Building on findings from previous research, the present study introduces three novel approaches to food labeling. Firstly, the use of a dual label aims to offer consumers a rapid assessment of both health and environmental impacts on the same label. To our knowledge, such a combined approach to food labelling has not been reported in the literature to date. Secondly, the rapid assessment is realized through the synthesis of complex information into a single score for each feature, one for health and one for carbon impacts. Finally, previous studies labelled products from different brands within the same food categories [13] [14] . The present study seeks to encourage consumers to maximize health benefits of their food choices by considering shifts from less healthy food categories (e.g. chips and soft drinks) to healthier alternatives (e.g. nuts and water).
2. Methods
2.1. Study Population
This project was part of the Norfolk Island Carbon and Health Evaluation study (NICHE) that investigated the use of a Personal Carbon Trading (PCT) system in reducing carbon emissions and improving health outcomes. Norfolk Island (NI), a territory of Australia, is a very small island only 7 km × 5 km in size, located in the Coral Sea, 1500 km off the east coast of Australia and 1200 km off the North Coast of New Zealand. Approximately 35% of its population of some 1800 are descendants of The Bounty mutineers, with the remainder being made up of fairly equal numbers of Australian and New Zealand expatriate residents, although the island also hosts about 20,000 tourists annually. This geography means that almost all resources have to be imported. The local population is almost self-sufficient in fruit and vegetable production, with some small amounts of vegetables, meat, cheese and fish also produced for commercial purposes. To investigate shopping habits in this location, the one major supermarket provided the study location, this being the place where almost all the local population, and tourists, shopped for food. The island’s strong food culture, its high level of awareness of sustainability issues (due to their isolation and natural limitations in waste disposal and water and energy supply) and the ease of access to the whole population for information dissemination made it suitable for a food labelling trial.
2.2. Labelling Trial
2.2.1. Food Categories
Focus groups conducted on Norfolk Island leading up to the trial helped to select the food categories to be included in the trial. Food categories were chosen on the basis of frequency of purchases and the availability of a “better” (i.e. nutritional and environmental) alternative amongst those available at Foodland. Better health value foods were defined as having lower energy density, and lower fat, sugar and salt content. Better environmental value foods were defined as requiring a lesser degree of non-renewable energy in production, manufacturing and transport.
A total of 25 food categories covering 290 individual food items were included in the trial. Fresh fruit and vegetables were not included in the trial due to the special circumstances of food supply on Norfolk described above (2.1 Study population). Residents grow their own produce and as result, very little fresh fruit and vegetables are available in the supermarket. Two of the chosen categories, local bacon and yogurt had only one product in each category, and so were not retained for statistical tests. As part of a larger project, one major aim of this study was to inform consumers about the carbon and health impacts of general food groups rather than finer details within food groups. This meant that the food categories included were broad (e.g. chocolate) and did not specify brands, flavors or packaging sizes (e.g. dark, milk, containing nuts, family-size, etc.). While this particular characteristic of the study allowed for labels to be displayed on the shelf, it also meant that consumers were asked to consider much more drastic changes to their food choices (substituting chocolate for dried fruit, chips for nuts, ice cream for yoghurt, etc.). Although this was a clear disadvantage in the methodological design, the retailer involved in the study wanted to avoid the need for having individual labelling of a large number of products. Being the only main retailer on the island meant that there was no alternative to this strategy.
2.2.2. Label Information
Initial focus groups on Norfolk Island revealed an interest in a combined label that could provide simple and easy to understand health and carbon values. Coupled with information from the literature, it was decided to design a label with a numerical score and a graphic using a traffic-light color system. For the numerical score, a scale was used between 0 (low health, high carbon) and 100 (high health, low carbon) and for the graphical element, a stick figure was used for health, while a footprint represented carbon.
For the purpose of this labelling trial, health scores were represented by the NuVal index [25] . This nutrition index developed in the United States combines properties of more than 30 micro and macronutrients, as well as their links to epidemiology and health outcomes in a single value ranging from 0 to 100. In order to combine this information with carbon information in a meaningful way, it was decided to develop a comparable index for carbon. To achieve greater accuracy in this measure, energy use was identified as the numeraire, thus avoiding all the pitfalls associated with attempts to measure carbon.
2.2.3. Carbon Score
Calculating carbon emission intensity for large number of specific food products is a difficult task. The process is data intensive and time consuming, as well as hindered by the absence of detailed data on carbon content at the product level, and by the increasing complexity of food supply chains. Since individual products were not the focus of this study, estimating carbon emission scores for individual products was not attempted. Instead, scores for broad food categories were calculated based on their energy intensity. Energy intensity was calculated using a Food Energy Index (FEI) developed specifically for use in this study.
Most studies which try to assess the carbon content of products use life cycle assessment [26] . Although well established, this approach is very data intensive, expensive and faces many methodological challenges relating to boundary definitions. The method proposed here provides a simpler, more rapid assessment of climate impacts for whole food groups rather than the traditional, more detailed life cycle assessment. Based on the energy requirements of the production and distribution system, the Food Energy Index takes energy use as an indicator of climate change impacts, based on the fact that in Australia, as in most developed countries, the burning of fossil fuels is the main contributor to anthropogenic carbon emissions [27] [28] .
In the development of the FEI, the relative energy impact was first calculated for five aspects of the food supply chain: agricultural production, manufacture, packaging, transport and trade. Each of these components was calculated relative to total energy use along the food chain. Weights for these five components were developed using the results of a detailed nation-wide study that estimated the change in energy use of 19 food categories in the USA between 1997 and 2002 [29] . Table 1 shows the five main components of the FEI and their relative energy impacts.
With the energy impacts of these food chain components identified, along with the relative importance of each (their weights), the second step in developing the FEI involved the definition of specific sub-components. For each of these, more detailed embodied energy information was found from the literature, in the form of energy use per kg of product, where possible from a single study, thus maintaining methodological consistency across products. The energy intensities within each main component were then normalized, producing sub-component weights, using Equation (1).

Table 1. Main and sub-components used to calculate the Food Energy Index.
 (1)
(1)
In this way, the “agricultural production” component had five sub-components relating to the nature of the main food ingredient (shown in Table 1), and the relative weight of each of these was based on published energy use data for the UK [30] . For the relative impact of each sub-component representing “manufacture”, the energy requirement of increasing levels of processing for three different types of breakfast cereals was used as a proxy [31] with processing being classed as low (rolled oats), moderate (muesli with dried fruit) or extensive (baked cereals with numerous ingredients). Each food category included in the trial presented here was then assessed as requiring either low, moderate or extensive levels of processing and allocated the associated weight.
For the packaging component, we used published data for energy used in paper, plastic and glass packaging manufacturing [32] [33] . For transport, the energy per kg of product was calculated using published data on average energy intensity (MJ/ton-km) for sea, air and road transport [34] , in combination with actual distances travelled within Norfolk Island, and depending on the origin of the products, distances between Norfolk and Australia, New Zealand and the rest of the world. “Trade” sub-components accounted for the number of times products changed hands along the supply chain, based on background research into manufacturing companies.
To further facilitate consumer understanding, the FEI was converted to a similar scoring system as the NuVal index, such that low scores represented a poor outcome, while higher scores represented better outcomes. Resulting health and carbon scores for each food category are presented in Table 2. For extra clarification based on the traffic light scheme, scores between 0 and 33 for both nutrition and carbon were allocated a red label, scores 34 - 66 a yellow label and scores 67 - 100 a green label (Figure 1). While this arbitrary color classification assisted the interpretation of implied ‘food benefit’, more work would be required before definitive color coding could be assigned to each food group, for both carbon and health scores, but for the purpose of this pilot trial, this was considered a suitable division.
As well as individual labels, paired labels were also displayed inviting consumers to carefully consider their choices by suggesting a “healthier” or “greener” option. Of the suggested alternatives, seven offered improved health outcomes, one offered improved environmental outcomes and four improved both prospects. Labels were displayed on supermarket shelves where the target products were located, as shown in Figure 2. Labels were displayed for a period of three months between July and October 2014.
2.3. Information Campaign
To raise awareness about the trial and help consumers better understand the links between their food choices, their health and the environment, a comprehensive information campaign was conducted prior to, and during, the study. This included posters at the supermarket entrances, leaflets distributed to shoppers (Figure 3), a display stall in the mall, local newspaper articles, local radio interviews and weekly radio reminders for the duration of the trial. To increase consumer engagement in the trial, six $50 shopping
Table 2. Food categories and their carbon-health scores included in the labelling trial on Norfolk Island.

Figure 1. Example labels used in the carbon-health labelling trial on Norfolk Island.


Figure 2. Paired labels displayed on supermarket shelves during trial.
vouchers were offered as lottery prizes drawn from the pool of survey respondents. The lottery was conducted during a weekly morning radio show on Norfolk Island radio, on six occasions over the duration of the trial.
2.4. Consumer Survey
To further examine the acceptability of the combined health-carbon labels, a short consumer exit survey was carried out during the trial period. The survey was designed to evaluate shoppers’ attitudes to the labels being tested. The survey also aimed to test potential associations between local food and environmental sustainability. Due to the geographic isolation of Norfolk Island, “local” food items can be perceived as much fresher than imported foods sourced from far away. The survey assessed whether the positive associations with freshness and health also extended to environmental benefits.
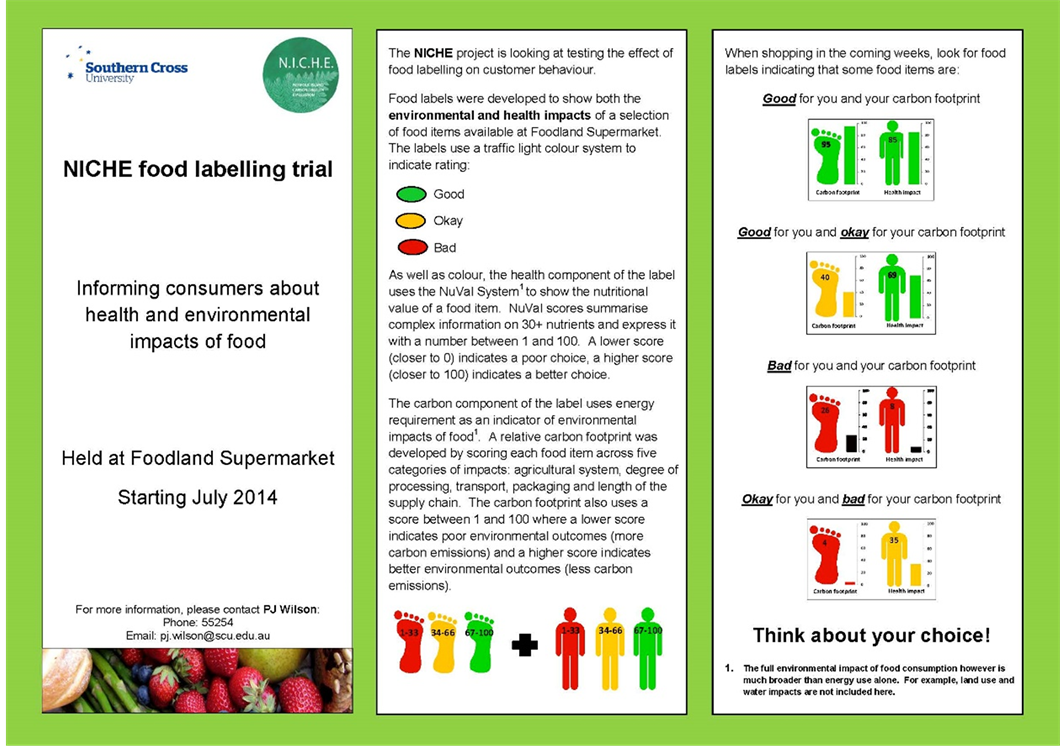
Figure 3. Information leaflet distributed to shoppers during the carbon-health labelling trial on Norfolk Island.
Following pilot testing, a final survey was developed containing 19 Likert scale questions asking respondents to rate statements ranging from 1 = “strongly agree” to 7 = “strongly disagree”. Eight questions examined consumer’s attitudes to food labelling and the specific elements of the labels; eleven questions explored perceptions of sustainability in local food; and two questions required demographic information. The survey was distributed by mail to all 805 households on the island (of which 655 were occupied at the time), together with a copy of the information pamphlet.
2.5. Data Analysis
Sales data was provided by the retailer for a six month period for a total of 281 products. This period covered the three-month trial period and the preceding three months. It was not possible to get weekly sales data, and information on prices and their variability during the trial was not made available.
Pre and post-trial sales data were compared using tests of significance. The population on the island increased by 19% between the first and last week of the trial due to seasonal visitor numbers. Visitors represented 23% of the total population when measured on the basis of tourist nights over the whole duration of the trial. According to local business operators, it is likely that this increase in visitor numbers was responsible for the 11.6% increase in supermarket sales over the same period. To better represent the actual change in sales (S) between the two periods irrespective of the population change, the relative change in sales (y) was calculated using Equations (2) and (3). Thus y = 1 will indicate no change in sales, y < 1 a drop in sales and y > 1 an increase in sales relative to the previous period.
 (2)
(2)
 (3)
(3)
where S = actual change in sales
 = “relative” change in sales (when y > 1 sales increased, when y < 1 sales decreased)
x1 = sales before trial
x2 = sales during the trial
The null hypothesis posited that the test labels would have no effects on sales, as measured during the two time periods. Multiple regression analyses were used to test this; a first model used the NuVal and FEI scores as independent variables and relative change in sales as the dependent variable; a second model tested whether label color was more important than the numerical score in purchasing decisions. Label color was allocated dummy values (0 = yellow, 1 = red, 2 = green) and treated as a categorical variable. T-tests were also performed to compare changes in sales between paired food categories suggested as better alternatives. Sales analyses were carried out using PASW® Statistics 17.0.
Responses to the consumer survey were analyzed using PRIMER-E [35] . The effect of gender and age on attitudes to the labels and attitudes to local food was investigated using a one way analysis of variance on ranked similarities with randomized permutations test (ANOSIM). We then examined whether significant differences existed between respondents who perceived local food as beneficial and those who were favorable to the carbon-health labels. The relationship between attitudes to local food and attitudes to the NICHE labels was tested using the Spearman’s rank correlation (RELATE).
3. Results
3.1. Sales Data
Sales data provided by the supermarket were a cumulative record of the number of items sold in the labelled categories for the two time periods. Results of regression analyses using relative change in sales for items with health and carbon scores are shown in Table 3. Neither carbon nor health scores were good predictors of changes in sales, with the regression model explaining only 1.3% of the variance in sales (p = 0.164).
A description of change in sales according to label color is presented in Figure 4. When compared with the 3-month period prior to the trial, sales of items carrying red health labels decreased by 5.4%, yellow labels decreased by 3.3% and green labels increased by 3.1%. Sales of items carrying red and green carbon labels increased by 3.4% and 1.2% respectively, while yellow labels decreased by 9.7%. Results of the regression analysis on label color, presented in Table 4, show no significant difference between sales of different label colors for either health (p = 0.397) or carbon (p = 0.087).
Comparing sales between specific food products allowed a more detailed look at purchasing behavior. Results of t-tests performed to compare means between a labelled product and its suggested “better” alternative are presented in Table 5. Of the ten food
Table 3. Regression model for changes in sales of carbon and health labelled products.
Table 4. Regression model for changes in sales according to label color for both health and carbon components.

Figure 4. Percent change in sales in health (dashed) and carbon (dotted) labels according to label color, relative to the prior 3-month period.
Table 5. Comparisons of changes in sales between food products included in the paired labels.
categories with suggested alternatives, 2 incurred changes in sales that were statistically significant (p < 0.05). Prepared chicken meals had lower health and carbon scores than whole chickens, yet their sales increased by 23% while whole chicken sales decreased by 23% (t(2.029), p = 0.034). Block cheeses had a lower health score but the same carbon score as cottage cheese and their sales decreased by 11% while sales of cottage cheese increased by 44% (t(−2.094), p = 0.028).
3.2. Evaluating Food Labels through the Consumer Survey
This preliminary investigation generated 66 responses from Norfolk Island households representing 10% of households occupied during the survey period. Male respondents made up 17% of all responses, females 83%. The mean respondent age was 51 - 60 years, which is above the population median age of 46. All “agree” and “disagree” responses were grouped and their distribution is presented in Table 6. Figure 5 shows a more detailed distribution of positive attitudes to the labels.
Table 6. Distribution of responses to the consumer survey (n = 66).

Figure 5. Distribution of positive responses to survey questions relevant to the NICHE labels.
Gender had no effect on respondents’ attitudes to the labels or to local food (p < 0.05). Age had no effect on attitudes to the labels (p = 0.05) but there was some difference in attitudes to local food between age groups (R = 0.137, p = 4.8%). Respondents aged 30 to 49 years differed from those aged 50 to >70 years. Attitudes to the NICHE labels had a strong positive correlation to attitudes to local food (p = 0.01). Respondents with positive attitudes to the labels also valued local food and perceived it as having health, environmental and economic benefits.
4. Discussion
The current study assessed the acceptability of simplified, combined food labelling, incorporating both health and carbon emissions impacts through an analysis of food sales and a consumer survey on Norfolk Island. Food sales data were compared over two time periods, firstly with no food labels and subsequently where labels were provided for a selection of 25 food categories.
The Food Energy Index (FEI) was developed specifically for this project. The methodology was designed as a cost effective alternative to the more detailed Life Cycle Assessment (LCA) approach used in other studies [31] [36] . Evidence from Europe suggests that the high cost of LCA has been a deterrent to wider application of carbon labels in the food industry [26] . This FEI approach has the advantage of being easily and cheaply applicable to all food products. While the approach has been piloted in this project, there is a need to further develop the tool in response to increasing interest in product labelling.
4.1. Supermarket Labelling Trial
There were a number of positive outcomes from the labelling trial, including a trend away from red health labels towards green labels, although this trend was not statistically significant. It is possible that a longer trial period and greater sales volumes would have revealed a stronger trend, although much of the environmental psychology literature on this subject suggests that consumers are internally inconsistent. The literature indicates that nutritional labels are effectively used by health-conscious consumers, perhaps because improved health choices provide direct personal benefit [3] [24] [37] . In the comprehensive Household Survey conducted as part of the broader NICHE study (N = 415), 83% of respondents expressed interest in consuming healthy food. Indeed some indication of this trend was observed in the sales data of paired food labels. Labels seemed to effectively cause a reduction in the sales of “less” healthy cheeses and a corresponding increase in sales of “healthier” cottage cheese. The reverse effect was found for chicken however, possibly due to visitors purchasing pattern, which could not be controlled for in the study.
Carbon labelling of food is more novel than nutrition labelling, and there are too few studies to date to fully comprehend the value of carbon labels. There has also been little effort to build awareness of the carbon impact of food choices. Given that the benefits of low carbon food options are perhaps less tangible than the benefits of healthier food options, there is a real need to promote a better understanding of this issue. At least one study showed that climate friendly meals did not affect consumer satisfaction when eating out, and providing the climate impact information resulted in increased purchases of low impact meals [38] . In addition, the availability of both health and carbon labels may reach a wider segment of the population interested in either environmental or nutritional performance of foods [24] . It is interesting to note that those products having the least benefit to health usually also tend to have higher carbon impacts. It is possible therefore that by demonstrating this link to consumers, they may well respond more actively to both issues.
The selection of food categories to include in any labelling trial is important, and the availability of a greater number of food labels improves shopper usability. In this trial, the choice of food categories was constrained by the quasi-absence of fresh fruit and vegetables in the supermarket, due to the special conditions of food provision associated with the island’s isolation (described in 2.1 Study Population). This was a serious limitation to this pilot study, as it resulted in few products representing both good health and low carbon impacts, possibly limiting consumer choices. The availability of a wider range of labelled products must be incorporated in the next phase of this work.
Some difficulties were encountered in implementing the labelling trial. Concerned about customer perceptions, the supermarket management was reluctant to display the labels directly on the shelves alongside price tags. The labels could only be positioned on top of the shelves, above the relevant products and in some cases, well above eye level. This limited the visibility of the labels to customers. In addition, the arrangement of food products along supermarket aisles was not conducive to easy comparisons between products, and it was not possible to influence this. For example, alternative products suggested as better options on the paired labels were often located in a different aisle, making direct and speedy comparisons by consumers difficult.
While it is argued that a larger range of labelled foods would encourage more effective product substitutions [26] , it is possible that the vast array of choices available to consumers within some food categories used here did not facilitate choices. This was particularly true of the “imported soft drinks” and “unhealthy breakfast cereals” (highly processed, with low nutritional value) categories that comprised 42 and 32 products respectively. More detailed information (in the form of more labels being available) about the specific products included in the broad category may have helped shoppers narrow the range of suitable alternatives within each food category. Finally, the availability of weekly sales data may have revealed more details about purchasing trends. With only two points of comparisons, the 3 months prior to trial and the 3 months of trial, it was not possible to see whether consumer interest in the labels declined over time, as found elsewhere [14] .
The demography of shoppers during the trial period may be another factor contributing to the weak evidence from the sales results. The high proportion of visitors (23%) on the island during the study will have influenced the purchasing record, since tourists will have different spending patterns from normal consumers living at home. In addition, none of the tourists purchasing in the supermarket had been exposed to the information campaign, or even knew about the study. The survey responses showed an over-representation of women, which suggests that (as elsewhere) women tend to be the main shopper in Norfolk Island households. In spite of this difference in numbers however, there was no significant difference in survey responses between genders.
4.2. Consumer Surveys
The majority of respondents (86%) claimed that food labels were useful in informing their food choices, and indicated such labelling systems may influence their purchasing decision. According to respondents, the specific labels used in this study were also found to be an improvement on existing nutritional labelling systems, indicating current labelling may be too detailed and complicated. Consumers seemed satisfied by the label design, finding the color scheme helpful and the single, numerical score for each item meaningful.
Survey responses showed evidence of strong support for the environment and local food supply chains. Responses indicated that local food was perceived by consumers as having clear environmental benefits. Local food was thought to be better for the environment by having a lower carbon footprint and less embodied energy, and buying local food was contributing to better environmental outcomes. This is in contradiction with much of the literature about local food, where evidence of environmental benefits from shorter transport distances is not so clear [39] . Indeed, the transport component of the FEI developed here only accounted for 7% of the overall carbon impacts (Table 3).
A number of previous studies suggest that consumers appear to place value in carbon labelling [10] [11] , but this value is not sufficient to bring about significant changes in food choices. This study confirms this situation, with survey respondents clearly indicating that the information provided by the labels was useful and may be used in purchasing decisions, despite the labels having only a very small influence on sales. In the trial presented here, an attempt was made to draw consumer attention to alternative food categories, which were considered to be reasonable choices for consumers to make. Other studies have looked at choices which incorporated minor differences between products such as distance travelled, packaging type or size [14] . They achieved some positive changes in behavior, suggesting smaller changes in product selection are possible. While greater health and environmental gains can be made from substituting between, rather than within food categories, realizing a more drastic change in food choice behavior will be more difficult. This would require that all food categories be labelled to avoid consumers substituting labelled products with unlabeled products with potentially higher carbon impacts [40] . A much longer and concerted information campaign would also be needed, combined with targeted food policy including strategies such as pricing signals [11] [14] .
4.3. Information Campaign
Several previous studies point to poor carbon literacy in shoppers and difficulty in interpreting nutritional information [9] [41] . In this work, it was evident during the pre-trial pilot survey that simply displaying labels was not sufficient: many people indicated being unaware of the trial and not having noticed the labels at all. In an attempt to address this, an information leaflet about the labelling trial was distributed in the supermarket and with the mail survey to every household on the island. Concurrently, the issue was discussed on a local phone-in radio show every week during the trial. While this provided some information about the trial itself, and the rationale for looking at carbon labelling, there is no doubt that a much longer period of awareness raising will be necessary if changes in behavior are to be effected. In contrast, nutrition labelling has been around since the 1980s, and indeed some changes in health related food choices have been observed in many parts of the world [3] .
5. Conclusions and Recommendations
This pilot study evaluated the use of a simplified, combined food labelling system that included information on both health and carbon emission impacts of food choices. The study involved an in-store labelling trial and analysis of food sales followed by a consumer survey on Norfolk Island, Australia. The study confirmed consumer interest in simplified health labelling schemes and in the novel approach of combining carbon- health information, even though sales data did not show significant changes in purchasing behavior. The survey also indicated that consumers valued the specific labels used in this study, suggesting that this novel approach to food labelling warranted further investigation.
Due to the limited scope of the study, however, it is difficult to conclude that the combination of health and carbon labelling is effective. Further work should consider a broader population and ensure that labels are better displayed, either on the products themselves, or by placing the labels at eye level, in closer proximity to the actual products. It would be worthwhile to include a greater number of matched substitute products that may generate a greater behavioral response than the products included here. The inclusion of more food options with high health benefit and low carbon impacts such as fresh fruit and vegetables would be especially desirable. Similarly, more detailed sales data would improve analytical capacity in a more comprehensive study.
Acknowledgements
This project was carried out under the auspices of the NICHE project, with funding from the Australian Research Council, contract number LP110100452, and Southern Cross University. Much assistance was provided for this work not only by the retailer Foodland and food producers in Norfolk Island, but also by the residents and tourists who participated in this study.
Cite this paper
Pelletier, M.-C., Sullivan, C.A., Wilson, P.J., Webb, G. and Egger, G. (2016) Informing Food Consumption Choices: Innovations in Measuring and Labelling. Food and Nutrition Sciences, 7, 1149-1170. http://dx.doi.org/10.4236/fns.2016.712108
References
- 1. Casey Jr., E.J. (1992) A Plan for Environmental Packaging. Journal of Business Strategy, 13, 18-20.
http://dx.doi.org/10.1108/eb039501 - 2. Tarabella, A. and Voinea, L. (2013) Advantages and Limitations of the Front-of-Package (FOP) Labeling Systems in Guiding the Consumers’ Healthy Food Choice. Amfiteatru Economic, 15, 198-209.
- 3. Campos, S., Doxey, J. and Hammond, D. (2011) Nutrition Labels on Pre-Packaged Foods: A Systematic Review. Public Health Nutrition, 14, 1496-1506.
http://dx.doi.org/10.1017/S1368980010003290 - 4. Thorndike, A.N., Riis, J., Sonnenberg, L.M. and Levy, D.E. (2014) Traffic-Light Labels and Choice Architecture: Promoting Healthy Food Choices. American Journal of Preventive Medicine, 46, 143-149.
http://dx.doi.org/10.1016/j.amepre.2013.10.002 - 5. Upham, P., Dendler, L. and Bleda, M. (2011) Carbon Labelling of Grocery Products: Public Perceptions and Potential Emissions Reductions. Journal of Cleaner Production, 19, 348-355.
http://dx.doi.org/10.1016/j.jclepro.2010.05.014 - 6. Hartikainen, H., Roininen, T., Katajajuuri, J.M. and Pulkkinen, H. (2014) Finnish Consumer Perceptions of Carbon Footprints and Carbon Labelling of Food Products. Journal of Cleaner Production, 73, 285-293.
http://dx.doi.org/10.1016/j.jclepro.2013.09.018 - 7. Berry, T., Crossley, D. and Jewell, J. (2008) Check-Out Carbon: The Role of Carbon Labelling in Delivering a Low-Carbon Shopping Basket. Forum for the Future, London.
- 8. Guenther, M., Saunders, C.M. and Tait, P.R. (2012) Carbon Labeling and Consumer Attitudes. Carbon Management, 3, 445-455.
http://dx.doi.org/10.4155/cmt.12.50 - 9. Sharp, A. and Wheeler, M. (2013) Reducing Householders’ Grocery Carbon Emissions: Carbon Literacy and Carbon Label Preferences. Australasian Marketing Journal, 21, 240-249.
http://dx.doi.org/10.1016/j.ausmj.2013.08.004 - 10. Kimura, A., Wada, Y., Kamada, A., Masuda, T., Okamoto, M., Goto, S.I., Tsuzuki, D., Cai, D., Oka, T. and Dan, I. (2010) Interactive Effects of Carbon Footprint Information and Its Accessibility on Value and Subjective Qualities of Food Products. Appetite, 55, 271-278.
http://dx.doi.org/10.1016/j.appet.2010.06.013 - 11. Gadema, Z. and Oglethorpe, D. (2011) The Use and Usefulness of Carbon Labelling Food: A Policy Perspective from a Survey of UK Supermarket Shoppers. Food Policy, 36, 815-822.
http://dx.doi.org/10.1016/j.foodpol.2011.08.001 - 12. Grunert, K.G., Hieke, S. and Wills, J. (2014) Sustainability Labels on Food Products: Consumer Motivation, Understanding and Use. Food Policy, 44, 177-189.
http://dx.doi.org/10.1016/j.foodpol.2013.12.001 - 13. Hornibrook, S., May, C. and Fearne, A. (2013) Sustainable Development and the Consumer: Exploring the Role of Carbon Labelling in Retail Supply Chains. Business Strategy and the Environment, 24, 266-276.
http://dx.doi.org/10.1002/bse.1823 - 14. Vanclay, J.K., Shortiss, J., Aulsebrook, S., Gillespie, A.M., Howell, B.C., Johanni, R., Maher, M.J., Mitchell, K.M., Stewart, M.D. and Yates, J. (2011) Customer Response to Carbon Labelling of Groceries. Journal of Consumer Policy, 34, 153-160.
http://dx.doi.org/10.1007/s10603-010-9140-7 - 15. Spaargaren, G., van Koppen, C.S.A., Janssen, A.M., Hendriksen, A. and Kolfschoten, C.J. (2013) Consumer Responses to the Carbon Labelling of Food: A Real Life Experiment in a Canteen Practice. Sociologia Ruralis, 53, 432-453.
http://dx.doi.org/10.1111/soru.12009 - 16. Gupta, S. and Ogden, D. (2006) The Attitude-Behavior Gap in Environmental Consumerism. APUBEF Proceedings, 3, 199-206.
- 17. Mainieri, T., Barnett, E.G., Valdero, T.R., Unipan, J.B. and Oskamp, S. (1997) Green Buying: The Influence of Environmental Concern on Consumer Behavior. The Journal of Social Psychology, 137, 189-204.
http://dx.doi.org/10.1080/00224549709595430 - 18. Peattie, K. (2001) Golden Goose or Wild Goose? The Hunt for the Green Consumer. Business Strategy and the Environment, 10, 187-199.
http://dx.doi.org/10.1002/bse.292 - 19. Wright, M. and Klyn, B. (1998) Environmental Attitude-Behaviour Correlations in 21 Countries. Journal of Empirical Generalisations in Marketing Science, 3, 42-60.
- 20. Kollmuss, A. and Agyeman, J. (2002) Mind the Gap: Why Do People Act Environmentally and What Are the Barriers to Pro-Environmental Behavior? Environmental Education Research, 8, 239-260.
http://dx.doi.org/10.1080/13504620220145401 - 21. Bialkova, S., Grunert, K.G. and van Trijp, H. (2013) Standing out in the Crowd: The Effect of Information Clutter on Consumer Attention for Front-of-Pack Nutrition Labels. Food Policy, 41, 65-74.
http://dx.doi.org/10.1016/j.foodpol.2013.04.010 - 22. Kelly, B., Hughes, C., Chapman, K., Louie, J.C.Y., Dixon, H., Crawford, J., King, L., Daube, M. and Slevin, T. (2009) Consumer Testing of the Acceptability and Effectiveness of Front-of-Pack Food Labelling Systems for the Australian Grocery Market. Health Promotion International, 24, 120-129.
http://dx.doi.org/10.1093/heapro/dap012 - 23. Hawley, K.L., Roberto, C.A., Bragg, M.A., Liu, P.J., Schwartz, M.B. and Brownell, K.D. (2013) The Science on Front-of-Package Food Labels. Public Health Nutrition, 16, 430-439.
http://dx.doi.org/10.1017/S1368980012000754 - 24. Visschers, V.H.M., Hartmann, C., Leins-Hess, R., Dohle, S. and Siegrist, M. (2013) A Consumer Segmentation of Nutrition Information Use and Its Relation to Food Consumption Behaviour. Food Policy, 42, 71-80.
http://dx.doi.org/10.1016/j.foodpol.2013.07.003 - 25. Katz, D.L., Njike, V.Y., Lauren Q.R., Reingold, A. and Ayoob, K.T. (2010) Performance characteristics of NuVal and the Overall Nutritional Quality Index (ONQI). American Journal of Clinical Nutrition, 91, 1102S-1108S.
http://dx.doi.org/10.3945/ajcn.2010.28450E - 26. Tan, M.Q.B., Tan, R.B.H. and Khoo, H.H. (2014) Prospects of Carbon Labelling—A Life Cycle Point of View. Journal of Cleaner Production, 72, 76-88.
http://dx.doi.org/10.1016/j.jclepro.2012.09.035 - 27. IEA (2015) CO2 Emissions from Fuel Combustion: Highlights. International Energy Agency, Paris, 152.
- 28. Department of the Environment and Energy (2016) National Inventory Report 2014 (Revised) Volume 1. Commonwealth of Australia, Canberra, 367 p.
- 29. Canning, P., Charles, A., Huang, S., Polenske, K. and Waters, A. (2010) Energy Use in the US Food System. United States Department of Agriculture, Economic Research Service, 39 p.
- 30. Williams, A., Audsley, E. and Sandars, D. (2006) Determining the Environmental Burdens and Resource Use in the Production of Agricultural and Horticultural Commodities: Defra Project Report IS0205.
http://randd.defra.gov.uk/Default.aspx - 31. Carlsson-Kanyama, A., Ekstrom, M.P. and Shanahan, H. (2003) Food and Life Cycle Energy Inputs: Consequences of Diet and Ways to Increase Efficiency. Ecological Economics, 44, 293-307.
http://dx.doi.org/10.1016/S0921-8009(02)00261-6 - 32. Zabaniotou, A. and Kassidi, E. (2003) Life Cycle Assessment Applied to Egg Packaging Made from Polystyrene and Recycled Paper. Journal of Cleaner Production, 11, 549-559.
http://dx.doi.org/10.1016/S0959-6526(02)00076-8 - 33. Humbert, S., Rossi, V., Margni, M., Jolliet, O. and Loerincik, Y. (2009) Life Cycle Assessment of Two Baby Food Packaging Alternatives: Glass Jars vs. Plastic Pots. The International Journal of Life Cycle Assessment, 14, 95-106.
http://dx.doi.org/10.1007/s11367-008-0052-6 - 34. Gleick, P.H. and Cooley, H.S. (2009) Energy Implications of Bottled Water. Environmental Research Letters, 4, Article ID: 014009.
http://dx.doi.org/10.1088/1748-9326/4/1/014009 - 35. Clarke, K.R. and Gorley, R.N. (2015) PRIMER v7: User Manual/Tutorial. PRIMER-EPlymouth.
- 36. Berners-Lee, M., Hoolohan, C., Cammack, H. and Hewitt, C.N. (2012) The Relative Greenhouse Gas Impacts of Realistic Dietary Choices. Energy Policy, 43, 184-190.
http://dx.doi.org/10.1016/j.enpol.2011.12.054 - 37. Grunert, K.G. and Wills, J.M. (2007) A Review of European Research on Consumer Response to Nutrition Information on Food Labels. Journal of Public Health, 15, 385-399.
http://dx.doi.org/10.1007/s10389-007-0101-9 - 38. Visschers, V.H.M. and Siegrist, M. (2015) Does Better for the Environment Mean less Tasty? Offering More Climate-Friendly Meals Is Good for the Environment and Customer Satisfaction. Appetite, 95, 475-483.
http://dx.doi.org/10.1016/j.appet.2015.08.013 - 39. Edwards-Jones, G., Milà i Canals, L., Hounsome, N., Truninger, M., Koerber, G., Hounsome, B., Cross, P., York, E.H., Hospido, A., Plassmann, K., Harris, I.M., Edwards, R.T., Day, G.A.S., Tomos, A.D., Cowell, S.J. and Jones, D.L. (2008) Testing the Assertion That “Local Food Is Best”: The Challenges of an Evidence-Based Approach. Trends in Food Science and Technology, 19, 265-274.
http://dx.doi.org/10.1016/j.tifs.2008.01.008 - 40. Shewmake, S., Okrent, A., Thabrew, L. and Vandenbergh, M. (2015) Predicting Consumer Demand Responses to Carbon Labels. Ecological Economics, 119, 168-180.
http://dx.doi.org/10.1016/j.ecolecon.2015.08.007 - 41. Cowburn, G. and Stockley, L. (2005) Consumer Understanding and Use of Nutrition Labelling: A Systematic Review. Public Health Nutrition, 8, 21-28.
http://dx.doi.org/10.1079/PHN2005666
NOTES

1Australian Research Council project LP110100452, NICHE (Norfolk Island Carbon and Health Evaluation)