Food and Nutrition Sciences
Vol. 3 No. 10 (2012) , Article ID: 23387 , 10 pages DOI:10.4236/fns.2012.310182
Dietary Factors Associated with Obesity in Patients with Schizophrenia Living at Home
![]()
1Department of Health and Nutrition, Niigata University of Health and Welfare, Niigata, Japan; 2Kohdo Mental Hospital, Niigata, Japan; 3Matsunami Clinic, Niigata, Japan.
Email: inamura@nuhw.ac.jp
Received July 27th, 2012; revised August 24th, 2012; accepted September 1st, 2012
Keywords: Dietary Habits; Food Records; Obesity; Outpatients; Schizophrenia
ABSTRACT
Since a fact-finding survey was conducted in 2004 all over Japan on the eating habits of psychiatric patients living at home, and the results showed that 44.6% of the patients were obese. We carried out a study of dietary factors associated with obesity in patients with schizophrenia living at home in order to develop a dietary education program. Twenty obese patients and 20 non-obese patients were randomly selected from 30 - 50s male patients with schizophrenia in one mental hospital. Dietary survey of 3-non-consecutive-day was conducted. Eighteen obese patients and 17 non-obese patients completed the survey. The obese patients had significantly higher intake of carbohydrate (P = 0.02), consumption of snacks with junk foods (P = 0.04), and intake of energy from snacks (P < 0.001) than those of non-obese patients. Based on this dietary survey, it becomes necessary to focus on snacks, in addition to basic focus on balanced diet to prevent further obesity in those schizophrenic patients.
1. Introduction
Psychiatric care in Japan is moving rapidly from in-hospital medical care towards outpatient care, and to at-home medical care. Therefore, social reintegration and support for living at home are being promoted more than ever. Under such circumstances, the psychiatric division of the Japan Dietetic Association conducted a fact-finding survey in 2004 on the dietary habits of psychiatric patients treated in out patient ward. The results revealed that the obesity in psychiatric patients was 44.6% of those with a Body Mass Index (BMI) of 25 kg/m2 or higher. In addition, there was a high incidence of lifestyle-related diseases after discharge from hospital [1]. So far, many reports about the problem of obesity in psychiatric patients have been published [2-5]. Diet, lack of exercise and the side effects of antipsychotic medications are said to be contributing factors to obesity [6,7]. The perspective of diet should be attributed to the fact that one of two psychiatric patients living at home is obese. The contributing factors have to be determined, and the possibilities of a dietary education leading to preventive measures against obesity must be established as soon as possible.
However, previous studies have not been able to elucidate which foods in the diet, or which way of eating habits contributed as factors to obesity. Then, we studied on schizophrenia patients who account for 60% to 70% of psychiatric patients.
As to previous studies on obesity and its dietary factors, few were conducted on schizophrenia patients. Henderson et al. conducted a dietary survey of the food intake status using four days food records on patients with schizophrenia and patients with emotional disorder associated with schizophrenia, and compared them with ordinary people, and concluded that obesity in patients with schizophrenia is not only due to the intake of food, but also to associated with the other factors such as the side effects of medications and decreased physical activity [8]. Moreover, Brown et al. conducted a survey using survey sheets on the diet, tobacco use, alcohol drinking, exercise and obesity of patients with schizophrenia, it was reported that the patients’ diets contained more fat and less dietary fibers than ordinary people [9]. However, both studies compared the diet of schizophrenia patients with that of ordinary people and aimed at determining the characteristics of the diet between patients and ordinary people. In addition, these studies posed a problem that different methods of survey were used in the two groups.
In this study, we conducted a dietary survey on uniform populations of obese and non-obese schizophrenia patients living at home, we analyzed statistically the differences between the contents of their diet, then we extracted the characteristics and identified the problems regarding the obese patients’ diets. We also examined what should be intensively taught to such patients in order to maintain their good health after being discharged from the hospital.
2. Methods
2.1. Study Design
Cross sectional study.
2.2. Survey Period and Subjects
The survey period of five consecutive months lasted from July to November 2007.
The surveyed subjects were male schizophrenic patients ranging in age from 30 to 50s, who attended as outpatients at a 450-bed mental hospital in Niigata city. The population was 223 men and composed 82 aged in 30s (36.8%), 75 aged in 40s (33.6%), 66 aged in 50s (29.6%). Random sampling was conducted on the basis of the composition ratio according to age stratification. The following were excluded as subjects: those whose severe medical conditions make this survey impossible to conduct, those who do not come for outpatient consultation during the survey period, and those who are on dietary control because of having diseases like type 2 diabetes. As a result, 40 subjects were accepted, among which 5 dropped out for not being able to undergo a dietary survey. Ultimately, survey results were obtained from 35 men, who were then considered target subjects for the analysis. Those comprised 14 aged in 30s (39.9%), 13 aged in 40s (37.1%), and 8 aged in 50s (23.0%). Since three of the subjects were type 2 diabetes patients but were not on dietary control, they were included in the study.
2.3. Survey Schedule and Method
A request for cooperation in the survey was distributed on the first day of each outpatient consultation within the survey period, and explanations on the purposes of the study were provided to the patients from whom consent was obtained. At that level, a survey of basic information was conducted, and explanations were provided on how to fill out the food record. After the patients had finished filling the food records and taking photographs of their meals during the specified 3-non-consecutive-day period, they brought them at the next outpatient consultation. The nurses in charge of outpatient consultations collected their food records and photographs, and measured their height, body weight and abdominal circumference. The survey consisted of a baseline characteristics survey, a dietary survey, and a survey of body types.
2.4. Baseline Characteristics Survey
The survey was performed on the first day of outpatient consultation within the survey period, by conducting interviews using the questionnaire method. The survey contained subjects’ basic attributes, family structure, employment situation, their health behavior, their living conditions, the presence or absence of diseases involving internal medicine, their status of medication, their status of use of dietary supplements and health food products, the frequency of eating out, the food-purchasing environment, the status of snacks consumption, the status of the intake of favorite drinks, coffee and tea, and the status of the intake of milk. In addition, the quantitative questionnaires on health behavior and physical activity were as follows: for health behavior, we used the brief self-administrated dietary history questionnaire (BDHQ), whereas, for physical activity, we used the levels in the 2005 version of the Dietary Reference Intakes for Japanese.
2.5. Dietary Survey
On the first day of outpatient consultation within the survey period, we requested the subjects to keep a food record, and provided the explanations how to do so. The dietary survey was conducted on the basis of the subjects’ self-administrated food records. The goal-oriented record keeping method was used. The subjects kept dietary records of rough amounts without measuring weight. At the same time, the designated camera was provided to the subjects in order to compensate for any kind of imperfection in the food records, and to make the accuracy of the data. The subjects took pictures of all the food before eating for one day. The survey was set to 3 nonconsecutive days: one day on a weekend, and two days on weekdays. They brought the camera and the three-day food records at the next outpatient consultation time. A dietary survey was conducted on all subjects who completed food records on the designated days between July and September. However, the survey ended in November when additional food records were collected from the subjects who visited the hospital for consultations once every 2 months.
2.6. Body Types
After the food records were collected, the subjects’ height and body weight were measured in the outpatient treatment room by the nurse in charge of outpatient consultations. Body weights were measured using MISAKI DIGITAL HEALTH SCALE, heights were measured using measuring equipment made by TTM Company Ltd, after which we calculated the BMI.
2.7. Statistical Analyses
To examine the differences between the obese group and the non-obese group, we used information on their characteristics (age, family structure, employment status) and on the presence or absence of diseases involving internal medicine. The medication status was examined using the chi-square test. For the basic information on the subjects’ dietary habits (their status of intake of three meals a day, status of use of dietary supplements, the frequency of eating out, the store they use, their in-between snacks, their favorite drinks, coffee or tea, milk, physical activity), the body type (height, body weight, abdominal circumference, BMI) and the health behavior (exercising habits, tobacco use, alcohol drinking), the Mann-Whitney test was used. For the dietary survey, the amounts of the foods written in the food record were converted into weight—on the basis of which the intake of energy and nutrients and the intake by food group were calculated, and differences between the two groups were examined using the Mann-Whitney test. We used SPSS 16.0 J for Windows for the statistical analysis. A value of P < 0.05 was considered a statistically significant difference.
In this study, we obtained the consent of the subjects after the purpose of the survey was explained to them through a written notice, and after they were informed about the fact that the survey results would be treated statistically, that individual collaborators would not be identifiable, and that there will not be any penalty even if they cancel their consent for cooperation. The content of this study has been examined and approved by both the Ethical Committee of Niigata University of Health and Welfare and the Ethical Committee of Kohdo Mental Hospital.
3. Results
3.1. Baseline Characteristics Survey
Age, family structure, and employment status. The number of subjects by age category was as follows: 14 subjects were in their 30s, 13 in 40s, and 8 in 50s. The average age was 42.6 years old. As for family structure, 10 subjects (28.9%) lived alone, and 25 subjects (71.1%) lived with family. Their employment status was as follows: 4 subjects (11.3%) were employed, and 31 (88.7%) were unemployed. No significant difference was found between the obese group and the non-obese group in the 3 items mentioned above (Table 1).
Body types. In the obese group (n = 18), the mean height, mean body weight, mean abdominal circumference, and mean BMI (SD standard deviation) were 170.5 (SD4.3) cm, 84.1 (SD11.4) kg, 100.8 (SD9.2) cm, 28.9 (SD3.2) kg/m2, respectively, whereas in the non-obese group (n = 17), they were 170.9 (SD5.9) cm, 58.9 (SD8.8) kg, 79.6 (SD7.2) cm, 20.1 (SD2.6) kg/m2, respectively. There was no significant difference in height between the two groups. Body weight, abdominal circumference, and BMI in the obese group were significantly higher (P < 0.001) than those of non-obese group (Table 2).
Exercising habits, physical activity, tobacco smoking and alcohol drinking. A regular base exercises were only as few as 2 persons (11.1%) in the obese group and 4 persons (23.5%) in the non-obese group. Ordinary status of physical activity in daily life were as many as 12 (66.7%) in the obese group and 12 (70.6%) in the nonobese group. As many as 14 (77.8%) subjects were found
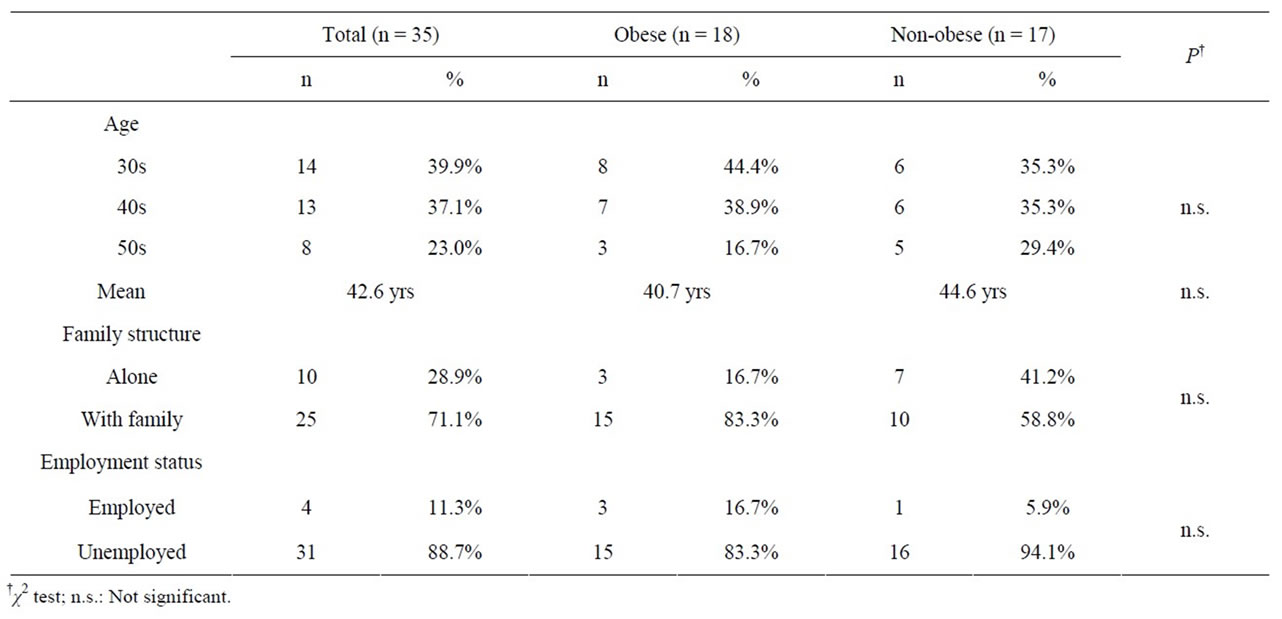
Table 1. Age, family structure and employment status.
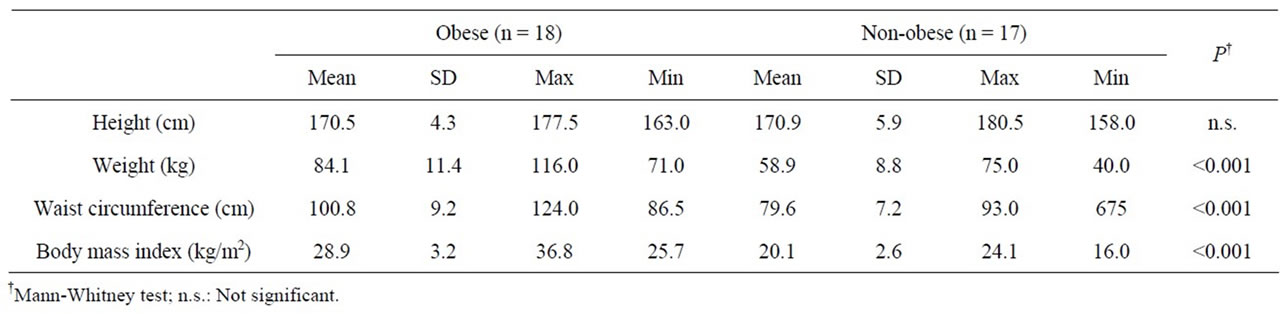
Table 2. Body types.
to be tobacco smokers in the obese group, and 9 (52.9%) in the non-obese group. In both groups, as many as 12 subjects (66.7%, and 70.6%, respectively) almost never drank alcohol. In either item, there were no significant differences between the two groups (Table 3).
3.2. Dietary Habits
Thirteen subjects in the obese group (72.2%) and 11 subjects in the non-obese group (64.7%) had meals 3 times a day. Four in the obese group (22.2%) and 6 in the non-obese group (35.3%) had meals twice a day. Sixteen in the obese group (88.9%) and 14 in the non-obese group (82.4%) did not use dietary supplements and health food products. Eleven in the obese group (61.1%) and 12 in the non-obese group (70.6%) almost never ate out. Six in the obese group (33.3 %) had snacks nearly every day, whereas in the non-obese group, only 2 did (11.8%). Ten in the obese group (55.6%) drank their favorite beverages nearly every day, whereas in the non-obese group, only 3 did (17.6%), and in that regard, a significant difference was found between the two groups. In the obese group who drank coffee or tea nearly every day were as many as 14 (77.8%) and 11 (64.7%) in the non-obese group. In items related to dietary habits, significant differences between the two groups were found (P = 0.04) only in favorite beverages. No significant difference was found in the other items (P = 0.04) (Table 3).
3.3. The Status of Medication
Fourteen subjects (77.8%) in the obese group and 10 subjects (58.8%) in the non-obese group used atypical antipsychotic drugs believed to have an influence on the obesity of psychiatric patients. Neither the presence of absence of diseases involving internal medicine nor the status of use of psychotropic medication showed any significant difference between the two groups (Table 3).
3.4. Dietary Status, Nutrient Intake, and Food Intake According to Food Groups
In terms of nutrient intake per day in meals, the only “intake of carbohydrates” in the obese group (346.5 grams, SD = 80.8) was significantly higher than that of in the non-obese group (279.5 grams, SD = 57.9) (P = 0.02). In addition, the protein energy ratio in the obese group (13.6%, SD = 2.1) was significantly lower than that of in the non-obese group (15.0%, SD = 2.2) (P = 0.03). Likewise, the fat energy ratio in the obese group (21.7%, SD = 5.4) was significantly lower than that of in the nonobese group (25.7%, SD = 4.1) (P = 0.04). On the other hand, the carbohydrate energy ratio in the obese group (61.6%, SD = 7.2) was significantly higher than that of in the non-obese group (55.8%, SD = 6.6) (P = 0.04). However, in food groups, no significant difference was found between the two groups (Table 4).
As for nutrient intake from snacks, energy and ten other nutrients in the obese group were significantly higher than those of in the non-obese group. In addition, in food groups, the intake of favorite foods in the obese group was only significantly larger than that of in the non-obese group (P = 0.04) (Table 5).
4. Discussion
4.1. Standing of the Subjects in This Study
According to one previous study regarding a fact-finding survey on the eating habits of psychiatric patients living at home all over Japan, 44.6% of their overall number accounted for obese individuals with a BMI of 25 kg/m2 or more. In this study as well, 18 of the 35 subjects (51.4%) were obese individuals with a BMI of 25 kg/m2 or more, and this could be considered an ordinary group by comparison with the population of psychiatric patients all over the country.
4.2. Exercising Habits, Physical Activity, Tobacco Use and Alcohol Drinking
The existence or absence of exercising habits and the physical activity status is greatly associated with obesity. Subjects who practiced exercise on a regular basis were as few as 2 in the obese group (11.1%) and 4 in the nonobese group (23.5%). Meanwhile, subjects who almost never exercised were as many as 7 in the obese group (38.9%) and 6 in the non-obese group (35.3%). Those
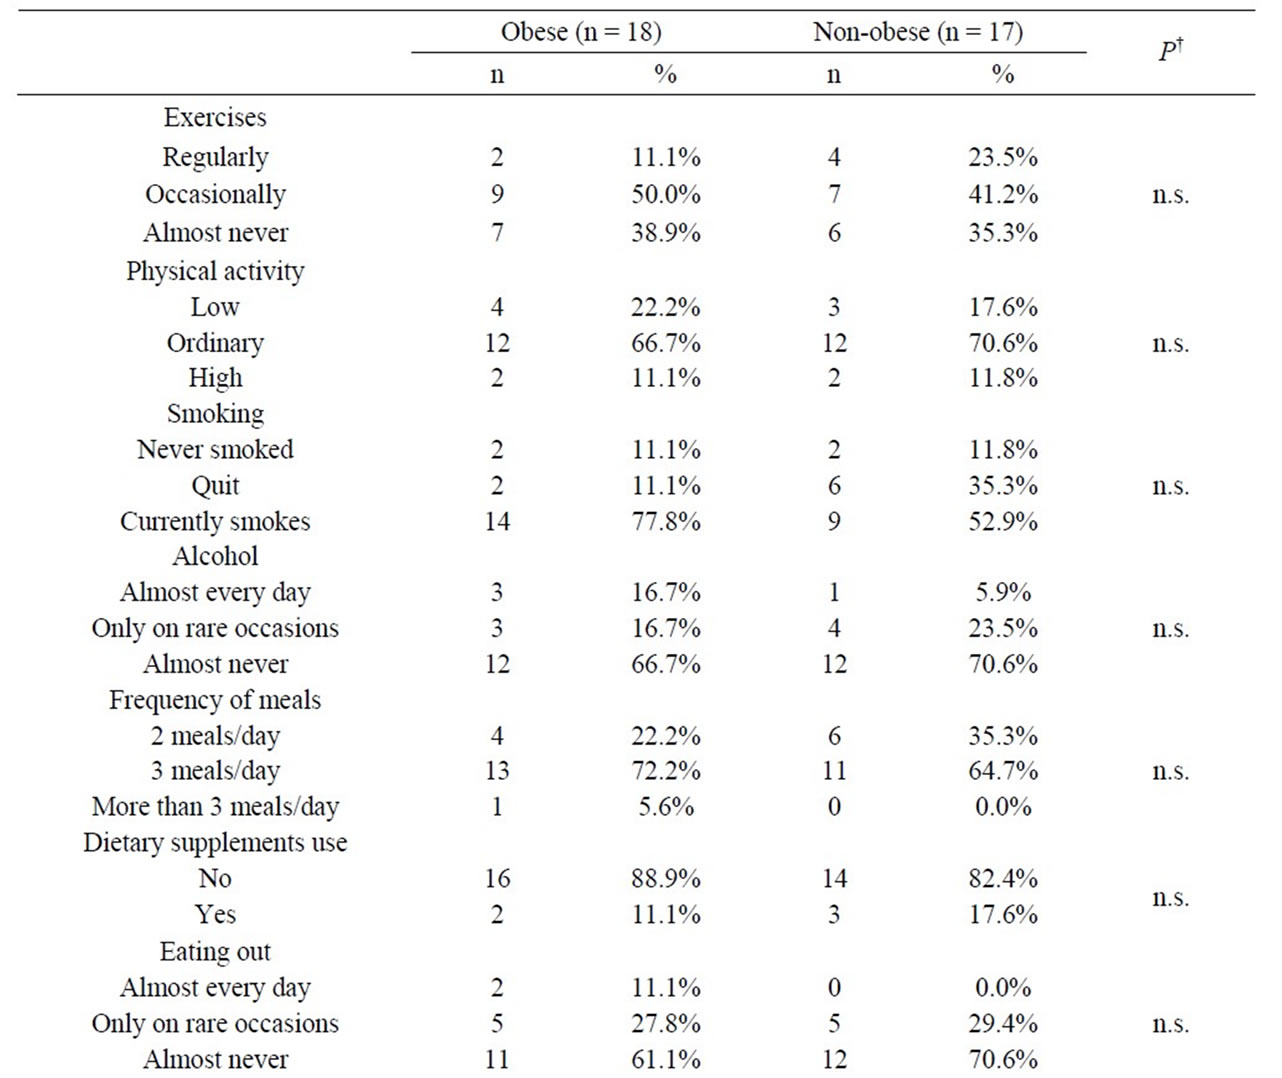
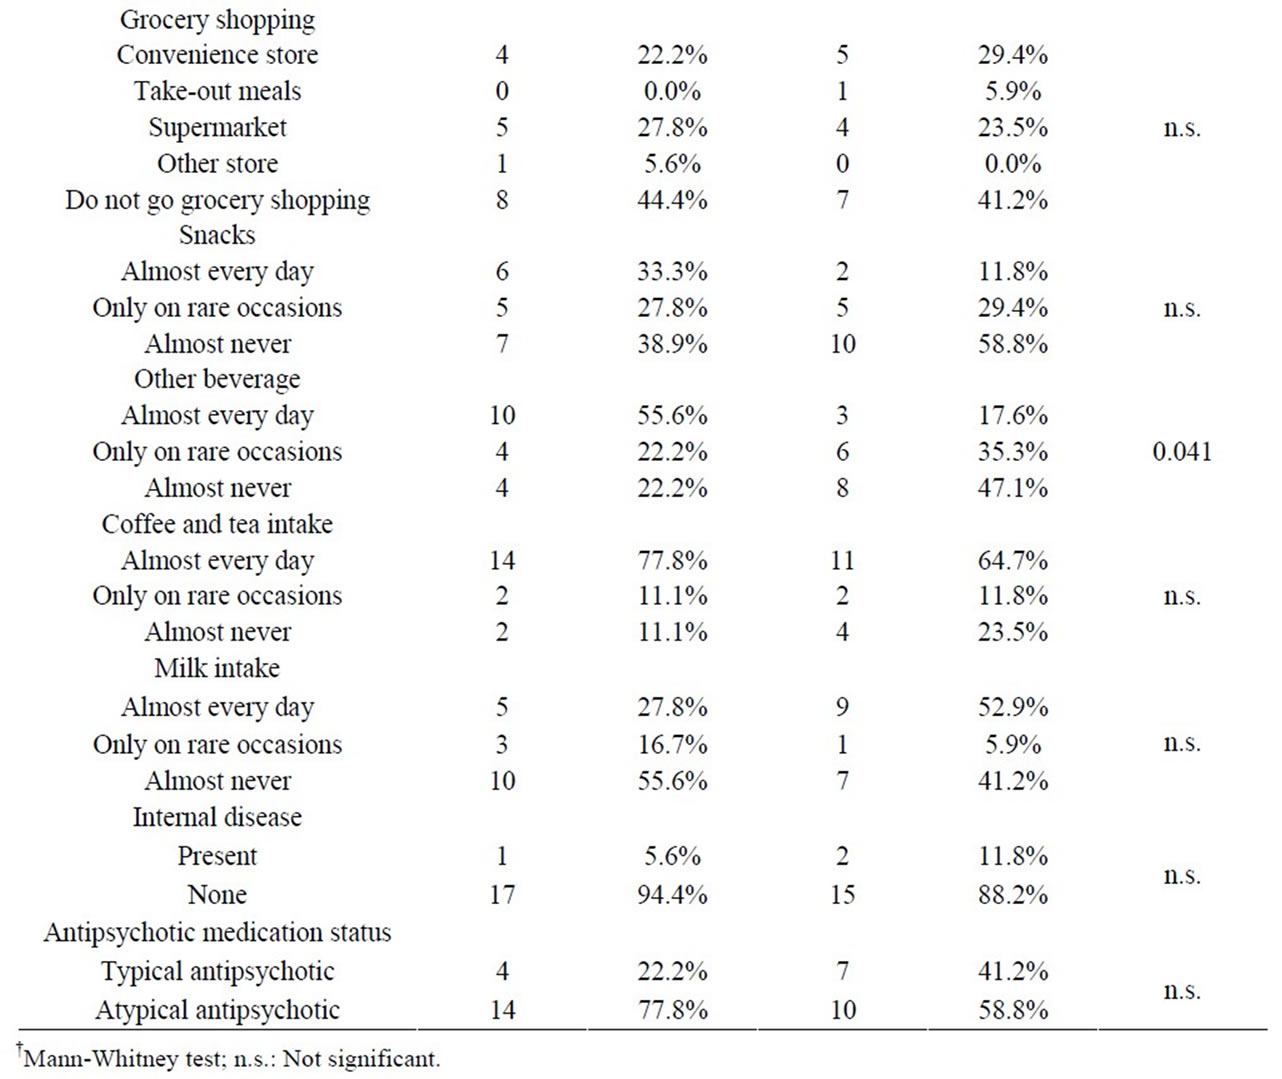
Table 3. Exercise, physical activity, smoking, alcohol, dietary habits and medication status.
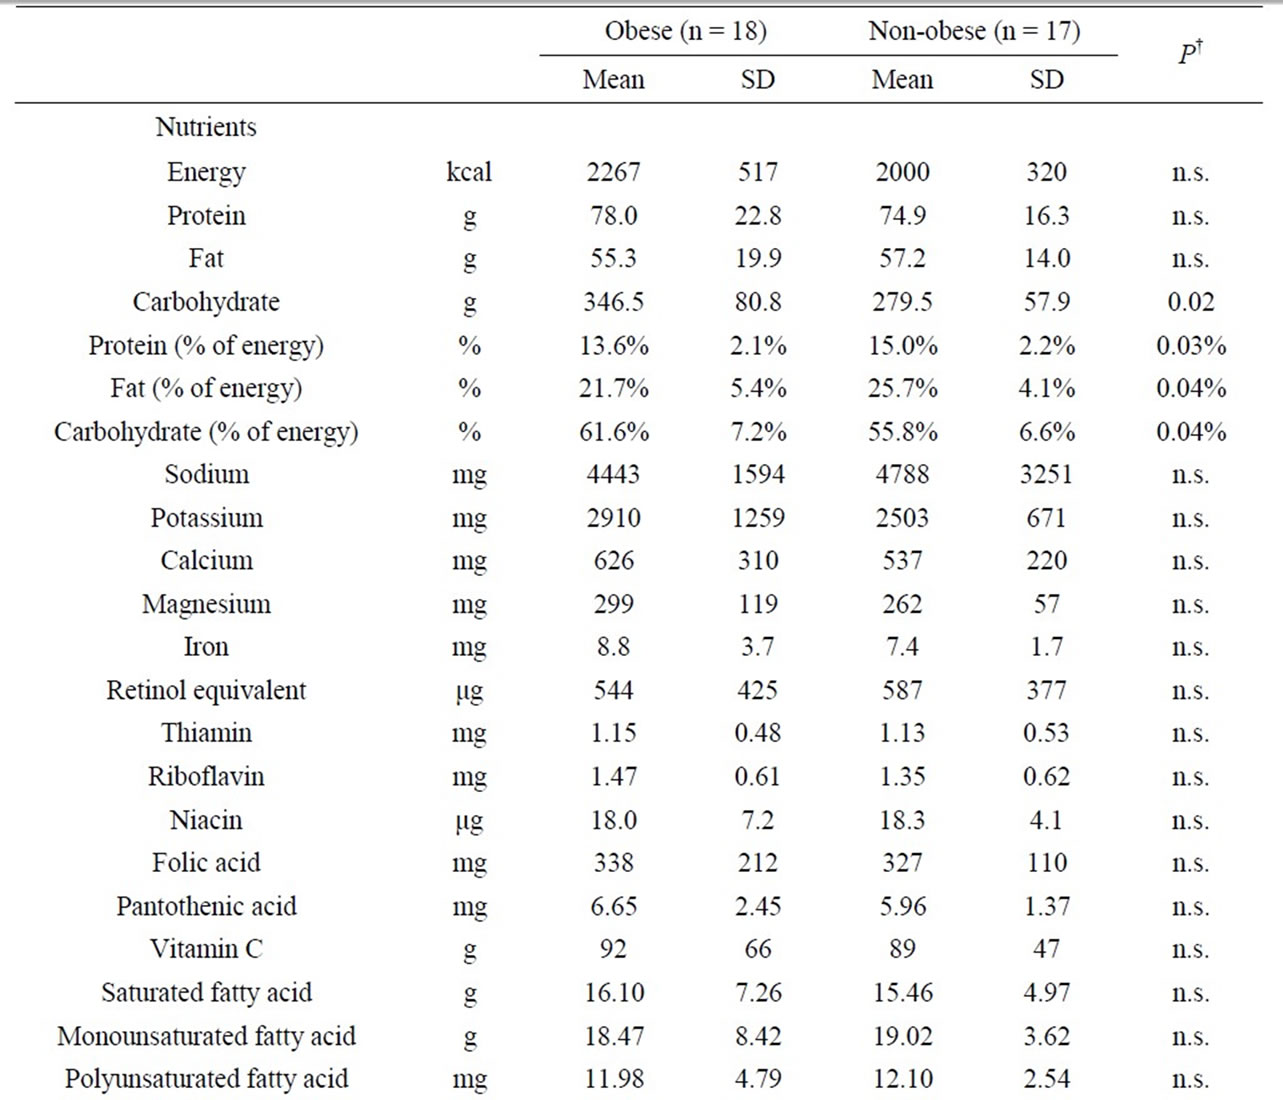
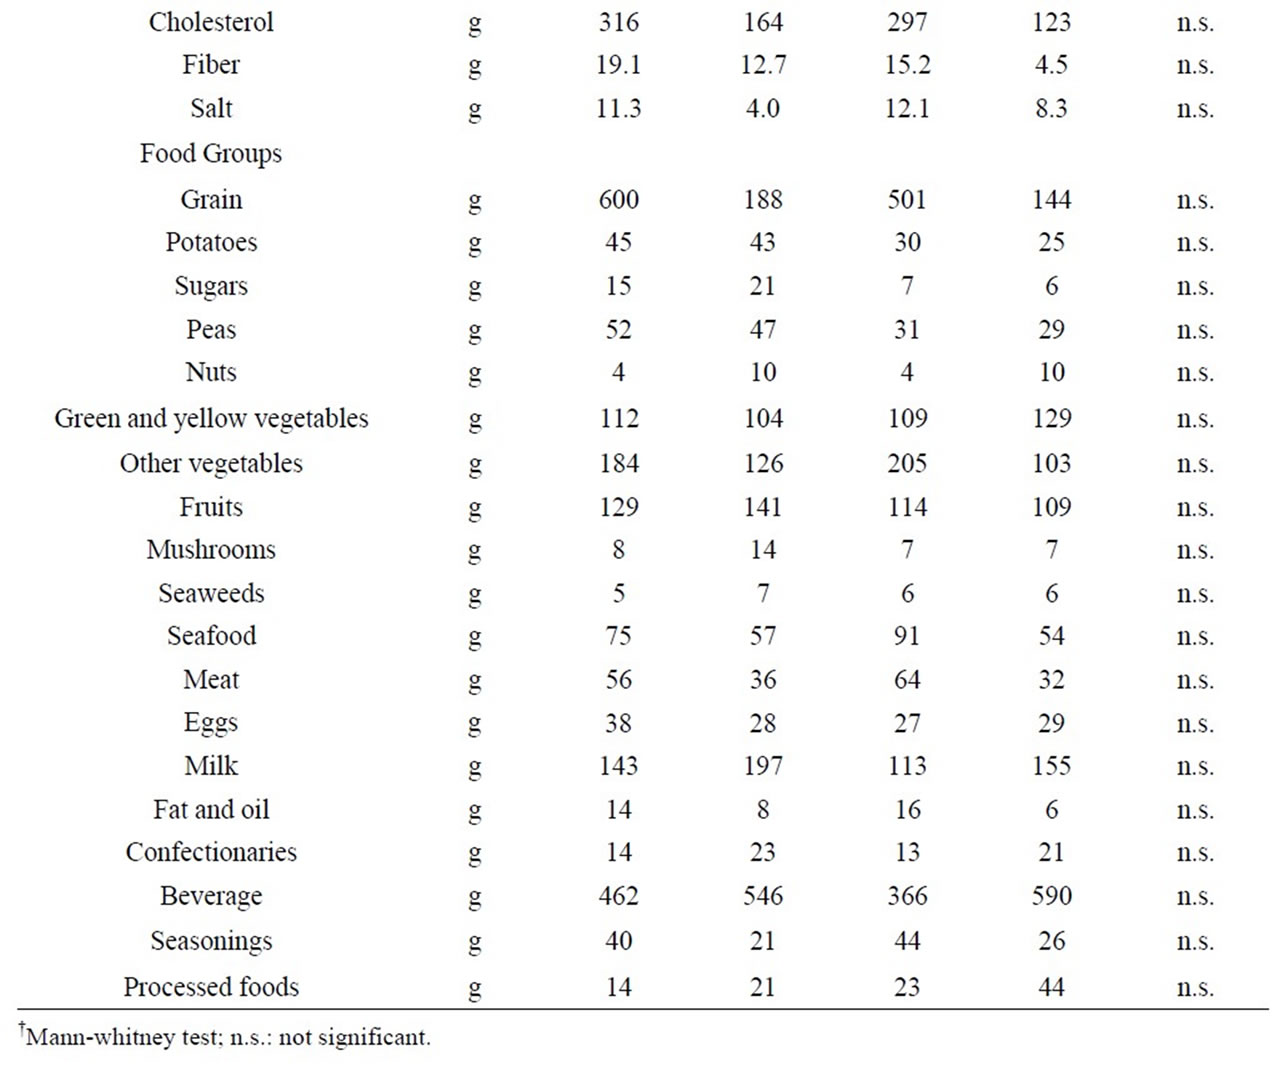
Table 4. Nutrient intake and food intake according to food groups per day.
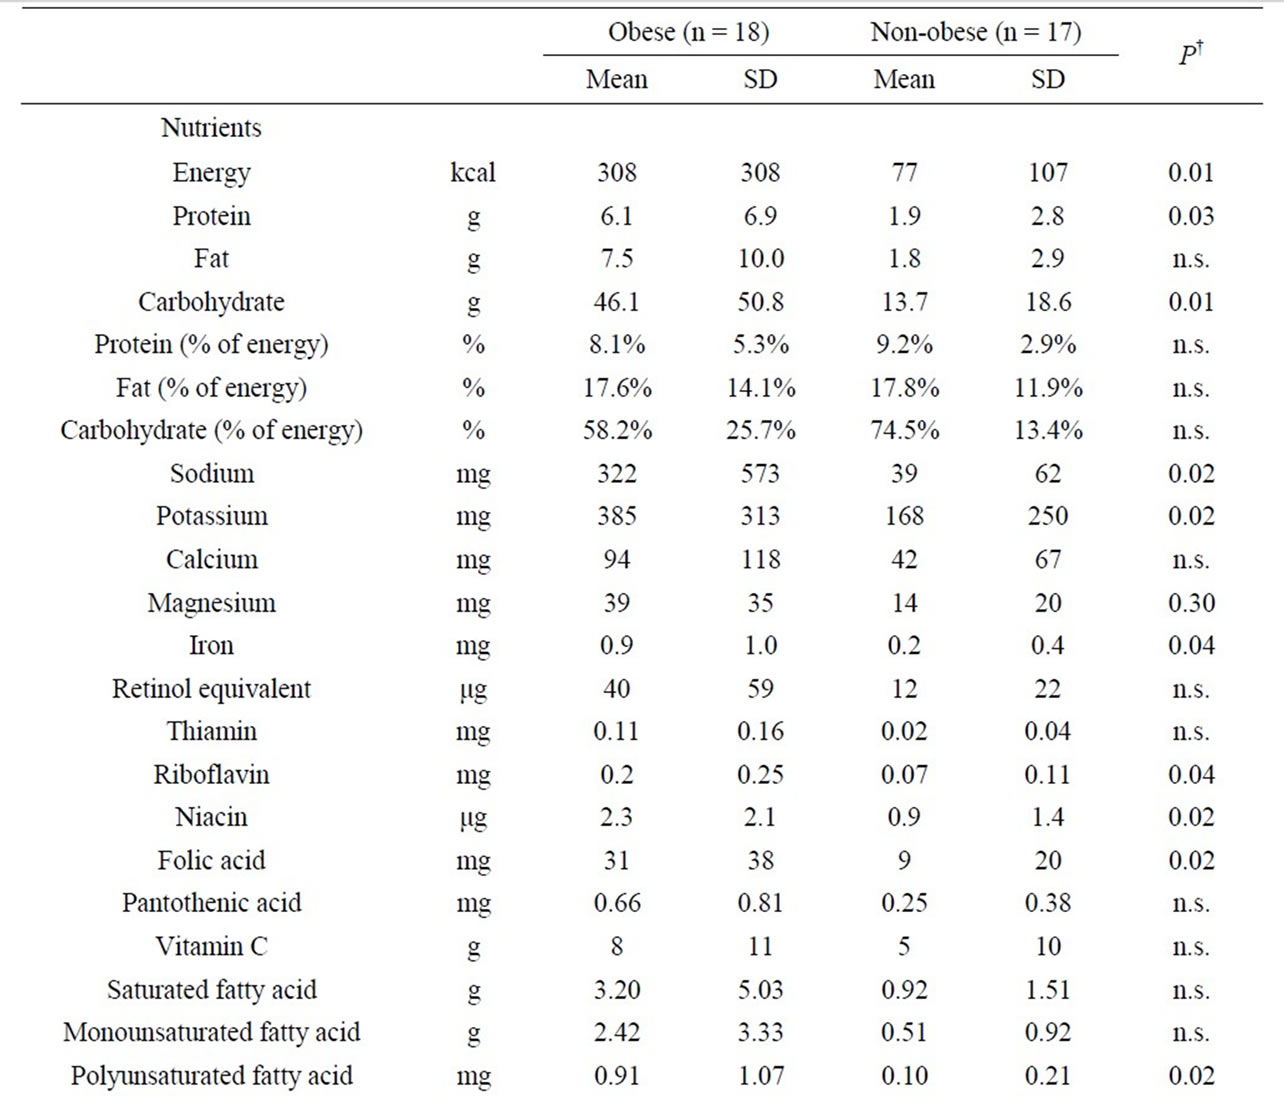
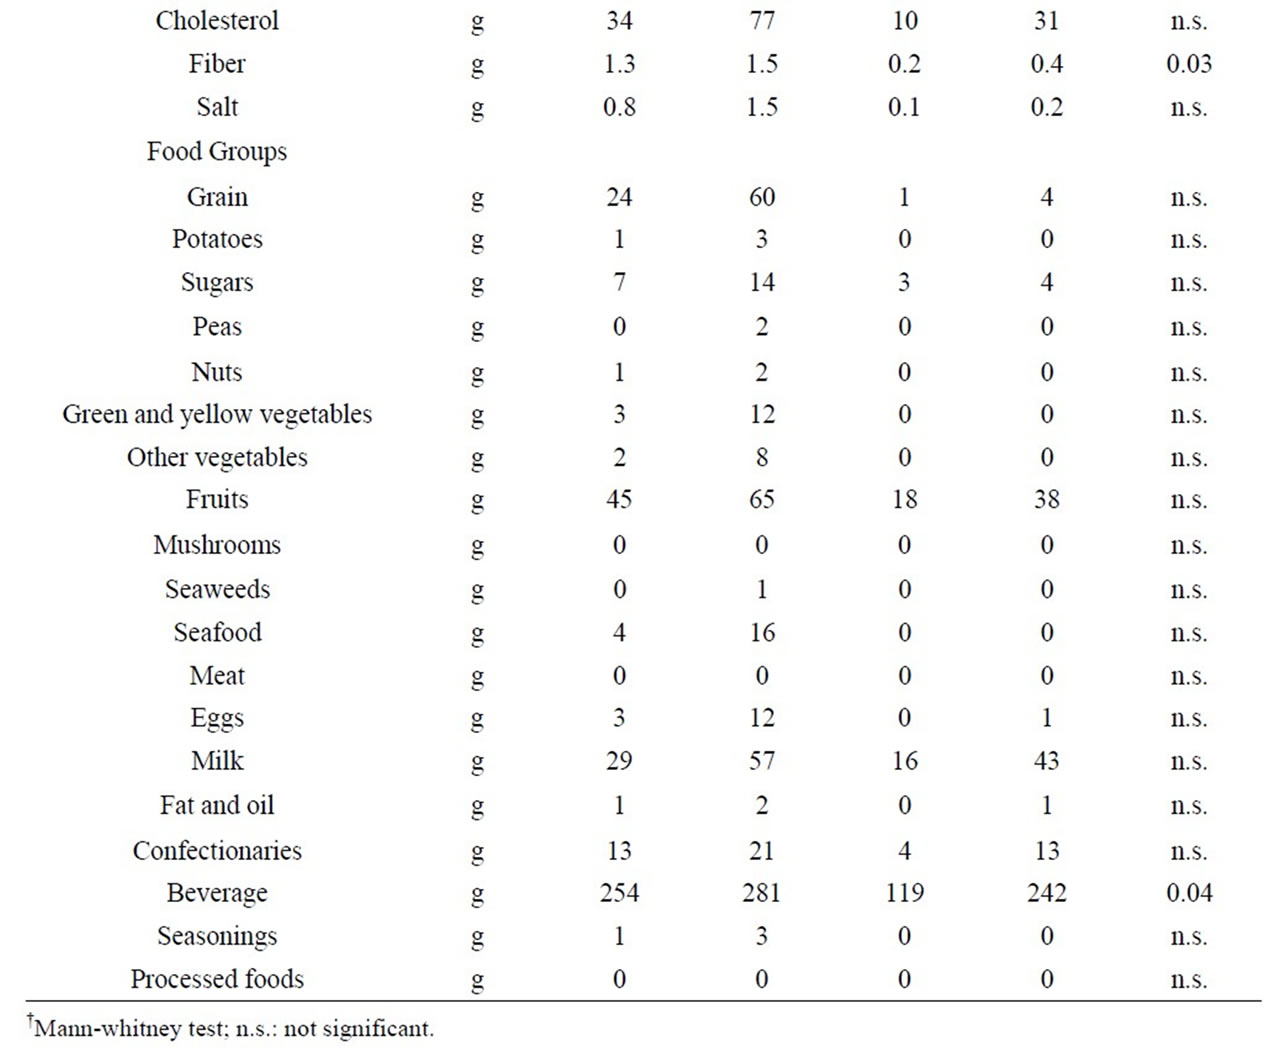
Table 5. Nutrient intake and food intake according to food groups per day in snacks.
were almost at the same percentages as those reported by Brown et al. in a previous study in which 36.0% of the subjects almost never exercised. Because there was no difference between the two groups in terms of exercise or physical activity, those were not considered as contributing factors to obesity.
Regarding smoking, 14 subjects in the obese group (77.8%) and 9 in the non-obese group (52.9%) were smokers. Such high smoking rates are consistent with the reports of previous studies [10].
As for alcohol drinking, subjects who almost never drank alcohol were as many as 12 in the obese group (66.7%), and 12 in the non-obese group (70.6%). The reasons for avoiding alcohol were either due to financial matters or for fear of negative impact of interaction with medication. The low rate of alcohol use and the reasons thereof were similar to those in the previous study conducted by Brown et al.
4.3. Antipsychotic Drugs and Body Weight Gain
The effects of therapeutic drugs have been indicated as a contributing factor to the obesity of psychiatric patients [7,11]. Currently, atypical antipsychotic medications are frequently being used more and more in their pharmacological treatment, and consequently, side effects such as weight gain and abnormal glucose tolerance has become a controversial issue. Although more than a single mechanism is involved in the weight gain induced by antipsychotic drugs, clonzapine and olanzapine are said to be the atypical antipsychotic medications which cause weight gain most easily [12-14]. In this study, we examined whether the patients’ antipsychotic medications were typical or atypical, and we examined their association with obesity. As a result, 14 subjects (77.8%) in the obese group took atypical antipsychotic medications, but so did as many as 10 subjects (55.8%) in the non-obese group. And no significant difference was found between the two groups. Thus, atypical antipsychotic medications could not be considered as the contributing factors to the obesity of the subjects in this study.
4.4. Diets
The dietary survey was performed on the basis of food records while using photographs as references for the conversion of the food quantity into weight in order to calculate the nutrient intake and the food intake according to food groups. We examined the existence or absence of differences between the two groups on the basis of 5 patterns: breakfast, lunch, dinner, snack, and oneday meal.
First, the nutrient intake from snacks in the obese group was significantly higher than that of in the nonobese group, in terms of energy and ten other nutrients. In addition, in food groups, the intake of favorite foods in the obese group was significantly higher than that of in the non-obese group. In other words, it was revealed that the snacks were one of the main contributing factors to the obesity of the study subjects.
However, regardless of the fact that the energy from snacks in the obese group was significantly higher (P = 0.002) than that of in the non-obese group, no significant difference was found between the two groups in terms of energy in one-day meals including snacks. And yet, the average amount of energy (standard deviation) in a oneday meal was 2267 (SD517) kcal in the obese group and 2000 (SD320) kcal in the non-obese group. The values in the obese group were 267 kcal higher. In addition, the average amount of energy in snacks was 308 (SD308) kcal in the obese group and 77 (SD107) kcal in the nonobese group. The values in the obese group were 231 kcal higher. The differences between the two groups in terms of amount of energy in one-day meals and in snacks were almost identical. These facts suggest that the obese group consume about 250 kcal more per day than the non-obese group, and that this would be due to snacks. The absence of significant difference is thought to be due to the small number of study subjects. In addition, according to previous studies, obese individuals tend to underreport their consumption when filling out the food record [15-18]. If similar tendencies were also observed in this study, it is possible to conclude that there could have actually been significant differences in energy between the obese group and the non-obese group.
On the other hand, as a result of a four-day dietary survey using the food record method, Henderson et al. reported that patients with schizophrenia had a significantly higher BMI but their energy intake was significantly lower than those of ordinary people. That is similar to the results of this study. As for the reason why they become obese despite the fact that their energy intake is almost the same or less than that of ordinary people, the findings of this study showed that snacks are one of the main contributing factors to the obesity of the subjects, and, in that consideration, the problem is primarily the timing of the snacks. When a person eats supper later than at 10:00 pm, sleeps immediately, and eats again in the middle of the night when he/she feels hungry, this facilitates energy intake and its conversion into fat, and results in an increase in adipose tissue mass [19]. Next is the problem of the quality of the snacks. The results of this study showed that the obese group had a significantly higher carbohydrate intake than the non-obese group in terms of one-day meals including snacks. If the ratio of the amount of simple sugars in those carbohydrates is high, it could easily result in an accumulation of visceral fat. And one more issue is in the way of eating. An irregular diet including fasting, between-meal snacks and midnight snacks causes disturbance of the circadian rhythm of the metabolic system and of the endocrine system which leads to obesity.
In the future, in order to prevent obesity and lifestylerelated diseases in patients with schizophrenia, it will be essential to determine the relationship between obesity and various causes other than overeating, such as the time they eat, the type of food they eat, and how they eat.
4.5. Limitations
First, there are problems with the self-administrated food record method and the 3-day period. Confirmation using photographs was performed in order to safeguard the validity of the self-administrated food records. Considering the fact that the study subjects were schizophrenic patients, jotting down records for more than 3 days proved to be difficult. Therefore, the method for conducting dietary surveys in psychiatric patients with diseases such as schizophrenia is one significant issue to be examined in the future.
Furthermore, we would like to perform highly accurate surveys closely focused on the issue of snacks revealed by this study, including the points which could not be determined this time, namely the timing of the snacks, the type of sugar they contain, and how to eat. And we hope that those will be reflected in dietary education in the future, as a preventive measure against obesity in patients with schizophrenia.
5. Conclusion
The dietary survey revealed that snacks are major contributing factors to obesity. Based on this dietary survey, it becomes necessary to focus on snacks, in addition to basic focus on balanced diet as well, to prevent further obesity in those schizophrenic patients.
6. Acknowledgements
We express our sincere gratitude to all the patients for their cooperation in the survey, to the physicians at Kohdo Mental Hospital, Dr. Kiyoko Tamura, Chief of the Outpatient Department, Nurse Yoshie Osaki, Nurse Maki Sato, Mr. Fumihiro Watanabe, Chief of the Division of Day Care, and to all staff members at the Department of Nutrition for their collaboration in this study.
REFERENCES
- Y. Inamura, T. Sagae, K. Nakamachi, M. Hirabayashi and K. Matsumura, “Seishinka Kanja No Taiingo No Shokuseikatsu Jittaichosa to Kadai,” Journal of JPHA, Vol. 25, No. 4, 2006, pp. 107-114.
- T. Hideno, K. Asai and Y. Okubo, “Mansei Seishinbunretsubyo Kanja No Himan Taisaku,” Japanese Journal of Psychiatric Treatment, Vol. 12, No. 12, 1997, pp. 1423- 1429.
- H. Hoshino, “The Accelation of Appetite Weight Gain through the Process of Recovery for Schizophrenic Patients (from the Therapeutic Point of View),” Japanese Journal of Psychiatric Treatment, Vol. 12, No. 12, 1997, pp. 1431-1437.
- Y. Inamura, “Seishinka Ni Okeru Eiyo Shokuji Sido Shokuseikatsu Sido Wo Kangaeru,” Journal of JPHA, Vol. 17, No. 9, 1998, pp. 906-911.
- S. M. Stshl, “How to Appease the Appetite of Psychotropic Drugs,” Journal of Clinical Psychiatry, Vol. 59, No. 10, 1998, pp. 500-501. doi:10.4088/JCP.v59n1001
- T. Wetterling and H. E. Musigbrodt, “Weight Gain: Side Effect of Atypical Neuroleptics,” Journal of Clinical Psychopharmacology, Vol. 19, No. 4, 1999, pp. 316-321. doi:10.1097/00004714-199908000-00006
- H. Nasrallah, “A Review of the Effect of Atypical Antipsychotics on Weight,” Psychoneuroendocrinology, Vol. 28, 2003, pp. 83-96. doi:10.1016/S0306-4530(02)00114-2
- D. C. Henderson, C. P. Borba , T. B. Daley, R. Boxill, D. D. Nguyen, et al., “Dietary Intake Profile of Patient with Schizophrenia,” Annals of Clinical Psychiatry, Vol. 18, No. 2, 2006, pp. 99-105. doi:10.1080/10401230600614538
- S. Brown, J. Birtwistle, L. Roe and C. Thompson, “The Unhealthy Lifestyle of People with Schizophrenia,” Psychological Medicine, Vol. 29, No. 3, 1999, pp. 697-701. doi:10.1017/S0033291798008186
- T. R. Kosten and D. M. Ziedonis, “Substance Abuse and Schizophrenics,” Schizophrenia Buiietim, Vol. 23, No. 2, 1997, pp. 181-186. doi:10.1093/schbul/23.2.181
- D. A. Wirshing, W. C. Wirshing, L. Kysar, M. A. Berisford, D. Goldstein, et al., “Novel Antipsychotics: Comparison of Weight Gain Liabilities,” Journal of Clinical Psychopharmacology, Vol. 60, 1999, pp. 358-363. doi:10.4088/JCP.v60n0602
- K. Sawamura and T. Someya, “Medication to Weight Gain Induced by Olanzapine and Quetiapine. H2 Antagonist,” Medicine Psychiatry Psychology, Vol. 52, No. 7, 2004, pp. 959-964.
- T. Nagamine, “Shinki Koseishinbyoyaku Ni Mirareru Sintaigappeisho,” The Journal of Practical Pharmacy, Vol. 56, No. 10, 2005, pp. 17-26.
- J. Senba, “Shinki Koseishinbyoyaku No Tokucho,” The Journal of Practical Pharmacy, Vol. 56, No. 10, 2005, pp. 3-11.
- H. Okubo and S. Sasaki, “Underreporting of Energy Intake among Japanese Women Aged 18 - 20 Years and Its Association with Reported Nutrient and Food Group Intakes,” Public Health Nutrition, Vol. 7, No. 7, 2004, pp. 911-917. doi:10.1079/PHN2004635
- M. B. Livingstone and A. E. Black, “Markers of the Validity of Reported Energy Intake,” Journal of Nutrition, Vol. 133, No. 3, 2003, pp. 895-920.
- R. J. Hill and P. S. Davies, “The Validity of Self-Reported Energy Intakes as Determined Using the Doubly Labeled Water Technique,” British Journal of Nutrition, Vol. 85, No. 4, 2001, pp. 415-430. doi:10.1079/BJN2000281
- J. Trabulsi and D. A. Schoeller, “Evaluation of Dietary Assessment Instruments against Doubly Labeled Water: A Biomarker of Habitual Energy Intake,” American Journal of Physiology—Endocrinology and Metabolism, Vol. 281, 2001, pp. 891-899.
- S. Shimba, N. Ishii, Y. Ohta, T. Ohno, Y. Watabe, et al., “Brain and Muscle Arnt-Like Protein-1 (BMAL1): A Component of the Molecular Clock, Regulates Adipogenesis,” Proceedings of the National Academy of Sciences of American, Vol. 102, No. 34, 2005, pp. 12071- 12076. doi:10.1073/pnas.0502383102