Food and Nutrition Sciences
Vol. 3 No. 7 (2012) , Article ID: 20462 , 6 pages DOI:10.4236/fns.2012.37122
Optimization of Process Conditions for the Development of Tomato Foam by Box-Behnken Design
![]()
1Central Institute of Agricultural Engineering, Bhopal, India; 2Central University, Pondicherry, India; 3Central Institute of Post-Harvest Engineering and Technology, Ludhiana, India.
Email: *balaciphet@yahoo.com
Received March 9th, 2012; revised June 11th, 2012; accepted June 18th, 2012
Keywords: Foaming; Tomato Juice; Response Surface Methodology; Box Behnken Design; Expansion Volume; Foam Density
ABSTRACT
The present work aims to optimize the foaming conditions for tomato juice using three level Box-Behnken Experimental Design of Response surface Methodology. In the following study three process parameters namely concentration of egg albumin (EA) as foaming agent, carboxy methyl cellulose (CMC) as foam stabilizer and whipping time (WT) was optimized. The levels for various input variables were EA: 5% - 15%, CMC: 0.10% - 0.60% & WT: 3 - 7 min. The responses measured were expansion volume (EV), foam density (FD) and drainage volume (DV) which is an indication of foaming ability and foam stability. The predicted levels of responses as generated by software were EV: 91.49%, FD: 0.558 g/cc & DV: 10 ml, which on validation was found closer to experimental value.
1. Introduction
Tomato is relished by humans all over the world in one form or the other. Apart from its aesthetic appeal, it has lot of nutritive value which adds on to its popularity. Tomatoes are an important source of minerals, iron, phosphorus, organic acids, essential amino acids, dietary fibers, β-carotene pigments, antioxidants such as lycopene, phenolics and vitamins (A & C) [1-3]. Owing to its several advantages, the preservation of fruit is must to increase its availability throughout the year. Several methods are used for the preservation of tomatoes. The most common one is dehydration of tomato into powder which can be reconstituted into juice and used as a starter for the preparation of products like sauce, ketchup, chutney, soups, baby foods etc. The dehydration of tomato can be done by several methods like air drying, spray drying, freeze drying, microwave drying, foam mat drying etc. Foam mat drying is one method which is gaining popularityand has been successfully applied to drying of tomato juice [3]. The foam mat drying is a process where a liquid or semi-solid food product like fruit juices, vegetable puree or cereal pastes are converted into stable foams by whipping air or an inert gas in the presence of an edible foaming agent and/or stabilizer followed by drying which decreases the product moisture to 2% - 2.5%. The stabilized foam is deposited as a uniform layerlike a mat, and can be dried either by air drying, freeze drying or any other type of drying method. The dried product is scraped off from the drying surface in the form of flakes which is then converted to fine powder and sealed immediately to prevent any gain of moisture. The process has advantages like lower drying time due to the physical structure of foam (honeycomb structure) which results in easy and quick removal of moisture from a food and also reduces the nutritional losses. Apart from this, the process results in a product which has a better reconstitution and better quality as compared to nonfoamed product [4,5]. The advantages of foam mat drying are applicable only if the foam is thermodynamically and mechanically stable. The unstable foamed products are difficult to dry and remove from the drying surface and have poor color, texture, flavor, and nutritive value [6]. A number of factors are responsible for generating stable foam like foaming agents (egg albumin, Milk, GMS etc.), foam stabilizers (gelatin, carboxy methyl cellulose, xanthan gum etc.), whipping time, method of incorporation of air etc. Thus, in order to obtain stable foam it is important to optimize the various process conditions by selecting the appropriate concentration of foaming agents, foam stabilizers, pulp concentrations, whipping time etc. The concentration of the foam stabilizer and/or agent should be optimized as below the critical concentration in which the foam is unstable, whereas overdosed stabilizer can result in foam collapse [4]. The optimization of process parameters can be done by various techniques; one of the effective and commonly used techniques for this purpose is Response Surface Methodology, which is a collection of statistical and mathematical techniques useful for developing, improving and optimizing processes [7]. This technique is a faster and economical method for gathering research results than classic one variable at a time or full factors experimentation [8]. The statistical tool has been successfully used in optimization of foaming conditions of bael Pulp [6]. Thus, the present study aims to optimize the foaming conditions of tomato juice using Response Surface Methodology (RSM) which can be successfully dried by the process of foam mat drying. This optimization method can help in determining the favorable conditions for stable foam which doesn’t collapse during consecutive operations of batch drying, which would ultimately help in gaining economic advantages to the industries with increased production and a high quality product.
2. Materials and Methods
2.1. Sample Preparation
Fully ripe, red colored tomatoes, free from blemishes or cuts were obtained from local market of Ludhiana, India. Tomatoes were washed manually under tap water to clean the adhering dirt and sorted to obtain uniform and good quality product. The tomatoes were blanched at 96˚C for 3 - 4 min followed by immediate cooling. Tomato pulp was made using tomato pulper (TNAU, Coimbatore, India), which also separates skin and seeds. The Physico-chemical analysis of tomato juice was carried out as per AOAC (Association of Official Analytical Chemists) [9] and the results are presented in Table 1. Eggs were procured from local market of Ludhiana and broken to separate egg albumin from yolk. The egg albumin extract was homogenized and used as foaming agent. Sodium salt of carboxymethyl cellulose laboratory reagent (Central Drug House, New Delhi, India) was used as foam stabilizer at different concentrations.
2.2. Foaming Trials
About 200 ml of tomato juice was foamed using a hand
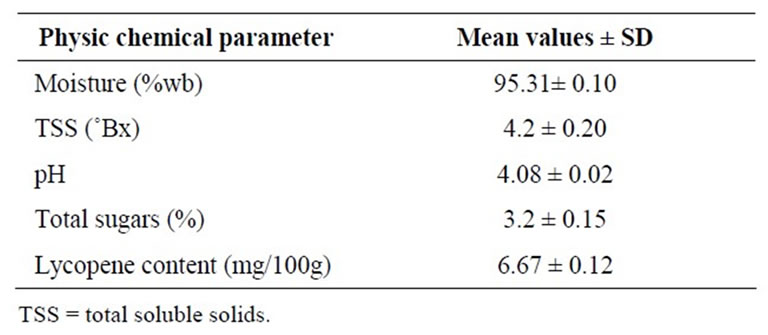
Table 1. Physico-chemical analysis of tomato juice.
blender (ORPAT, model: HHB 100E WOB, Ajanta limited, Morbi, India) which was operated at (18,000) constant rpm with three varying conditions i.e. foaming agent (EA), foam stabilizer (CMC) and whipping time (WT). The foam expansion volume, foam density and drainage volume were studied as responses of various foaming conditions.
2.3. Determination of Responses
2.3.1. Foam Expansion Volume (EV)
It is used to indicate the amount of air incorporated into the juice during foaming and measures as percent increase in volume of juice. It was calculated using the following equation [10].
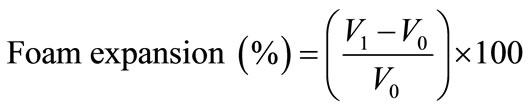 (1)
(1)
where, V0 = Initial volume (cc) and V1 = Final volume (cc).
2.3.2. Foam Density (FD)
FD was determined using the method described by Labelle [11]. 100 ml of foam was transferred into a 250 ml measuring cylinder and weighed. The foam transferring was carried out very carefully to avoid destroying the foam structure or trapping the air voids filling the cylinder.
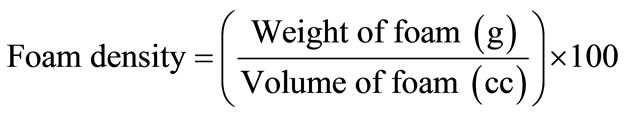 (2)
(2)
2.3.3. Foam Drainage Volume (DV)
The foam drainage method, as described by Sauter and Montoure [12] was used to check the strength of the foam lamellae in terms of the volume of liquid drained in a given time. In this method, the foam was filled into a buchner filter (80 mm) and placed over a graduated conical or measuring cylinder. The sample was allowed to drain under pressure and the sample collected after an hour was measured [6].
2.4. Experimental Design
The Box-Behnken designs (BBD) of response surface methodology with three levels were used for the study. The process was optimized on the basis of three input variables whose interactions were studied as three major responses. On the basis of preliminary single factor experiments the levels of input variables were determined. The levels of various input variables selected were as follows: concentration of EA: 5% - 15% (w/w), concentration of CMC: 0.15% - 0.60% (w/w) and WT: 3 - 7 min. All the responses were analyzed in triplicates and the average value was reported. The responses selected i.e. expansion volume, foam density and drainage volume was a measure of foaming capacity and foam stability of tomato juice foam under various foaming conditions. Seventeen runs were carried out to select the best combination of input variables which could result in most suitable foam. The test factors were coded according to the following equation:
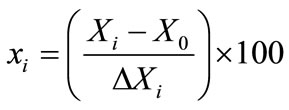 (3)
(3)
where, xi = dimensionless value of an independent variable, Xi = level or value of controllable factor i in original units of measurement, X0 = midpoint of the range of values for factor i, ∆Xi = range of values over the factor i will vary. Low and high levels of each factor were coded as –1 and +1 keeping 0 as mid-point [6,13]. Since the various responses were the result of various interactions of independent variables, therefore the following second order polynomial regression equation was fitted to the experimental data of all responses, Equation (4).
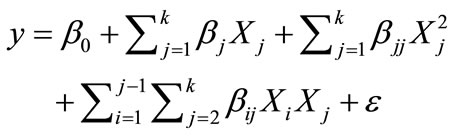 (4)
(4)
where, y = predicted response, β0 = a constant, βi = linear coefficient, βii = squared coefficient, and βij = interaction coefficient, Xi and Xj are the independent variables and  is noise or error (6).
2.5. Statistical Analysis
Regression analysis and analysis of variance (ANOVA) was used for fitting the models represented by Equation (4) and also to examine the statistical significance of the model terms. The adequacy of the models were determined using model analysis and R2 (coefficient of determination) analysis. F-Value was determined to check the significance of all the fitted equation at 5% level of significance [14,15]. In order to visualize the relationship between the response and experimental levels of each factors and to deduce the optimum conditions, the fitted equations were expressed as contour plots which were generated using statistical package, Design expert® software (version 8.0.5.2, 2010, Minneapolis MN, USA).
3. Results and Discussion
The various combinations of independent variables generated by BBD of RSM are depicted in Table 2. The combinations were tested in triplicates which resulted in different values of various responses.
3.1. Evaluation of Fitted Model
The average of triplicate responses obtained for each
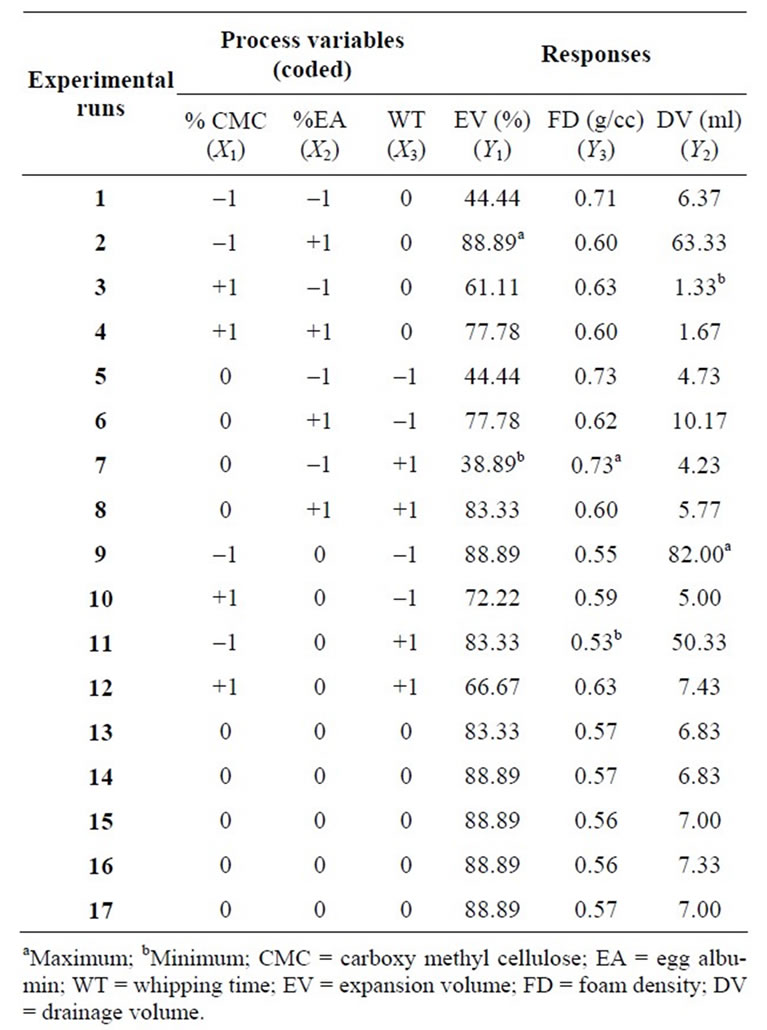
Table 2. Experimental design for foam development from tomato juice with experimental value of responses.
experimental combination was fitted in the general form of quadratic polynomial model (Equation (4)). Response fit analyses, regression coefficient estimations and model significance evaluations were conducted. The estimated regression coefficients of the fitted quadratic equation as well as the correlation coefficients for each model are given in Table 3. The adequacy of the models was tested using F-ratio and coefficient of determination (R2).
3.2. Analysis of Various Process Responses
3.2.1. Expansion Volume
It is used to indicate the amount of air incorporated into the juice during foaming and measures in percentage the increase in volume of juice. For the various combinations, experimental expansion volume ranged from 38.89% to 88.89% (Table 2). Using the values of significant coefficients in the second order polynomial equation (Table 3), the model for expansion volume was established as follows:
 (5)
(5)
The statistical significance of Equation (4) was checked through Analysis of Variance (ANOVA) (Table 4). The
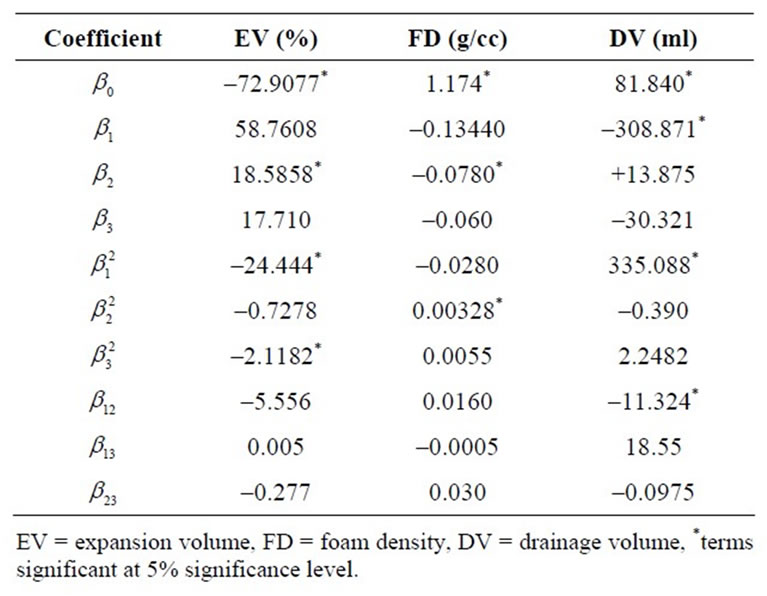
Table 3. Estimated coefficients of second order polynomial regression model.
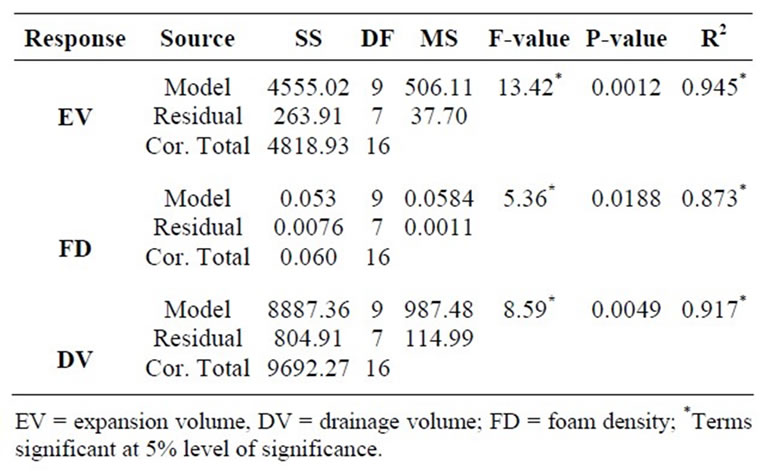
Table 4. ANOVA for the response surface quadratic model.
model F-value of 13.42 implies that the model is significant. There exists a 0.12% chance. For the model fitted, the coefficient of determination (R2 = 0.945) which indicates the goodness of a model [16]. It means that the foam volume was significant as a response for varying foaming conditions. From the above data, it can be interpreted that the selected model can help us to optimise the foaming conditions with significant relationship among the parameters chosen. The response surface plot showing effect of varying EA and CMC concentration with constant whipping time of 5 min on expansion volume (Figure 1). From the plot it can be seen that the increasing EA concentration increases the expansion volume whereas with increasing CMC concentration till 0.35% the expansion volume increased but there after the expansion volume showed a decreasing trend. The reason for increase in EV may be the presence of proteins in EA, when EA is whipped, the proteins denature at the inter phase and interacts with one another to form a stable, visco-elastic interfacial film thereby resulting in foam formation and increasing the volume of tomato foam [17]. The possible reason for decrease in EV with increasing
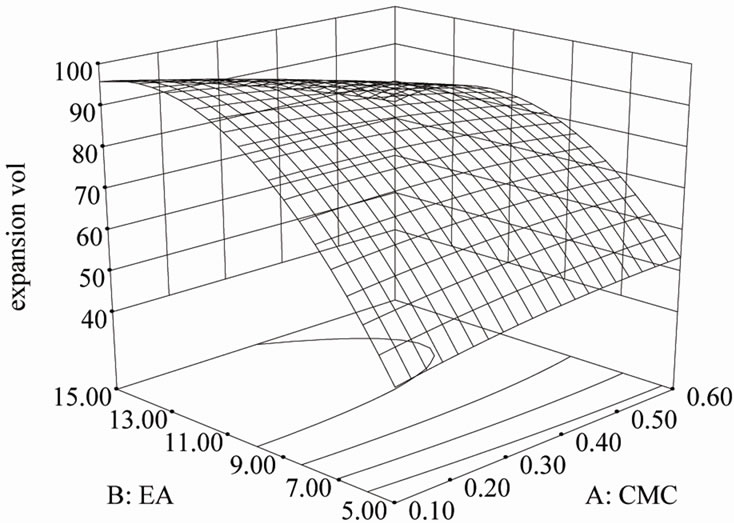
Figure 1. Response surface plot showing the effect of varying concentration of egg albumin (EA, %) and carboxy methyl cellulose (CMC, %) on expansion volume (%).
CMC can be that CMC stabilises the foam by increasing viscosity. At higher concentration the solution becomes too viscous and it has been suggested that high viscosity liquid would prevent the trapping of air during whipping [6].
3.2.2. Foam Density
Foam density is commonly used to evaluate the whipping properties. The more air incorporated during whipping, the lower the foam density; the more air present in the foam, the higher the whippability [6,18]. The experimental values for foam density were ranged from 0.53 to 0.73 g/cc (Table 2). The second order polynomial equation foam density with significant equation coefficients (Table 3) is as follows:
 (6)
(6)
From Table 4, it can be inferred that the F-value of 5.36 is significant. There is only a 1.88% chance that a Model F-value this large could occur due to noise. The coefficient of determination (R2) of 0.8734 was also found to be significant. From the response surface plot (Figure 2), it can be seen that EA and CMC concentration had a similar effect on foam density as that of expansion volume as both the responses are related to each other, less foam density results in greater expansion and vice versa.
3.2.3. Drainage Volume
It reflects the water holding capacity of the foam. It is an efficient way to determine the stability of foam as it measures the rate at which the liquid drains from it [19]. Minimum Foam drainage volume was found to be 1.33 ml whereas maximum was 82 ml (Table 2). DV as high as 82 ml signifies lower water holding capacity of foam, thus increased chances of foam collapse as drainage is accompanied by a progressive thinning of the lamellae and may, therefore, enhance the probability of film collapse [10]. For drainage volume the second order quadratic model with significant coefficients is as follows:
 (7)
(7)
The negative coefficient of CMC and WT indicates that with increase in these parameters the drainage volume decreases, which was observed experimentally too. However, too high concentration of CMC can also not be selected as it has limiting action on foam density and expansion volume. From ANOVA table it can be seen that the F-value of 8.59 is significant and there is only a 0.49% chance that a model F-Value this large could occur due to noise. The R2 value was also found to be significant. The response surface graph for drainage volume at constant whipping time is shown in Figure 3.
3.3. Optimization and Validation of Process
After the development of models for various responses i.e. EV, FD and DV, the optimization of the process parameters depending upon the results was done. From the various data obtained and by their statistical analysis, the appropriate range or values for various process parame-
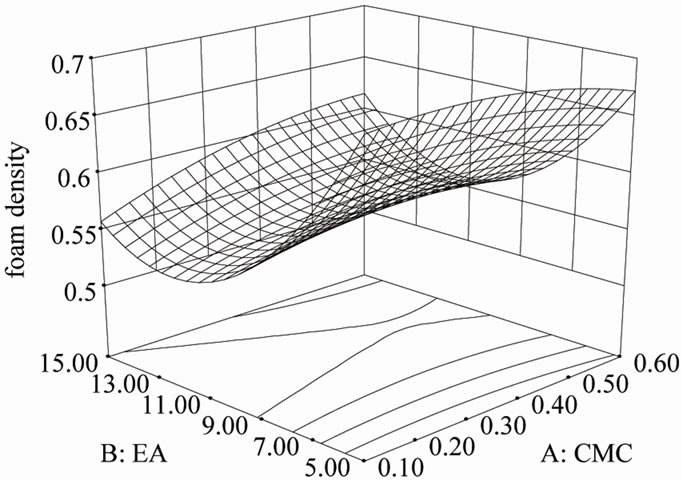
Figure 2. Response surface plot showing the effect of egg albumin (EA, %) and carboxy methyl cellulose (CMC, %) on foam density (g/cc).
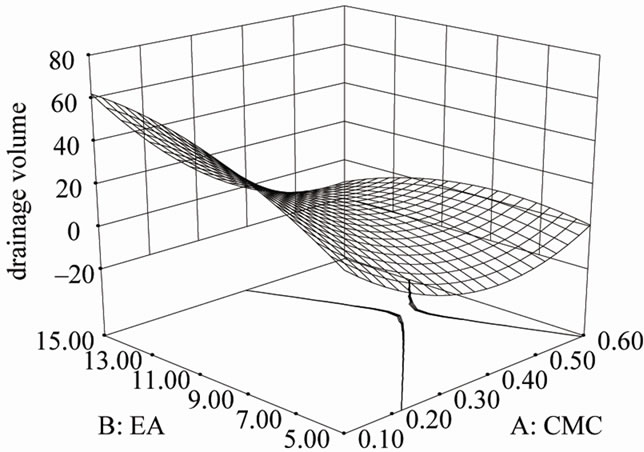
Figure 3. Response surface plot showing effect of Egg albumin (EA, %) and carboxy methyl cellulose (CMC, %) on foam drainage volume (ml).
ters were selected like minimum value for DV and FD was selected whereas a high value for EV was used. The criteria used for optimization along with predicted value of responses have been presented in Table 5. The optimum conditions for best product quality in terms of expansion volume and foam density can also be determined by intersection zone of minimum foam density and maximum expansion volume as presented in the overlay plot of EA and CMC (Figure 4). Once the optimum conditions have been determined, to validate those conditions and predictive models was used in decision making only after subjection to validation [20,21]. Based on the range selected, the predicted outcome of output variables which would result in most stable foam was established. The combination with highest desirability was selected and validated for efficacy. The results are presented in Table 5. The expansion volume was found little bit less than the predicted value, however it is within the acceptable limits, foam density was similar to predicted value and drainage volume was found lesser than predicted value, which is
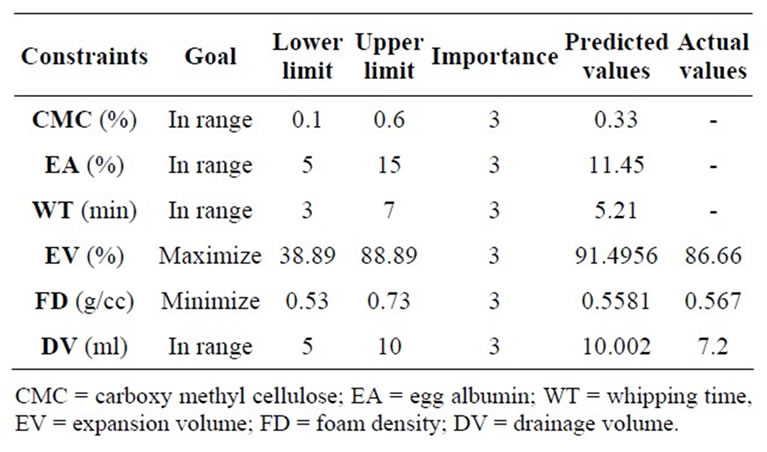
Table 5. Criteria used for optimization along with predicted and actual value of responses.
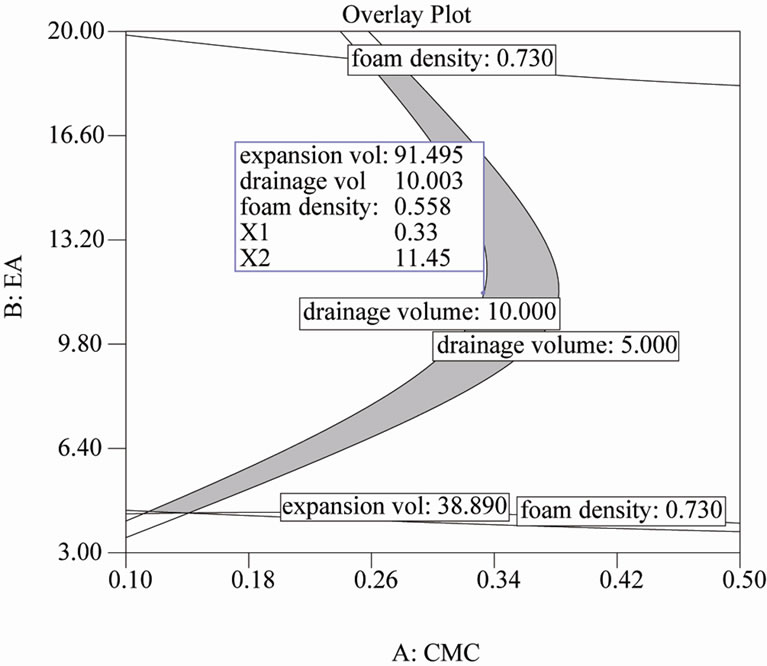
Figure 4. Overlay plot showing the level of input variables and predicted values of responses.
an indication of more stable foam.
4. Conclusion
Response Surface Methodology was successfully used in optimization of foaming conditions of tomato juice. The Box behnken design of RSM was found effective in determining the optimum zone within the experimental region. The optimized conditions of various input variables i.e. %EA, %CMC and WT were found to be 11.45%, 0.33% and 5.21 min respectively which on validation was found to give a stable foam structure. Thus, we can conclude that using this optimized combination we can get thermodynamically and mechanically stable foam which can be successfully dried using foam mat drying which provides advantages of quick drying, lower drying temperature, reduced loss of nutrients etc.
REFERENCES
- A. A. Abushita, E. A. Hebshi, H. G. Daood and P. A. Biacs, “Determination of Antioxidant Vitamins in Tomatoes,” Food Chemistry, Vol. 60, 1997, pp. 207-212. doi:10.1016/S0308-8146(96)00321-4
- S. K. Clinton, “Lycopene: Chemistry, Biology, and Implications for Human Health and Disease,” Nutrition Reviews, Vol. 56, No. 2, 1998, pp. 35-51. doi:10.1111/j.1753-4887.1998.tb01691.x
- D. M. Kadam and S. Balasubramanian, “Foam Mat Drying of Tomato Juice,” Journal of Food Process and Preservation, Vol. 35, No. 4, 2011, pp. 488-495. doi:10.1111/j.1745-4549.2010.00492.x
- C. Ratti and T. Kudra, “Drying of Foamed Biological Materials: Opportunities and Challenges,” Drying Technology, Vol. 24, No. 9, 2006, pp.1101-1108. doi:10.1080/07373930600778213
- P. Rajkumar, R. Kailappan, R. Vishwanathan and G. S. V. Raghavan, “Drying Characteristics of Foamed Alphonso Mango Pulp in a Continuous Type Foam Mat Drier,” Journal of Food Engineering, Vol. 79, No. 4, pp. 1452- 1459. doi:10.1016/j.jfoodeng.2006.04.027
- S. K. Bag, P. P. Srivastav and H. N. Mishra, “Optimization of Process Parameters for Foaming of Bael (Aeglemarmelos L.) Fruit Pulp,” Food Bioprocess Technology, Vol. 4, No. 8, 2011, pp. 1450-1458. doi:10.1007/s11947-009-0243-6
- M. K. Carley, Y. N. Kamneva and J. Reminga, “Response Surface Methodology,” CASOS Technical Report, CMUISRI-04-136, 2004.
- F. Li, L. Yang, T. Zhao, J. Zou, Y. Zou and X. Wu, “Optimization of Enzymatic Pretreatment for n-Hexane Extraction of Oil from Silybummarianumseeds Using Response Surface Methodology,” Food Bioproducts Processing, Vol. 90, No. 2, 2012, pp. 87-94. doi:10.1016/j.fbp.2011.02.010
- Association of Official Analytical Chemists, “Methods 14.002 (Moisture),” Official Methods of Analysis, 13th Edition, Washington DC, 2000.
- D. J. Durian and D. A. Weitz, “Encyclopedia of Chemical Technology,” M. H. Grant, Ed., Wiley, New York, 1994, p. 783.
- R. L. Labelle, “Characterization of Foams for Foam Mat Drying,” Food Technology, Vol. 20, No. 8, 1966, pp. 1067- 1070.
- E. A. Sauter and J. E. Montoure, “The Relationship of Lysosyme Content of Egg White to Volume and Stability of Foams,” Journal of Food Science, Vol. 37, No. 6, 1972, pp. 918-920. doi:10.1111/j.1365-2621.1972.tb03703.x
- E. del Castillo, “An Overview of Empirical Process Optimization,” Process Optimisation: A Statistical Approach, Springer Inc., New York, 2007.
- S. Kaur, B. C. Sarkar, H. K. Sharma and C. Singh, “Optimization of Enzymatic Hydrolysis Pretreatment Conditions for Enhanced Juice Recovery from Guava Fruit Using Response Surface Methodology,” Food Bioprocess Technology, Vol. 2, No. 1, 2009, pp. 96-100. doi:10.1007/s11947-008-0119-1
- S. Mangaraj and K. P. Singh, “Optimization of Machine Parameters for Milling of Pigeon Pea Using RSM,” Food Bioprocess Technology, Vol. 4, No. 5, 2011, pp. 762-769. doi:10.1007/s11947-009-0215-x
- J. Lee, L. Ye, W. O. Landen and R. R. Eitenmiller, “Optimization of an Extraction Procedure for the Quantification of Vitamin E in Tomato and Broccoli Using Response Surface Methodology,” Journal of Food Composition and Analysis, Vol. 13, No. 1, 2000, pp. 45-57. doi:10.1006/jfca.1999.0845
- N. S. Manay and M. Shadaksharaswamy, “Properties of Food,” Food: Facts and Principles, New Age International Pvt. Ltd, 2001.
- K. O. Falade and B. S. Omojola, “Effect of Processing Methods on Physical, Chemical, Rheological and Sensory Properties of Okra (Abelmoschusesculentus),” Journal of Food and Bioprocess Technology, Vol. 3, No. 3, 2010, pp. 387-394. doi:10.1007/s11947-008-0126-2
- N. Kampf, M. C. Gonzalez, M. G. Corradini and M. Peleg, “Effects of Two Gums on the Development, Rheological Properties and Stability of Egg Albumen Foams,” Rheologica Acta, Vol. 42, No. 3, 2003, pp. 259-268.
- A. Jagannath and T. Tsuchido, “Validation of a Polynomial Regression Model: The Thermal Inactivation of Bacillus subtilis spores in Milk,” Letters in Applied Microbiology, Vol. 37, No. 5, 2003, pp. 399-404. doi:10.1046/j.1472-765X.2003.01416.x
- A. A. Gabriel and H. Nakano, “Application of Response Surface Methodology in the Formulation of Nutrient Broth Systems with Predetermined pH and Water Activity,” African Journal of Microbiology Research, Vol. 3, No. 11, 2009, pp. 833-839.
NOTES
*Corresponding author.