Advances in Remote Sensing
Vol.2 No.2(2013), Article ID:32772,8 pages DOI:10.4236/ars.2013.22012
Internet-Based Spectral Database for Different Land Covers in Egypt
1Agricultural Applications Department, National Authority for Remote Sensing and Space Sciences (NARSS), Cairo, Egypt
2Environment Canada, Data Assimilation & Satellite Meteorology Research, Toronto, Canada
3Data Warehouse, National Authority for Remote Sensing and Space Sciences (NARSS), Cairo, Egypt
Email: smarafat@narss.sci.eg, efarg@narss.sci.eg, mohammed.shokr@ec.gc.ca, galkzaz@narss.sci.eg
Copyright © 2013 S. M. Arafat et al. This is an open access article distributed under the Creative Commons Attribution License, which permits unrestricted use, distribution, and reproduction in any medium, provided the original work is properly cited.
Received February 11, 2013; revised March 14, 2013; accepted March 22, 2013
Keywords: Spectral Signatures; Hyperstectral; Spectroradiometer; Database; Spaceborne; Airborne
ABSTRACT
The spectral signatures of natural objects in the visible and near-infrared spectral range are influenced by the object’s physical and biochemical properties. These signatures can be compiled in a database and used to retrieve information of land cover types and their physical composition from actual hyperspectral observations. This paper describes development process of hyperstectral database of reflectance from different land cover types in Egypt. It has been compiled from data obtained using a ground-based spectroradiometer system that covers the spectral range from 350 to 2500 nm at 1 nm resolution. The database is accessible through a website http://www.spectraldb.narss.sci.eg/spectral, where the system includes also metadata that describes the site environment and measurement processes. The system provides flexible mechanisms and friendly interfaces to allow accessing the database by the non-specialized people, whereas spectral data can be sorted by sites, species or selected environmental parameters. The system presents sample results from different vegetation and soil covers. Development of such a database is essential for different remote sensing applications, satellite’s calibrations, data dissemination and linkage with other databases for scientific researches purposes.
1. Introduction
A hyperspectral signature of a certain surface cover (e.g. vegetation or rock type) is a record of reflectance from a surface at hundreds or thousands of continuous spectral bands with narrow bandwidth. A collection of such signatures for different surfaces called hyperspectral database (or library). The database can be used later against measured hyperspectral observations from ground instrument, airborne, or spaceborne sensor to define the surface and retrieve its geophysical properties. For example, observed hyperspectral data from an airborne or spaceborne sensor can be comparing against hyperspectral signatures of different surfaces in order to identify the surface with the closest signature. A wide range of applications using hyperspectral databases have been developed in the fields of vegetations and soil management. This includes vegetation classification, crop infestation, plant pigmentation, and soil composition and moisture contents [1-11]. The hyperspectral signatures are used also to calibrate, validate, and simulate remotesensing imagery obtained from visible and near infrared sensors (wavelength between 0.4 to 3 nm). The interpretation of the hyperspectral data is not usually simple due to their high dimensionality that is the result of sampling a wide spectral range in very narrow bands.
Instruments that are used to measure hyperspectral signature of surface cover called spectroradiometers. They allow non-destructive sampling of radiation from the surface and enable users to measure spectral signatures under different physical and geometrical conditions. Operation of these instruments tends to be relatively easy and data are collected quickly [12]. Examples of commercial instruments include the ASD Field Spec (350 - 2500 nm), Apogee/StellarNet SPEC-PAR/NIR (350 - 950 nm), StallerNet EPP2000-NIR-InGaAs (400 - 1700 nm) and Spectral Evolution PSR-3500 (350 - 2100 nm).
The structure of hypercpectral database of spectral signatures should allow easy access by users in terms of searching, retrieving and viewing information. The users may be able to search the data using different criteria such as surface cover category (including classes and subclass), data acquisition time or location or just by typing a keyword. For efficient research, spectral data need to be augmented by metadata and stored in an organized way [13]. It is stated that an organized, shareable and non-redundant storage of spectral data and associated metadata are important features towards better data quality and accessibility. Major hyperspectral databases include SPECCHIO [14] and SpectraProc DB [12]. SPECCHIO is a spectral database that holds reference and actual field spectra obtained from several spectroradiometers. Different spectroradiometrs produce data encrypted differently. SPECCHIO can incorporate data from different spectral device. Metadata are also included since they ensure the durability of database and enables the sharing of spectral data between research groups. SpectraProc DB, on the other hand, was specifically designed to provide fast, repeatable processing of hyperspectral data only from any Analytical System Device (ASD) FieldSpec Pro spectral data files. It includes many features of data organization and standard preprocessing.
Sharing spectral signature datasets with other scientists is complicated due to differences in data collection techniques and sampling environment conditions [15]. One common feature of all hyperspectral databases is their significant amounts of data that cover not only numerous electromagnetic wavelength but also a wide range of incidence angles and surface cover conditions (e.g. minerals impurity, crop infestation, etc.).
The National Authority of Remote Sensing and Space Science (NARSS) in Egypt have compiled a hyperspectral database of different vegetations, soil and rock types as well as sea and lake water. The data were obtained from field measurements using an ASD Field Spec 3 spectroradiometer. This was pursued through a collaborative project between NARSS and Mediterranean Agronomic Institute of Chania (MAICh). The project, called GI@MED aimed at the creation of a Greek-Egyptian bilateral axis for the promotion of applications of modern geoinformation technology in the sectors of Agriculture and the Environment in the South-eastern Mediterranean. More information can be accessed through http://www.gi-eastmed.net/.
The database has been incorporated in a web-based system with appropriate user interface that offers easy accessibility to the data. This paper addresses the procedure of the hyperspectral data acquisition and an overall description of the database systems, including storage and processing. Sample results of signatures of vegetation crops are also introduced.
2. Methods
2.1. Spectroradiometr
Radiometry is the subject of measuring electromagnetic reflection in the visible and near infrared bands. This requires measuring the input (i.e. irradiance) to the surface and the reflection (radiance) from the surface. In remote sensing, in-situ radiometry measurements are important in order to relate the airborne or spaceborne observations to ground measurements. Radiant energy and radiant flux are measured in Joule (J) and Watt (W), respectively. Radiance and spectral radiance are commonly measured in W∙m−2∙sr−1 and W∙m−2∙sr−1∙nm−1, respectively. Field spectrometry is the quantitative measurement of radiance, irradiance, reflectance, or transmission in the field. That involves the collection of accurate spectra and requires an awareness of the influences of many parameters such as sources of illumination, atmospheric characteristics and stability, winds, instrument field-of-view, sample viewing and illumination geometry, instrument scanning time and spatial and temporal variability of the sample characteristics.
A Spectrometer is an instrument that measures the radiation over specific bands of the electromagnetic spectrum, usually from gamma rays into the far infrared. This instrument is also called spectroradiometer. It is used in measuring the spectral distribution of radiation in very narrow bands (measured in nanometers). Spectroradiometers are used to confirm the specifications of light sources and calibrate display devices such as screens of laptops. In remote sensing, they are used to acquire a reference database of the spectral signatures of ground cover types, and use them later to retrieve ground parameters from the observations. Accurate spectral measurements require awareness of many influences and parameters. This includes sources of illumination, atmospheric characteristics and stability, winds, the instrument’s field-of-view, the sample viewing and illuminetion geometry, the instrument scanning time and the spatial and temporal variability of the sample characteristics.
In this study, a hyperspectral instrument called Analytical Spectrum Device (ASD FieldSpec®3HR) was used to measure the spectral signature of different land cover types. This a high resolution (HR) instrument, operates in the full optical spectral range (visible, near infrared and short wave infrared) starting from 350 nm to 2500 nm. The sampling interval is 1.4 nm within the range 350 - 1050 nm and 2 nm within the range 1000 - 2500 nm. The measured reflectance is resampled to produce a spectrum at 1 nm interval for the entire range.
2.2. Data Collection
A protocol of spectroscopy measurements was developed. It includes the following steps: 1) A visit to each site was planned before the actual field measurements in order to examine its features and estimate the time required for travelling between sites. This is important because the spectroradiometr can work only within a certain range of sun zenith angle (available between 10:00 am and 2:00 pm). 2) The location of the site determined accurately using a Garmin Etrex vista HCX GPS device that connected to spectroradiometer controller unit to acquire location data automatically. In addition to the environmental conditions are suitable for taking the measurements. Measurements under cloudy sky require special procedures. 3) The instrument should be calibrated before any measurements are taken or at least every 15 minutes. In the case of thick cloud cover, a new calibration should be performed after the sky is clear again.
The measurement scheme includes acquisition of hyperspectral signature from different “samples” and several “replications” within each sample. A replication is the average of 25 spectra; a fixed number by the instrument. The number of replications is between 3 and 10. The sample is obtained at a certain location for a certain type of surface cover. Examples of surface types include field crops, species of natural vegetations, soil types, rock types as well as natural and artificial water bodies. Several samples are taken of the same surface types at different locations. Metadata are recorded for each sample. This includes environmental, geographical, surface and instrument’s parameters. Different samples are taken for the same surface under different environmental conditions (as described by the metadata) or if the surface conditions vary (e.g. irrigation conditions, stressed plants, infested areas, etc.). The wider the variety of the conditions the more number of samples that have to be taken. This warrants better representation of the averaged hyperspectral signature from the surface cover types.
Most of the data were collected at height range from 30 - 50 cm above the target surface at nadir position (90˚) by hand held technique. In some situations the instrument was mounted on the 10 meter Mobile Unit for Field Spectroradiometric Measurements at Mediterranean (MUFSPEM@MED). This platform was designed specifically for this study. It was used in measuring the spectral signature of high trees or when a certain field of view is required to match the field of view from a remote sensing instrument. The spectroradiometer provides the spectral signature in either one of the two forms: Digital Number (DN) mode and reflectance mode. In the reflectance mode the instrument’s processor divides the measured radiance by the stored reference spectral from a white panel (as described later). Figure 1 shows photographs of the instruments during data collection at different field situations including the case when it has to be mounted on the mobile unit.
The set of measurements for each sample is composed of three parts: 1) the spectral signature from a standard white panel, 2) the signature of the actual ground target from several replications (a replication is a full spectral signature), and 3) another measurement from the white
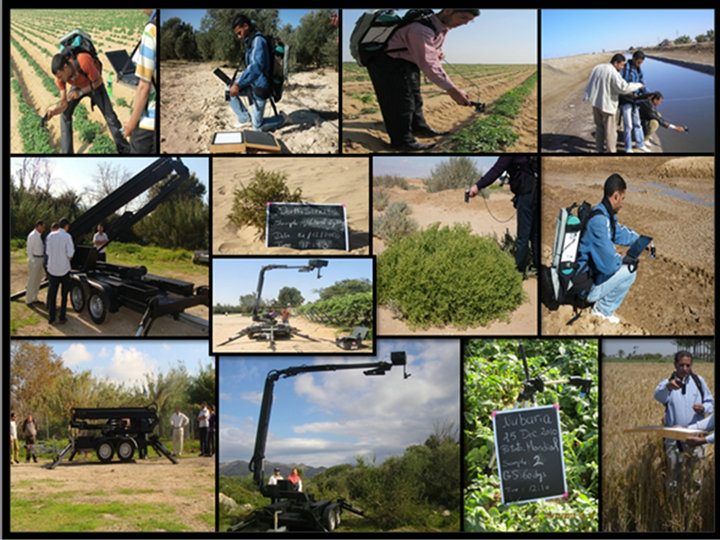
Figure 1. A set of photographs showing different arrangements of measurements for different land cover types, including handheld instruments and instrument mounted on fixed and mobile platforms.
panel. The white panel is provided with the instrument. It reflects all the incident sunlight, so the measured reflected spectrum is actually a measure of the incident light spectrum. The white reference spectrum needed to convert the DN measurement into reflectance (if requested later by the user). The replicates within each sample are measurements of the hyperspectral signature without the reflectance from reference white panel.
Data were collected over a wide variety of land cover in Egypt. This included field crops and different soil types in selected areas within the Nile Delta and the valley between Cairo and Bani-Sueif. Most of the rock samples, on the other hand, were obtained mainly from different point along the coast of the Red Sea, including areas around the city of Safaga. The geographic locations are included in the database. Hyperspectral signatures were also obtained from different water bodies: natural represented by lakes and sea water, and artificial represented by irrigation canals. The lake samples were obtained from the Manzala Lake and the Burullus Lake. The sea water samples were obtained from several points around the Za’farana and Safaga along the Red Sea coast. The samples from the irrigation canals were obtained from the Salam Canal in Tina Plain.
The spectral signature of any given crop (or rock type) was obtained by averaging the spectra obtained from several samples acquired from different locations under a variety of conditions. Field instruments cannot have the quality of a stable laboratory instrument because of temperature drifts and rapidly changing atmospheric absorptions. Averaging data from many samples and replications within each sample will remove any artifacts from field data caused by weather, soil or user’s handling of the instrument. This will make the signature more representative of the surface type and therefore more appropriate for comparison against remote sensing data.
2.3. Generation of the Metadata
The metadata that accompany the spectral signature contain information about the object (i.e. the surface cover) and the sampling environment at the time of data capture. The data are acquired for each sample. They are composed of information on environmental, geographical, surface and instrument’s parameters. Environmental metadata include cloud conditions, ambient temperature, relative humidity, air pressure, and wind speed and direction. These parameters measured by the sensors on an available meteorological station. The stations are established and operated by Central Laboratory for Agriculture Climate (CLAC). In the case when no station is available, the data obtained from climatic sites available on the Internet. Geographical metadata include an accurate geographical location of the sampling measured by a Geographical Positioning System (GPS) attached to the instrument.
The metadata for the surface include information regarding appropriate properties of the surface. For example, in the case of the crops, the information includes planting date, recent irrigation conditions, the brand of the crop (e.g. wheat Sids 1 or 5; wheat Sakha 93, etc.). In the case of the rocks, the information includes chemical descriptions such as Syenogranite (composed of K-fields, orthoclase, Quartz, Biotite, Fe-Oxide and Clay Mineral). Soil analysis is also part of the metadata. Metadata related to sensor’s parameters include information about the viewing angle of the instrument, the illumination source (sun of artificial self-illumination), the lens used in measurements, the mode of the measurements (DN or reflectance) and the measurements setup (e.g. handheld or on a mobile platform).
Availability of the metadata allows better identification of the product hyperspectral signature. It also facilitates comparison between data in different sets upon confirming the similarity of the conditions under which data were acquired. On the other hand, the lack of metadata can render previously collected data useless for different applications.
3. System Architecture
3.1. Data Archiving Structure
Most database systems hierarchically structured because this scheme accommodates different levels of information. The first level is the broadest then it sub-divides into more detailed sub-levels [16]. The method used in the current system is the standard FAO classification scheme for the land cover. The scheme presented in Figure 2. The Dichotomous phase ends with eight classes. These classes are included in the database. The Modular-Hierarchical phase is not part of the fixed structure of the database. The administrator only can add it. It contains optional detailed information about sub-classes that can be acquiring occasionally. An example of a piece of information that can be adding under any one of the eight classes (i.e. below the Dichotomous phase) would be about the irrigation system for the primary vegetated terrestrial cultivated and managed area.
The spectral database designed as a relational database. It takes into consideration implements of hierarchical structure as used for the field data to store species, site, date and spectrum data. Multiple datasets can hold spec-

Figure 2. Hierarchical structures of the main classes according to FAO land cover system.
tral data of different field/laboratory campaigns Figure 3. The top of the figure shows products of the Dichotomous phase. The underlying level shows a few different species within each class of the Dichotomous phase. The next level contains the site, followed by the date. For each date, the dataset consists of a number of samples and for each sample there are a number of replications.
The database was primarily designed to hold spectral data of vegetative studies. Therefore it started with a simple structure that could hold spectral data sorted into sites and species. In the diagram the entities species, site and spectrum reflect the hierarchical structure of spectral data. The sample entity was added to the top of this structure to enable the storage of data belonging to different studies in the same database.
The concepts and necessities of using spectral library data in remote sensing courses on e-learning education and the important of concepts (tools, software, data sampling,…) on the quality on collected data. In addition to, Web techniques can concentrate on the: description of spectral data acquisition, store & organization and Data preprocessing [17].
3.2. Spectral Database Implementation
NARSS spectral database user has two different pages. Admin page that ASD files can be imported into the database as part of a study and allows admin users to manage sites, species, spectrum files and its metadata. Moreover, some of pre-processing functions were developed such as converting the DN data to reflectance data instantly online. Figure 4 shows the developing steps of NARSS spectral database development.
The database implemented in Postgres, GNU open source software. Postgres is a relational database management system that can handle large amounts of data. The system designed to work with any relational database system as shown in Figure 5. A web application developed to simplify data loading archiving and analyzing spectral data.
The technical requirements for such a system were (Graphical user interface to the database—Functions for loading spectral data into the database—Data pre-processing functions—Data analysis functions—File export functions to allow data analysis and plotting in 3rd party packages). The application developed using the latest in java and web 2.0 technologies using spring framework. Hibernate framework was used for the database access from java code. JQuery javascript framwork used at the client to get and show spectral data and graphs.
4. Sample Results
The database structure results showed that the species, classes, types of natural and artificial different land cover types are well archived spectral data. The Archiving of the spectrum were mainly based on the FAO classification system shown in Figure 6. The organized structure
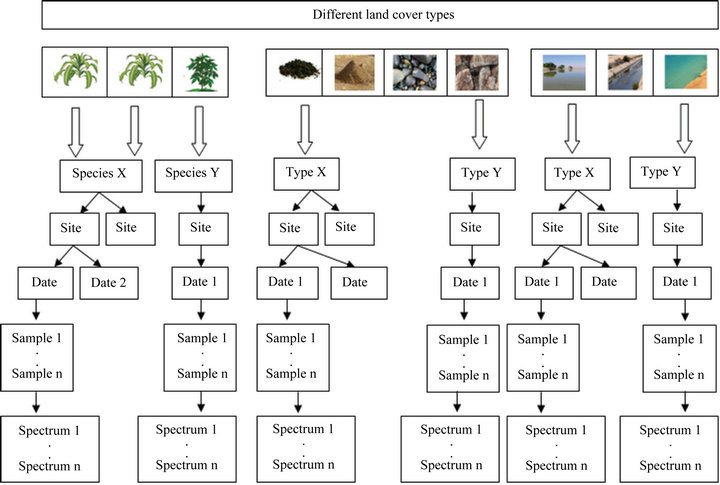
Figure 3. Hierarchical structures of the archived spectral data in the database.
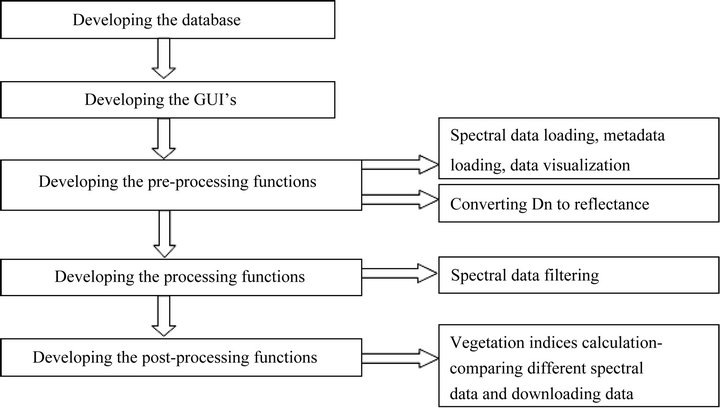
Figure 4. Steps of NARSS spectral database development.
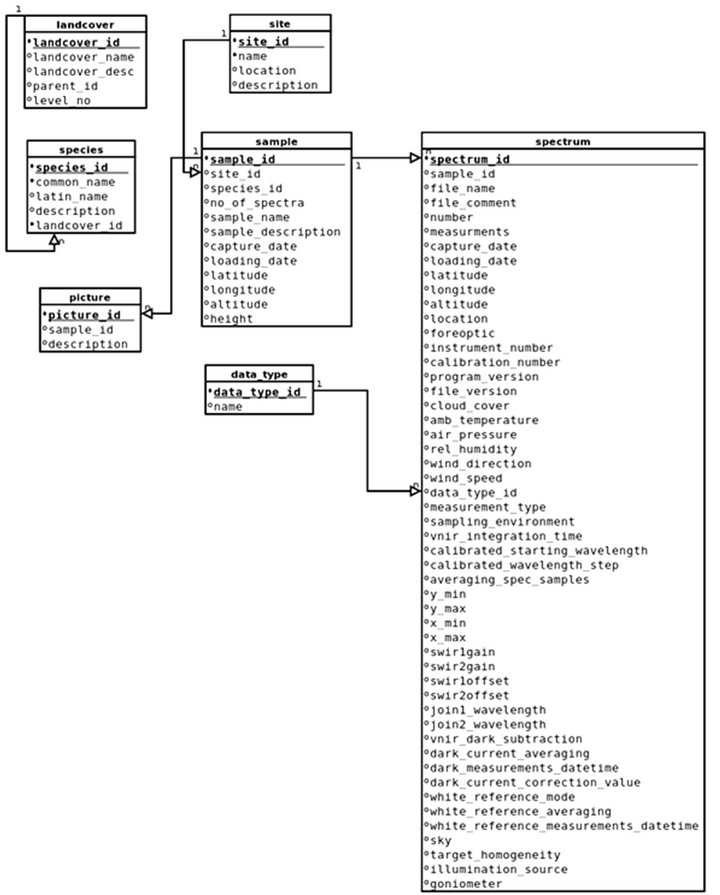
Figure 5. Overview of the spectral database model shows entities and relations.
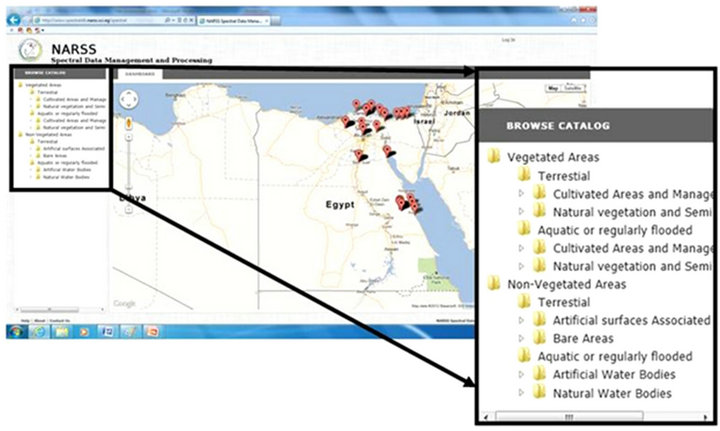
Figure 6. The non-admin user main page of NARSS spectral data management and processing.
of the database led to better planned sampling campaigns for spectral data collection. In addition, well-ordered data makes the data handling, pre-processing and processing much easy.
The spectral data archived as raw data in the database, both of admin and non admin users can demonstrate and visualize the data either as raw data or pre-processing by converting the DN measurement data to reflectance at http://www.spectraldb.narss.sci.eg/spectral. That gives ability for comparing between the different targets and makes the different targets signatures comparison much easily shown in Figures 7- 9.
5. Conclusions
The high performance and flexibility of the NARSS spectral database of spectral data and metadata retrieving indicates well-defined relations without conflicts between the database attributes. The spatial location of every spectral sample is overlaid on Google maps which are connected to the first non-admin users page that clarify exactly spatial distribution of the collected spectral measurements.
Sustainability of using the archived spectral data on the long term for scientific and research purposes in addition to data distribution is return to NARSS spectral database well-organized storage system of the spectroscopy measurements and its metadata. The developed database provides multi admin users to upload, remove, modify and pre-process spectral datasets and non-admin users demonstrate pre-process the spectral files. In addition, all subsequent operations can be carried out on the original dataset that remains unchanged. Moreover, acquired spectral data in DN can be faster and easily converted to reflectance data.
It is recommended that future developing NARSS spectral database should be of a modular nature to accommodate more variations of data processing steps.
6. Acknowledgments
We express our deepest thanks and appreciation to
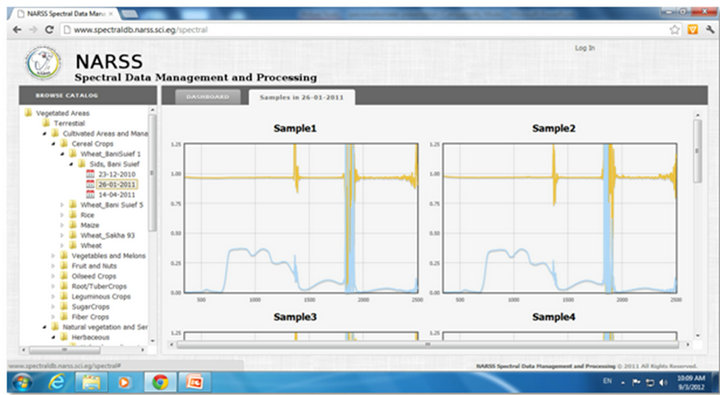
Figure 7. Sample of reflectance spectral signatures visualization.
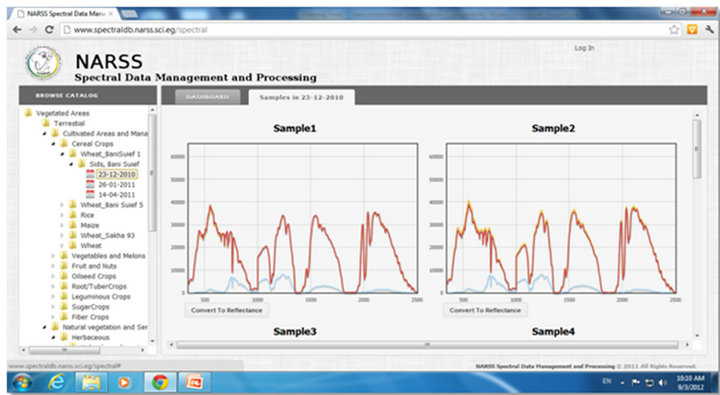
Figure 8. Sample of DN spectral signatures visualization.
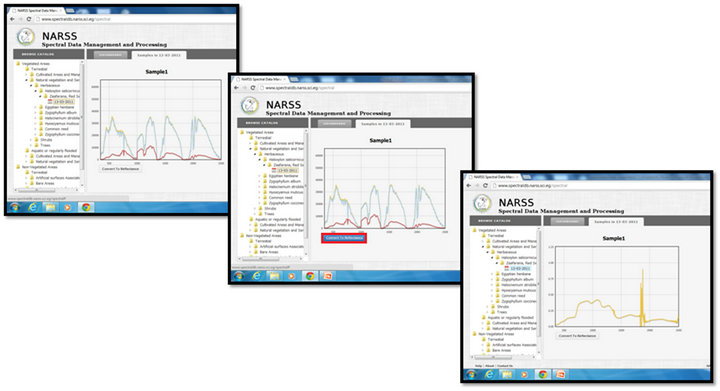
Figure 9. The online data conversion from DN to reflectance.
GI@MED project financed by the Hellenic Aid (Greek international development services) for supporting NARSS with the ASD spectroradiometer and using GI@MED lab facilities at NARSS premises to carry out this work.
REFERENCES
- N. E. M. Nasarudin and H. Z. M. Shafri, “Development and Utilization of Urban Spectral Library for Remote Sensing of Urban Environment,” Journal of Urban and Environmental Engineering, Vol. 5, No. 1, 2011, pp. 44- 56.
- L. Zhang, C. Huang, T. Wu, F. Zhang and Q. Tong, “Laboratory Calibration of a Field Imaging Spectrometer System,” Sensors, Vol. 11, No. 3, 2011, pp. 2408-2425. doi:10.3390/s110302408
- A. A. Darvishsefat, M. Abbasi and M. E. Schaepman, “Evaluation of Spectral Reflectance of Seven Iranian Rice Varieties Canopies,” Journal of Agricultural Science and Technology, Vol. 13, 2011, pp. 1091-1104.
- E. Adam, O. Mutanga and D. Rugege, “Multispectral and Hyperspectral Remote Sensing for Identification and Mapping of Wetland Vegetation: A Review,” Wetlands Ecology and Management, Vol. 18, No. 3, 2010, pp. 281-296. doi:10.1007/s11273-009-9169-z
- E. M. Abdel-Rahman and F. B. Ahmed, “The Application of Remote Sensing Techniques to Sugarcane (Saccharum spp. Hybrid) Production: A Review of the Literature,” International Journal of Remote Sensing, Vol. 29, No. 13, 2008, pp. 3753-3767. doi:10.1080/01431160701874603
- A. I. de Castro, M. Jurado-Exposito, M. Gomez-Casero, and F. Lopez-Granados, “Applying Neural Networks to Hyperspectral and Multispectral Field Data for Discrimination of Cruciferous Weeds in Winter Crops,” The Scientific World Journal, Vol. 2012, 2012, pp. 1-11. doi:10.1100/2012/630390
- S. S. Ray, J. P. Singh and S. Panigrahy, “Use of Hyperspectral Remote Sensing Data for Crop Stress Detection: Ground-Based Studies,” International Archives of the Photogrammetry, Remote Sensing and Spatial Information Science, Vol. 38, No. 8, 2010, pp. 562-567.
- C. P. Ferri, A. R. Formaggio and M. A. Schiavinato, “Narrow Band Spectral Indexes for Chlorophyll Determination in Soybean Canopies [Glycine Max (L.) Merril],” Brazilian Journal of Plant Physiology, Vol. 16, No. 3, 2004, pp. 131-136.
- Y. Cheng, E. Tom and S. L. Ustin, “Mapping an Invasive Species, Kudzu (Puerariamontana), Using Hyperspectral Imagery in Western Georgia,” Journal of Applied Remote Sensing, SPIE, Vol. 1, No. 1, 2007, Article ID: 013514. doi:10.1117/1.2749266
- S. Stagakis, V. Gonzalez-Dugo, P. Cid, M. L. GuillenCliment and P. J. Zarco-Tejada, “Monitoring Water Stress and Fruit Quality in an Orange Orchard under Regulated Deficit Irrigation Using Narrow-Band Structural and Physiological Remote Sensing,” Journal of Photogrammetry and Remote Sensing, Vol. 71, 2012, pp. 47-61. doi:10.1016/j.isprsjprs.2012.05.003
- T. H. Kurz, S. J. Buckley and J. A. Howell, “Close Range Hyperspectral Imaging Integrated with Terrestrial LIDAR Scanning Applied to Rock Characterization at Centimeter Scale,” International Archives of the Photogrammetry, Remote Sensing and Spatial Information Sciences, Vol. 39, No. 5, 2012, pp. 417-422.
- A. Hueni and M. Tuohy, “Spectroradiometer Data Structuring,” Pre-Processing and Analysis—An IT Based Approach, Spatial Science, Vol. 52, No. 2, 2006, pp. 93-102. doi:10.1080/14498596.2006.9635084
- A. Hueni, J. Nieke, J. Schopfer, M. Kneubuhler and K. I. Itten, “The Spectral Database Specchio for Improved LongTerm Usability and Data Sharing,” Computers & Geosciences, Vol. 35, No. 3, 2009, pp. 557-565. doi:10.1016/j.cageo.2008.03.015
- S. Bojinski, M. Schaepman, D. Schlapfer and K. Itten, “SPECCHIO: A Spectrum Database for Remote Sensing Applications,” Computers & Geosciences, Vol. 29, No. 1, 2003, pp. 27-38. doi:10.1016/S0098-3004(02)00107-3
- K. Pfitzner, A. Bollhöfer and G. Carr, “A Standard Design for Collecting Vegetation Reference Spectra: Implementation and Implications for Data Sharing,” Spatial Science, Vol. 52, No. 2, 2006, pp. 79-92. doi:10.1080/14498596.2006.9635083
- A. Di Gregorio, “Land Cover Classification System (LCCS), Version 2: Classification Concepts and User Manual,” Food and Agriculture Organization of the United Nations, Rome, 2005.
- M. Abbasi, A. A. Darvishsefat, M. E. Schaepman and M. Abbasi, “E-Learning Support for Hyperspectral Remote Sensing Lectures with Emphasis on Spectral Library Database,” International Society for Photogrammetry and Remote Sensing (ISPRS), Vol. 38, No. 6, 2011, pp. 129- 131.