American Journal of Plant Sciences
Vol. 4 No. 12C (2013) , Article ID: 41040 , 13 pages DOI:10.4236/ajps.2013.412A3007
Physio-Biochemical and Microsatellite Based Profiling of Lowland Rice (Oryza sativa L.) Landraces for Osmotic Stress Tolerance
![]()
1Department of Biotechnology, Visva-Bharati University, Santiniketan, India; 2Department of Botany, Universty of Kalyani, Kalyani, India.
Email: rajibroychowdhurybu@gmail.com, joydipkarmakar@gmail.com, mkadak09@gmail.com, *narottam.dey@visva-bharati.ac.in
Copyright © 2013 Rajib Roychowdhury et al. This is an open access article distributed under the Creative Commons Attribution License, which permits unrestricted use, distribution, and reproduction in any medium, provided the original work is properly cited.
Received October 26th, 2013; revised November 25th, 2013; accepted December 6th, 2013
Keywords: Drought; Genetic Diversity; Salinity; Simple Sequence Repeat; Traditional Rice
ABSTRACT
Global climate changes accelerate a wide range of abiotic stresses leading to a series of physiological, biochemical and molecular changes that adversely affect the growth and productivity of rice (Oryza sativa L.). In this background, there is limited knowledge and profiling reports of lowland, less popular rice landraces in relation to their osmotic stress tolerance. Laboratory mediated physiological and biochemical screening for a selected set of 20 lowland rice landraces was done in induced drought and salinity stress conditions. Varietal genetic diversity and inter-relatedness were assessed by using osmotic stress tolerance linked forty-five rice microsatellite markers. For representing the allelic diversity of the studied microsatellite loci across the selected genotypes, a microsatellite panel was constructed and PIC values of all used microsatellite markers were calculated. The obtained database can be used for varietal identification, characterization and genetic information in relation to osmotic stress tolerance.
1. Introduction
Rice (Oryza sativa L.) is the principal staple food as over 50% of the world’s population depends on it for about 80% of their food requirements [1]. Rice is grown under diverse ecological conditions (irrigated, lowland, upland, coastal, drought and flood prone areas) in tropical Asian countries such as India. Global climate change accelerates a series of abiotic stresses, especially drought and salinity (osmotic stress), which impose serious threats for rice production worldwide [2]. By the end of the 1980 (post Green-revolution time), conventional breeding mediated rice yield’s potential was increased in different experimental trials [3]. During this agricultural modernization era, a large number of rice landraces have been lost due to the invasion of high-yielding rice varieties [3]. Although less productive, these landraces have been reported to be highly tolerant to a number of biotic and abiotic stresses [4,5] and harbour a good number of other quality traits [6,7]. Unlike high-yielding varieties (whose variability is limited due to homozygosis), the rice landraces are endowed with tremendous genetic variability, as they are not subjected to subtle selection over a long period of time [8,9]. For proper utilization and incorporation of these indigenous rice lines from the natural crop resources, identification of the allelic variant that results in plant phenotype is the utmost important. Conservation of these genetic resources is, therefore, much more useful since such lines have diverse gene pool providing the potentiality to withstand in varied environmental fluctuations. Their wide phenotypic and genotypic responses can also be considered for their varietal characterization and proper identification [10]. In this context, molecular evaluation in form of genetic diversity for available landraces has become important in modern-day crop improvement [11,12]. Such rice genetic resources were being used for incorporating genetic variability into rice breeding programs to generate new cultivars with broadened genetic bases [3] and allow new useful allelic combinations [13,14]. Genetic profiling among the diverse rice lines presently grown in West Bengal (a state of India) has been assessed by a number of workers [15-19] using various molecular marker systems. Microsatellites, also known as simple sequence repeats (SSRs), a recent and popular marker system, are abundant and well distributed throughout the rice genome [20-22], being used in rice for genomic diversity analysis [23-25]. Several traits linked rice SSR markers have been established for drought [26,27], salinity [28,29] and submergence [30,31] tolerance. Besides the molecular characterization at DNA level, physiological performances under induced osmotic stresses and quantity of bioactive compounds (proline, chlorophyll, total protein, salicylic acid, catalase, peroxidase etc.), having a significant role in adaptation to altered environmental stress conditions, are also necessary for the proper characterization of rice lines in relation to stress tolerance.
In spite of erosion of a number of rice landraces, West Bengal is still today a rich source of indigenous rice lines having the hidden genetic potential that needs to be explored [16]. There were no previous reports on the studied rice landraces for their osmotic stress tolerance properties. Keeping this as an objective of the present research, a total number of 20 lowland indigenous less popular lines’ suffixes with “Sail” were genotyped for the first time with 45 osmotic stress tolerance linked reported SSRs in addition to physiological and biochemical screening to make a systematic and multi-informative profile of selected varieties in relation to osmotic stress tolerance.
2. Materials and Methods
2.1. Plant Materials
A total of 20 indigenous, lowland, less popular West Bengal rice landraces suffix with “Sail” were selected for this investigation. The detailed description of these landraces is given in Table 1.
2.2. Physiological Screening
For physiological screening, drought stress was induced by varying concentrations (−0.5, −1.0 and −1.5 MPa) of
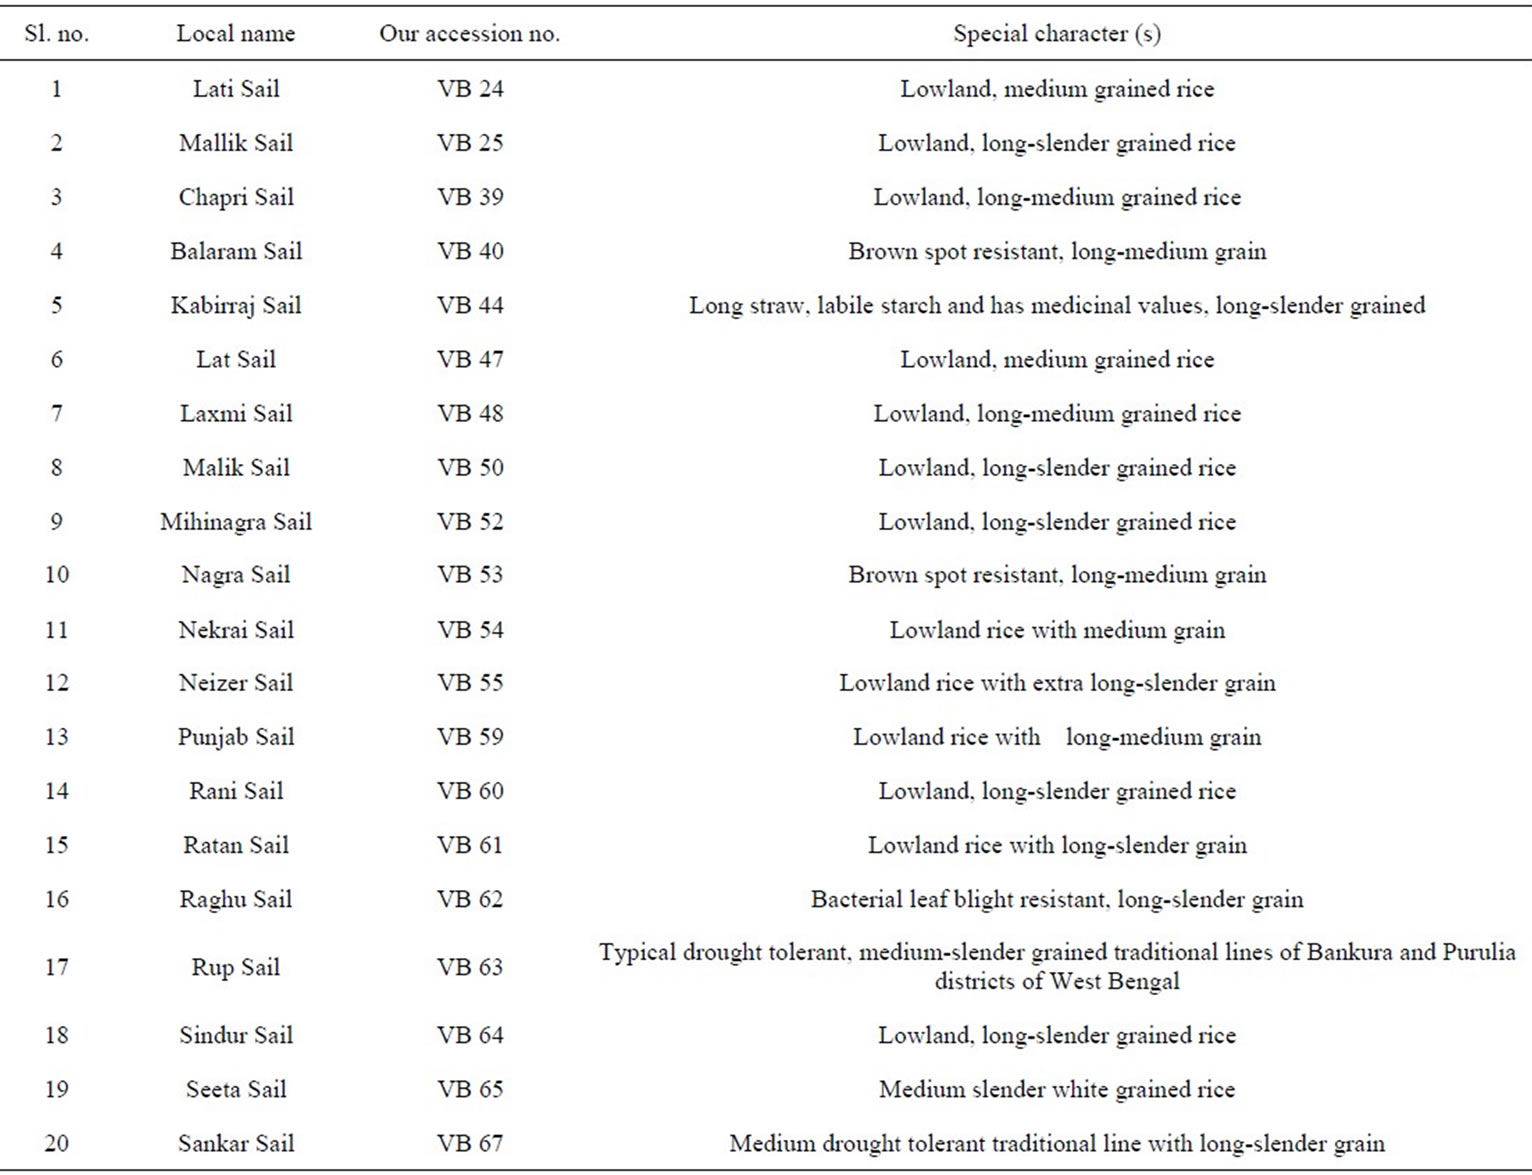
Table 1. Details of the studied rice landraces.
Polyethylene Glycol 6000 (PEG) [32] and salinity was induced by three different concentrations (100, 200 and 300 mM) of sodium chloride (NaCl) solution [33]. Stresses were imposed during seed germination and seedling growth for the studied landraces after the mercuric chloride mediated surface sterilization. Germination percentage (G%) and seedling growth (in form of shoot and root length) were monitored and recorded on 15th day after seed sowing. Grains were considered germinated when both the plumule and radical had extended to more than 2 mm [34].
2.3. Biochemical Profiling
Estimation of some selected bioactive compounds commonly varying with different degree of osmotic stresses was quantified. Surface sterilized rice grains were allowed to germination and growth in a plastic pot contained artificial soil and set for 20 days at 28˚C ± 2˚C with 9 h photoperiod. Then the plantlets were transferred to culture tubes for treatment with 20 ml solutions of different PEG and NaCl concentrations (as used in physiological screening) and set for 24 h. Then, proline, chlorophyll and total protein contents were quantified from the fresh leaf tissues using standard protocols [35- 37].
2.4. Statistical Analysis
For different physio-biochemical parameters the estimated values were analyzed statistically. Mean values of studied traits (germination percentage, root and shoot length); proline, total chlorophyll and total protein contents were subjected to analysis of variance (ANOVA) using Microsoft Excel version 10.0 as per the method of Panse and Sukhatme [38] to test the significance at 5% level of probability (P < 0.05) for each character which employed to obtain, assemble, classify and to interpret voluminous quantitative data.
2.5. Genomic DNA Isolation, PCR Amplification and SSR Genotyping
Leaf and other aerial plant tissues from five days old germinating seedlings were used for isolation of rice genomic DNA following a prestandarized protocol [39] of our laboratory. The isolated genomic DNA samples were adjusted to 25 ng/μl concentration. Based on available published reports [18,40-42], forty five osmotic stress tolerance linked SSR markers were selected. The detailed information of the selected SSR markers was obtained from the Gramene database (www.gramene.org). PCR amplification, polymorphism screening and analysis of the amplified products were done [18]. Individual alleles (in the form of different mol. wt. of the amplified product from a single loci) of all SSR markers were scored to prepare a binary matrix based on the presence (1) or absence (0) of a particular allele. A pair-wise genetic similarity coefficient matrix between all possible pairs of the studied genotypes were calculated from such 1/0 matrix using SPSS (version 10.0) and a dendrogram was constructed based on Ward’s method using complete linkage between groups and Euclidean distance using STATISTICA software. Polymorphism information content (PIC value) of each SSR was also determined following a simplified formula:
 where i = 1 to n, Pij represents the frequency of jth allele for the ith band scored for a particular marker [43].
3. Results
3.1. Physiological Screening
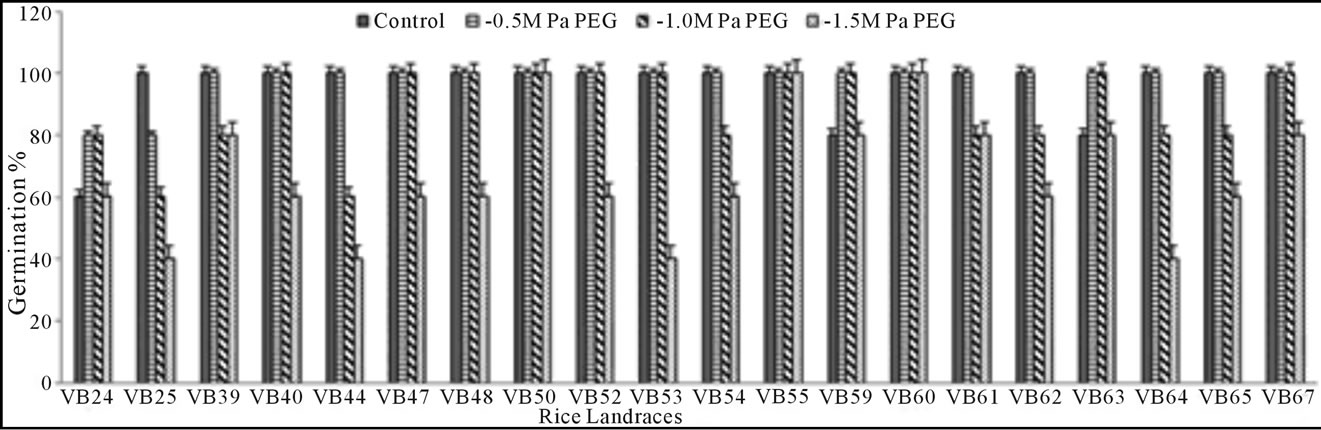
Germination percentage: Seed G% of the studied rice landraces on 15th day was significantly low at the highest concentrations of both PEG (−1.5 MPa) and NaCl (300 mM). With increasing doses of stressors (PEG and NaCl), G% gradually decreased when compared with the control set (Figures 1(a) and (b)). The significant exception found for three genotypes (Lati Sail, Punjab Sail and Rup Sail) showing higher G% than the control for lower doses. Although, both PEG and NaCl inhibit seed germination, PEG showed more inhibitory effects than that of NaCl. Malik Sail, Neizer Sail and Rani Sail showed highest germination (100%) in all osmotic stress conditions. Chapri Sail, Punjab Sail, Rup Sail and Sankar Sail showed 100% germination in all NaCl doses, but not in PEG. Days to seed germination was also delayed with the increasing concentration of stressors.
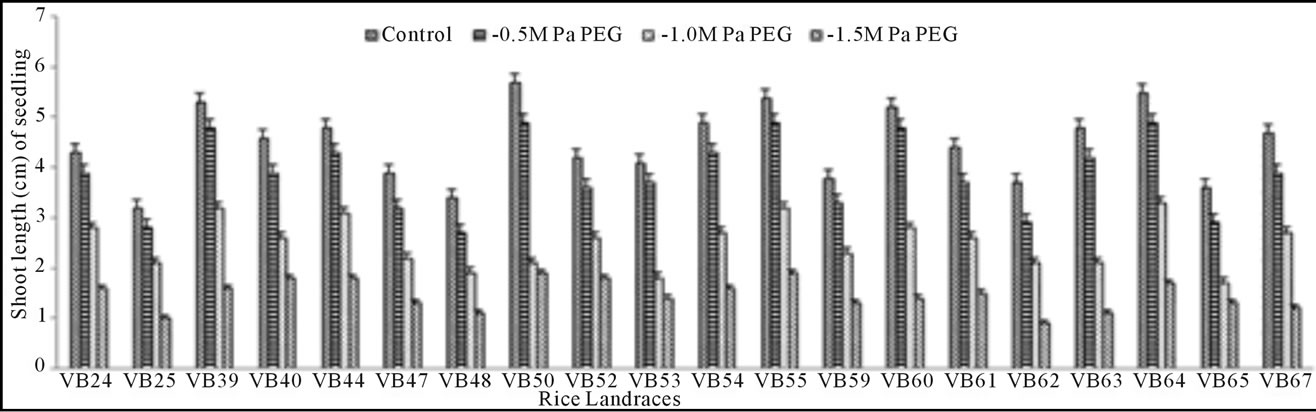
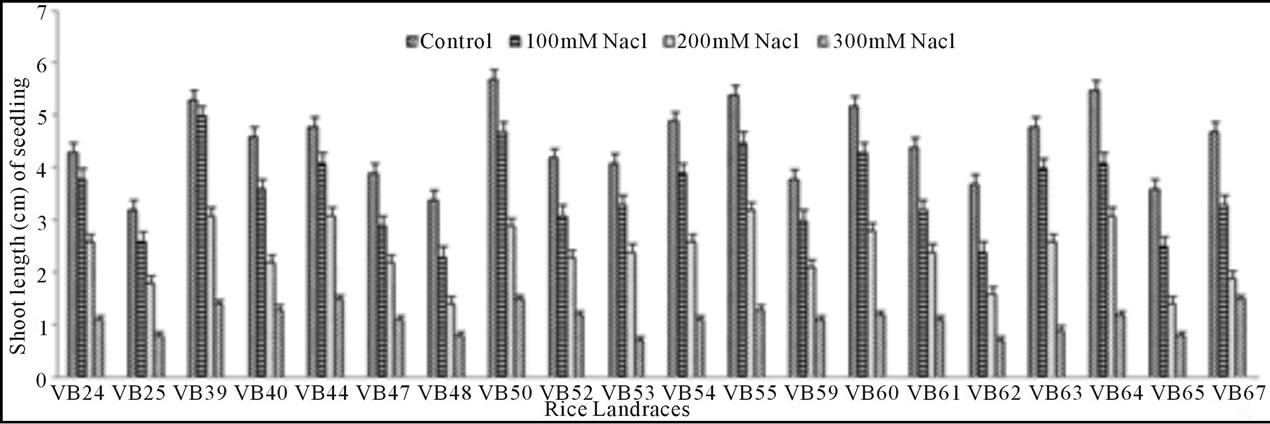
Growth pattern: The phenotypic responses in form of shoot and root length in induced osmotic stresses (by PEG and NaCl treatment) were varied greatly. Shoot length in control was maximum (5.7 cm) in Malik Sail, whereas the minimum (3.2 cm) was obtained for Mallik Sail. Overall shoot growth in three different doses of PEG were more than the values found in three different NaCl concentrations as presented in Figures 2(a) and 3(a), respectively. Shoot length in all concentrations of PEG and NaCl were lower than the control ones. In Figures 2(b) and 3(b), it has been shown that root length was lower in both Mallik Sail and Laxmi Sail (4.5 cm) and highest in Chapri Sail (7.1 cm). Compared to the control, lower concentration of PEG (−0.5 MPa) and NaCl (100 mM) increased the root length. The subsequent higher doses of stressors inhibit the root growth. This reduction in root length was higher in PEG rather than in NaCl doses.
 (a)
(a)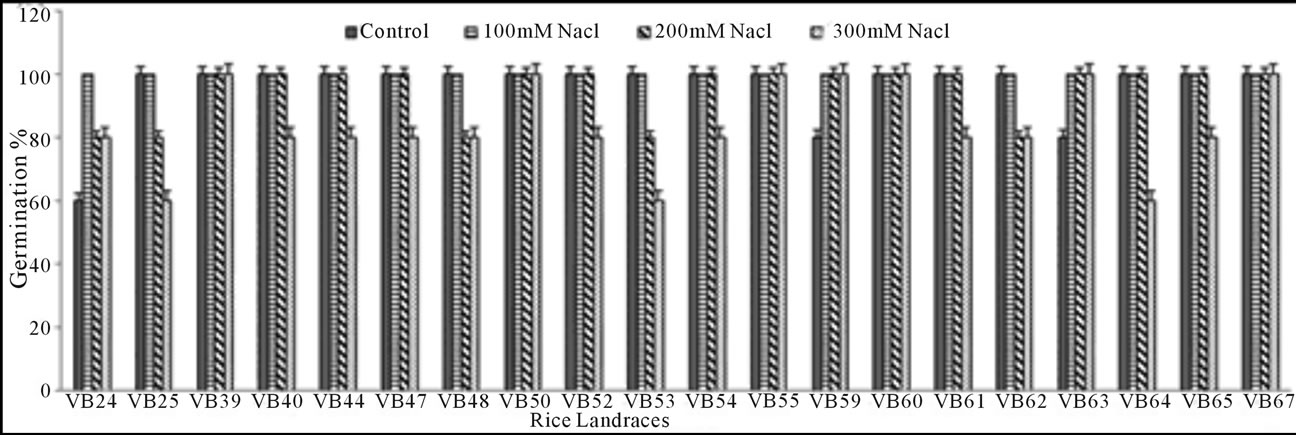 (b)
(b)
Figure 1. Graphical representation of rice seed germination percentage of 20 studied landraces in drought (a) and salinity (b) stress conditions induced by polyethylene glycol (PEG) and sodium chloride (NaCl), respectively.
 (a)
(a)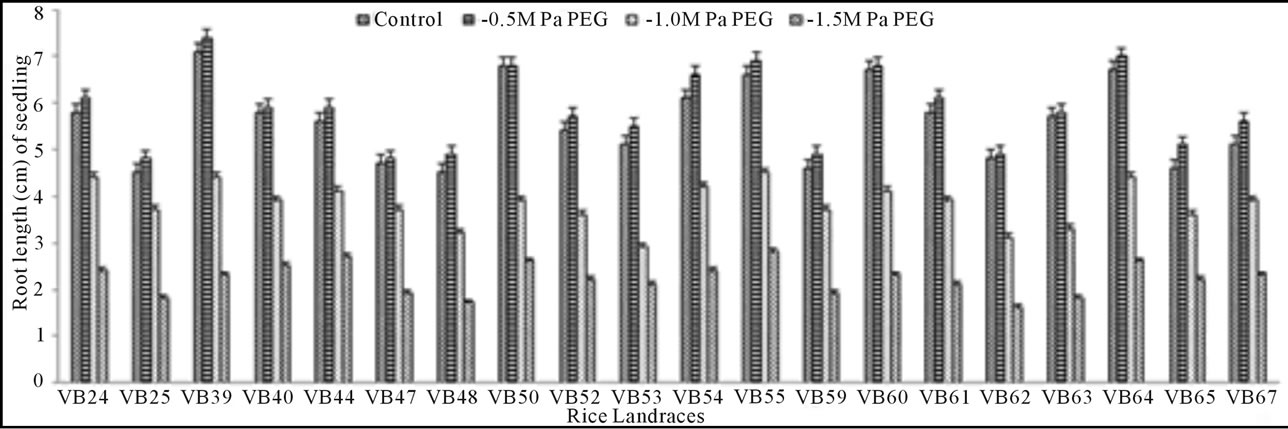 (b)
(b)
Figure 2. Graphical representation showing shoot (a) and root (b) length of 15 days old germinating rice seedlings grown in different concentrations (−0.5, −1.0 and −1.5 MPa) of polyethylene glycol (PEG).
 (a)
(a)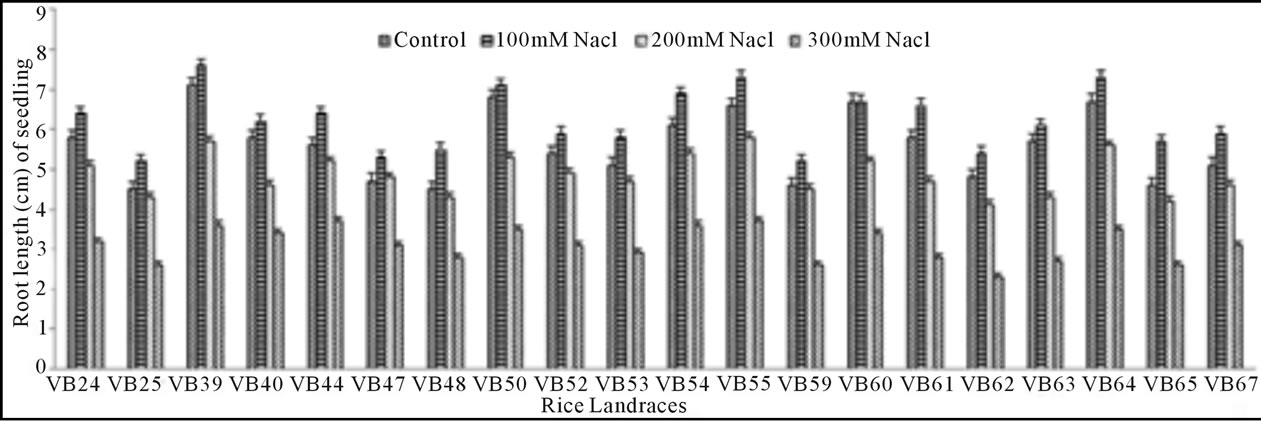 (b)
(b)
Figure 3. Effect of different NaCl concentrations (100, 200 and 300 mM) on shoot (a) and root (b) length of 15 days old germinating rice seedlings.
3.2. Biochemical Profiling for Proline, Chlorophyll and Protein Content
Chlorophyll (mg), proline (µg) and total protein (mg) content per g of mature normal leaf tissue, in control and all stress conditions, showed a considerable variation for studied twenty rice landraces (Table 2). Among the all rice cultivars, Sankar Sail showed the highest and Nekrai Sail showed the lowest quantity of chlorophyll in all the concentrations of PEG and NaCl. Protein content in the lower osmotic stresses, i.e. −0.5 MPa PEG and 100 mM NaCl, reveal that Laxmi Sail has gave the highest values (95.2 and 109, respectively) and Chapri Sail has gave the lowest values (56.7 and 58.2, respectively).
3.3. Analysis of Variance (ANOVA)
The analysis of variance revealed highly significant (p < 0.05) differences among the physio-biochemical responses (Table 3) in different osmotic stress conditions (in both PEG and NaCl).
3.4. SSR Based Molecular Characterization
Fingerprinting results reveal that 38 SSR primers, out of total 45, are polymorphic and the rest seven (RM 8094, RM 10745, RM 315, RM 162, RM 10927, RM 3231 and RM 296) are monomorphic. Polymorphism has been identified from 38 primer pairs and that is shown in Table 4. A total of 122 alleles were detected, of which 12 were found to be rare. The number of alleles per locus ranged from 2 to 5, with an average of 3.21 alleles across the 45 loci. Based on the revealed allelic size differences, microsatellite panel (Figure 4) represents the SSR based whole amplicon variability amongst the studied landraces. A total of 12 rare alleles (present only in a single genotype) were identified. The lowest amplicon size belonged to OSR 2 (57 - 66 bp) and the highest amplicon size belonged to RM 10772 (427 - 512 bp). The large size of the monomorphic amplicon size was highest (173 bp) for RM 10745 and lowest (105 bp) for RM 162. Highest allelic frequency (90%) were revealed by both RM 212 (111 bp) and RM 219 (165 bp) and lowest allelic frequency (35%) were observed for RM 3412 (200 bp), RM 206 (139 bp and 167 bp), RM 328 (270 bp), RM 215 (148 bp) and RM 257 (137 bp). It was noted that out of 5 alleles of RM 206, two alleles (139, 167 bp) having the same (35%) frequency. Similar results was found for RM 8115, RM 10890 and RM 107; where the former two loci showed 2 alleles with same frequency (50%) and the later (RM 107) showed alleles with same frequency (40%).
Polymorphism information content or PIC values for 38 polymorphic primers varied from 0.180 (for RM 212
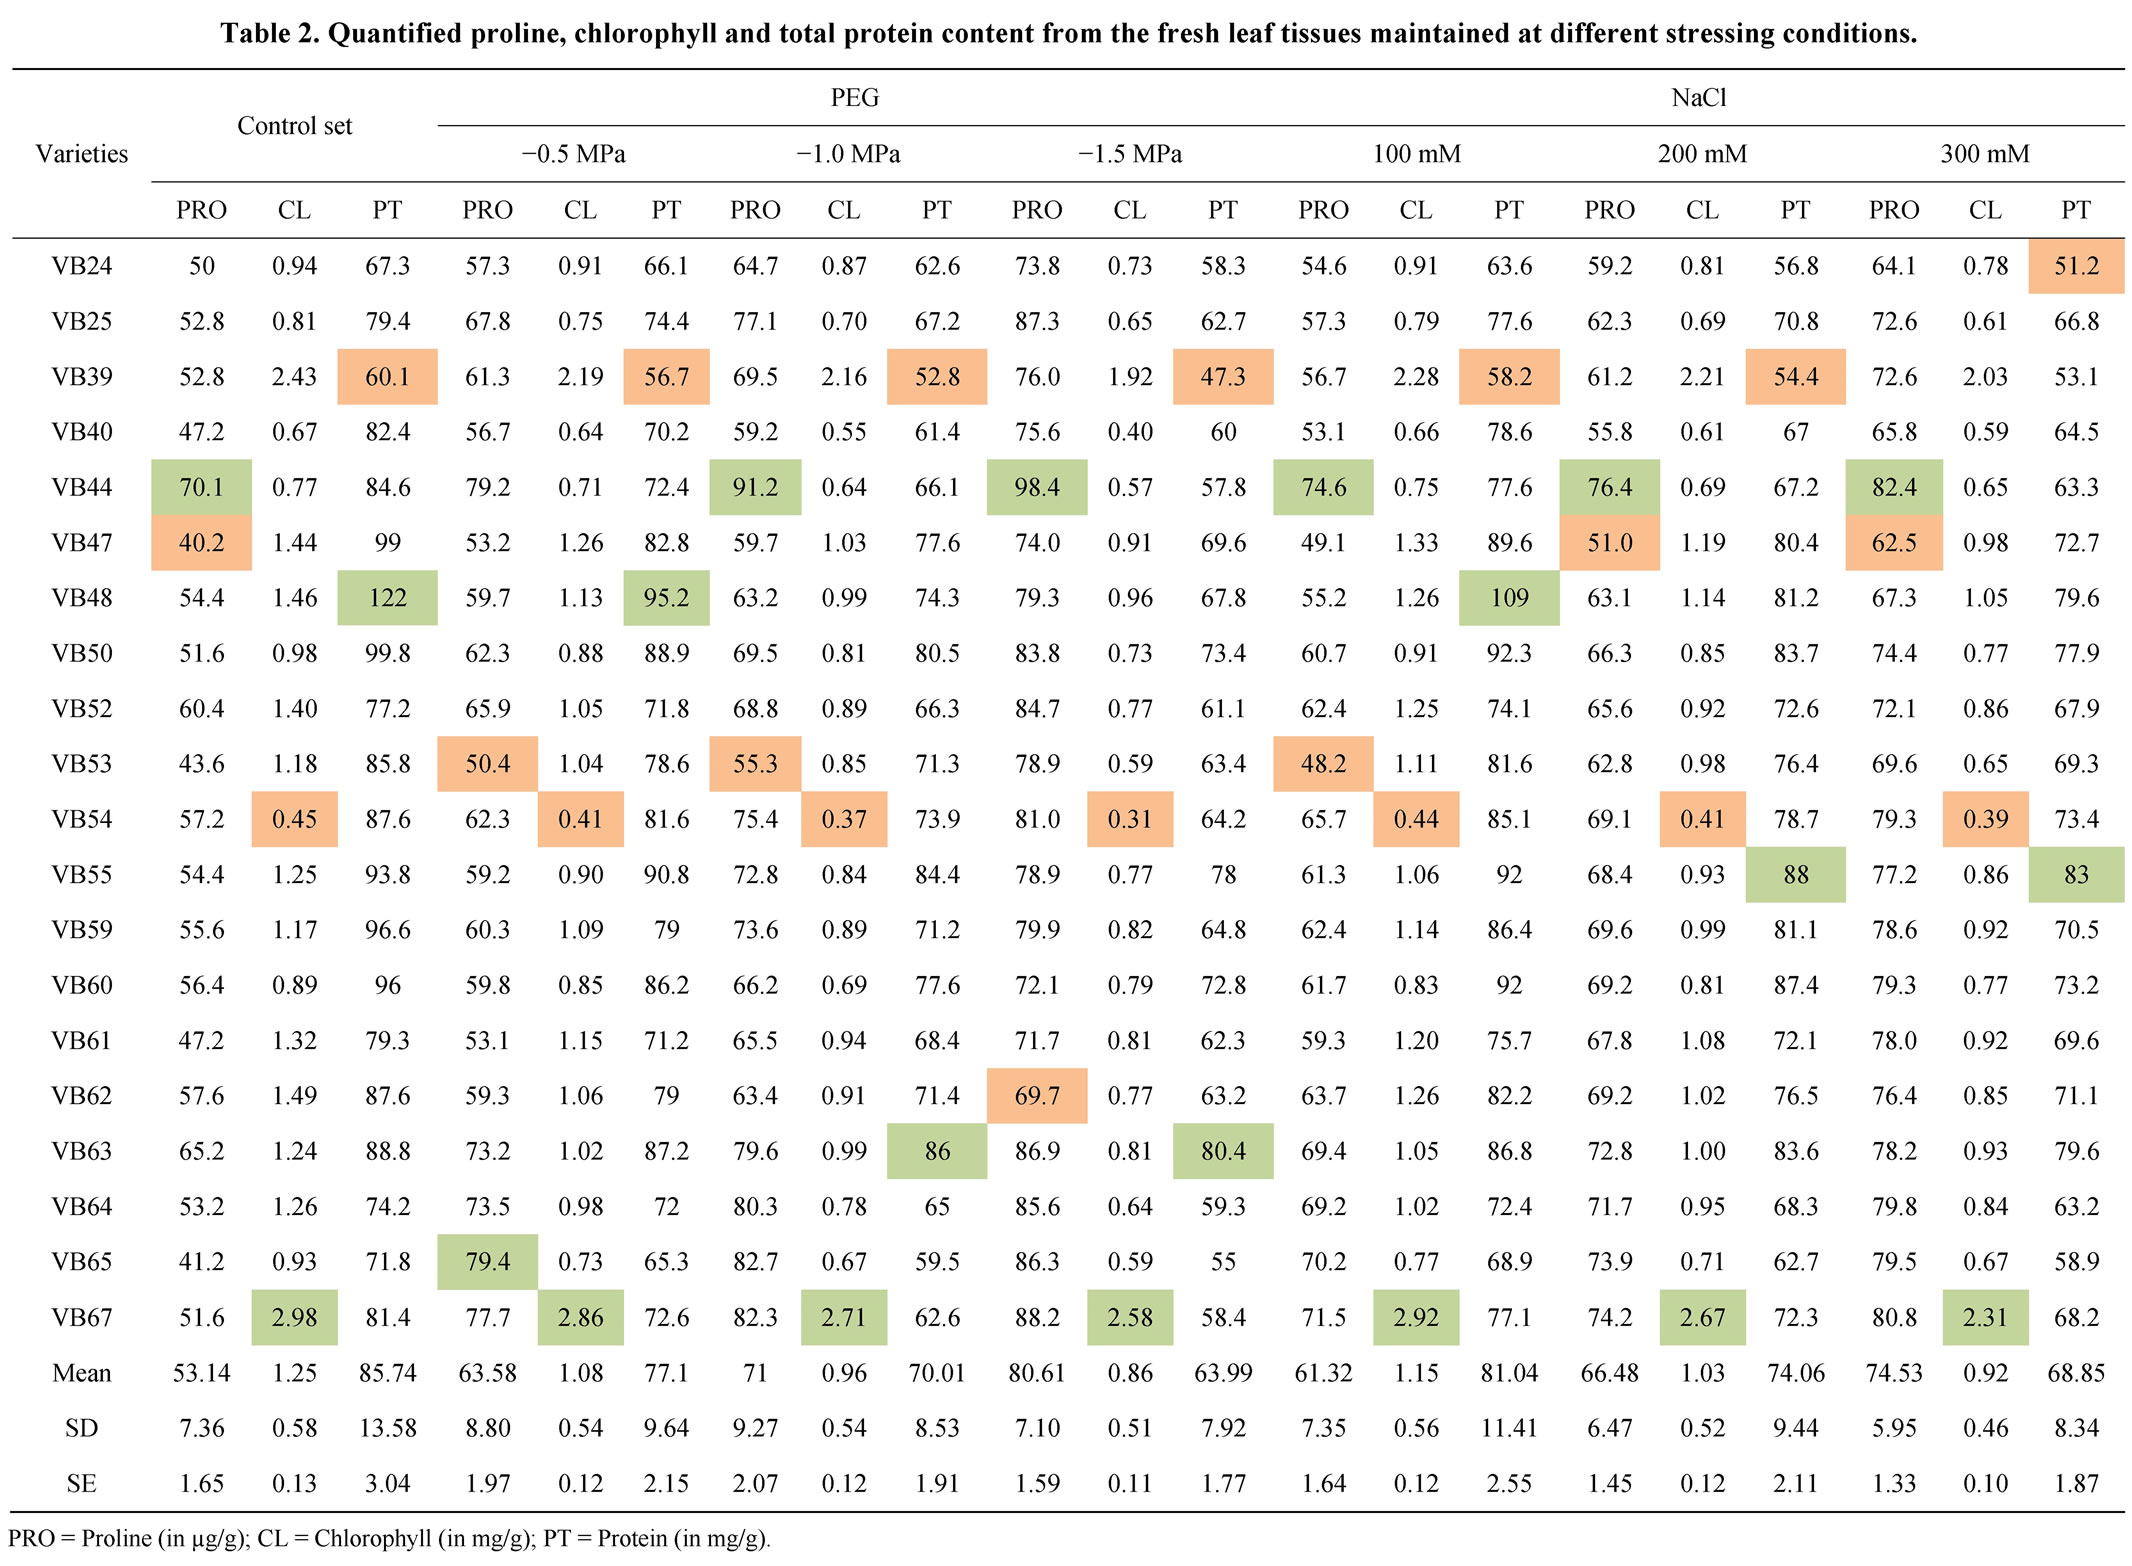
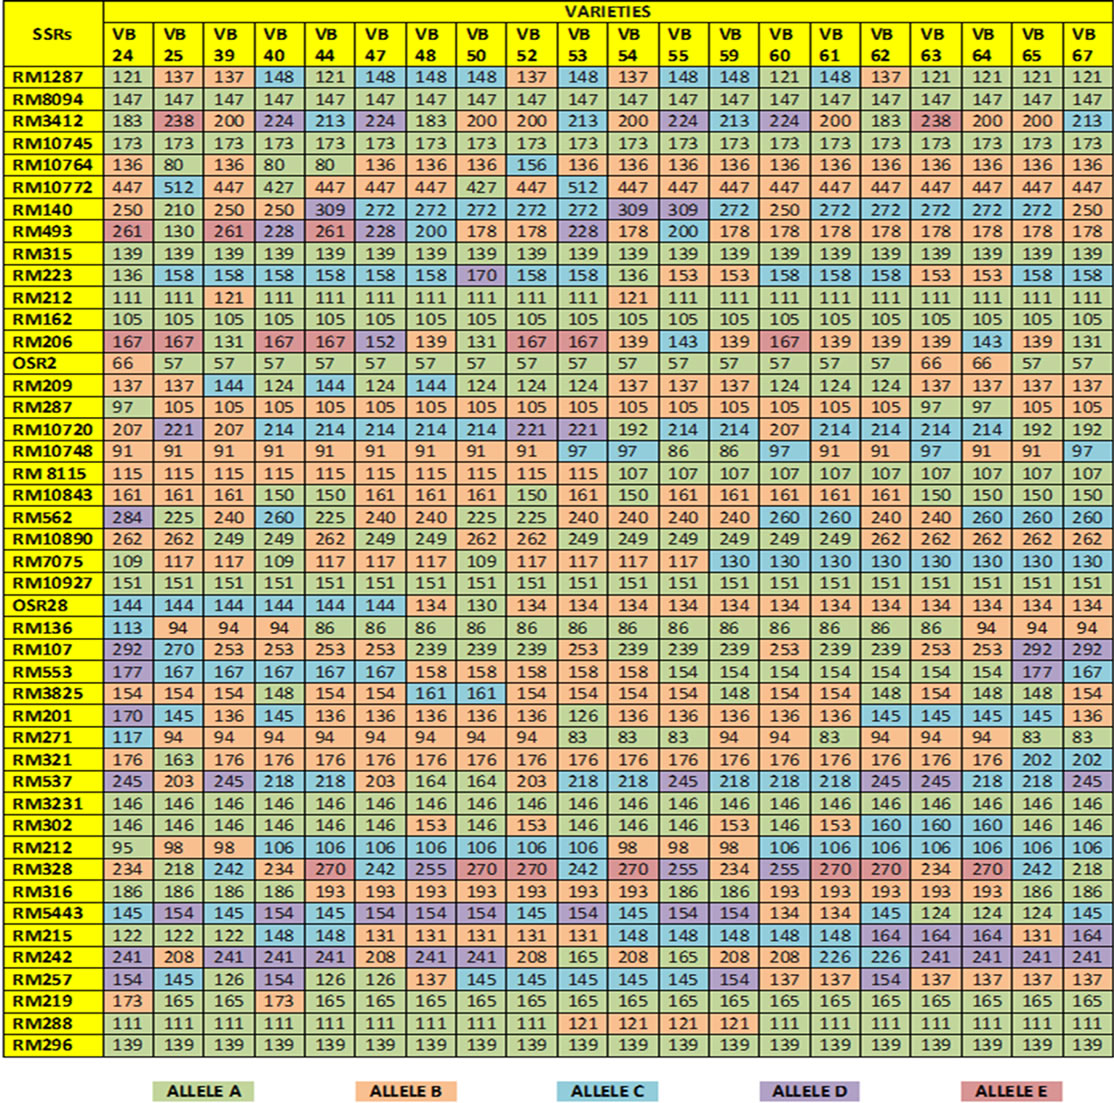
Figure 4. Microsatellite panel of studied rice landraces against used 45 SSRs.
and RM 219) to 0.765 (for RM 3412 and RM 328) with an average PIC value of 0.524. As overall observation, the SSR loci RM 3412 followed by RM 328, RM 206 and RM 493, were found to be superior for analysis of allelic diversity in this study. Similarity matrix revealed that the similarity coefficient value ranged from 0.0 (between Balaram Sail-Nekrai Sail and Rup Sail-Sindur Sail) to 0.98 (between Lati Sail and Nagra Sail). The dendrogram (Figure 5) showed four major clusters: Cluster I, II, III and IV. Within the first cluster, Chapri Sail and Kabirraj Sail are very much close to each other; whereas in second cluster, Rup Sail and Sindur Sail are closely related. In Cluster-III and IV, the pairs of Rani SailRatan Sail and Neizer Sail-Punjab Sail are closely linked, respectively.
4. Discussion
Analysis of variance (ANOVA) indicates the presence of considerable amount of variability amongst the different studied cultivars for all studied physio-biochemical parameters. Reduction in seed G% was higher in PEG compared to NaCl indicates that at equivalent osmotic potential, seed germination was better in NaCl than the PEG as reported by Gulzar and Khan [44]. The explanation of the higher inhibitory effects of PEG than NaCl lies in ion or solute entry into the seed [45].
It was clear from the above results that increased concentration of both PEG and NaCl reduce seedling growth. Such type of stress tolerance is characterized by an extensive root growth and small reduction of shoot growth in stressed conditions [46]. Pradhan et al. [47] reported that root length and rootlet number were increased due to severe moisture stress.
Castillo et al. [48] and Cha-um et al. [49] have been reported that the quantity of different biochemical components like protein, chlorophyll, proline, etc. in mature rice tissues were changed under drought and/or salinity stress conditions. Chlorophyll pigment also tends to decline rapidly under osmotic stresses [50]. Presence of high proline content is a good index for osmotic stress tolerance and under stressed condition, the cellular protein degrades and consequently, the proline content increases [51].
Range of the SSR genotyped amplified alleles (2 - 5 per locus) was much similar to the earlier studies on another set of rice genotypes [17,18]. The overall poly-
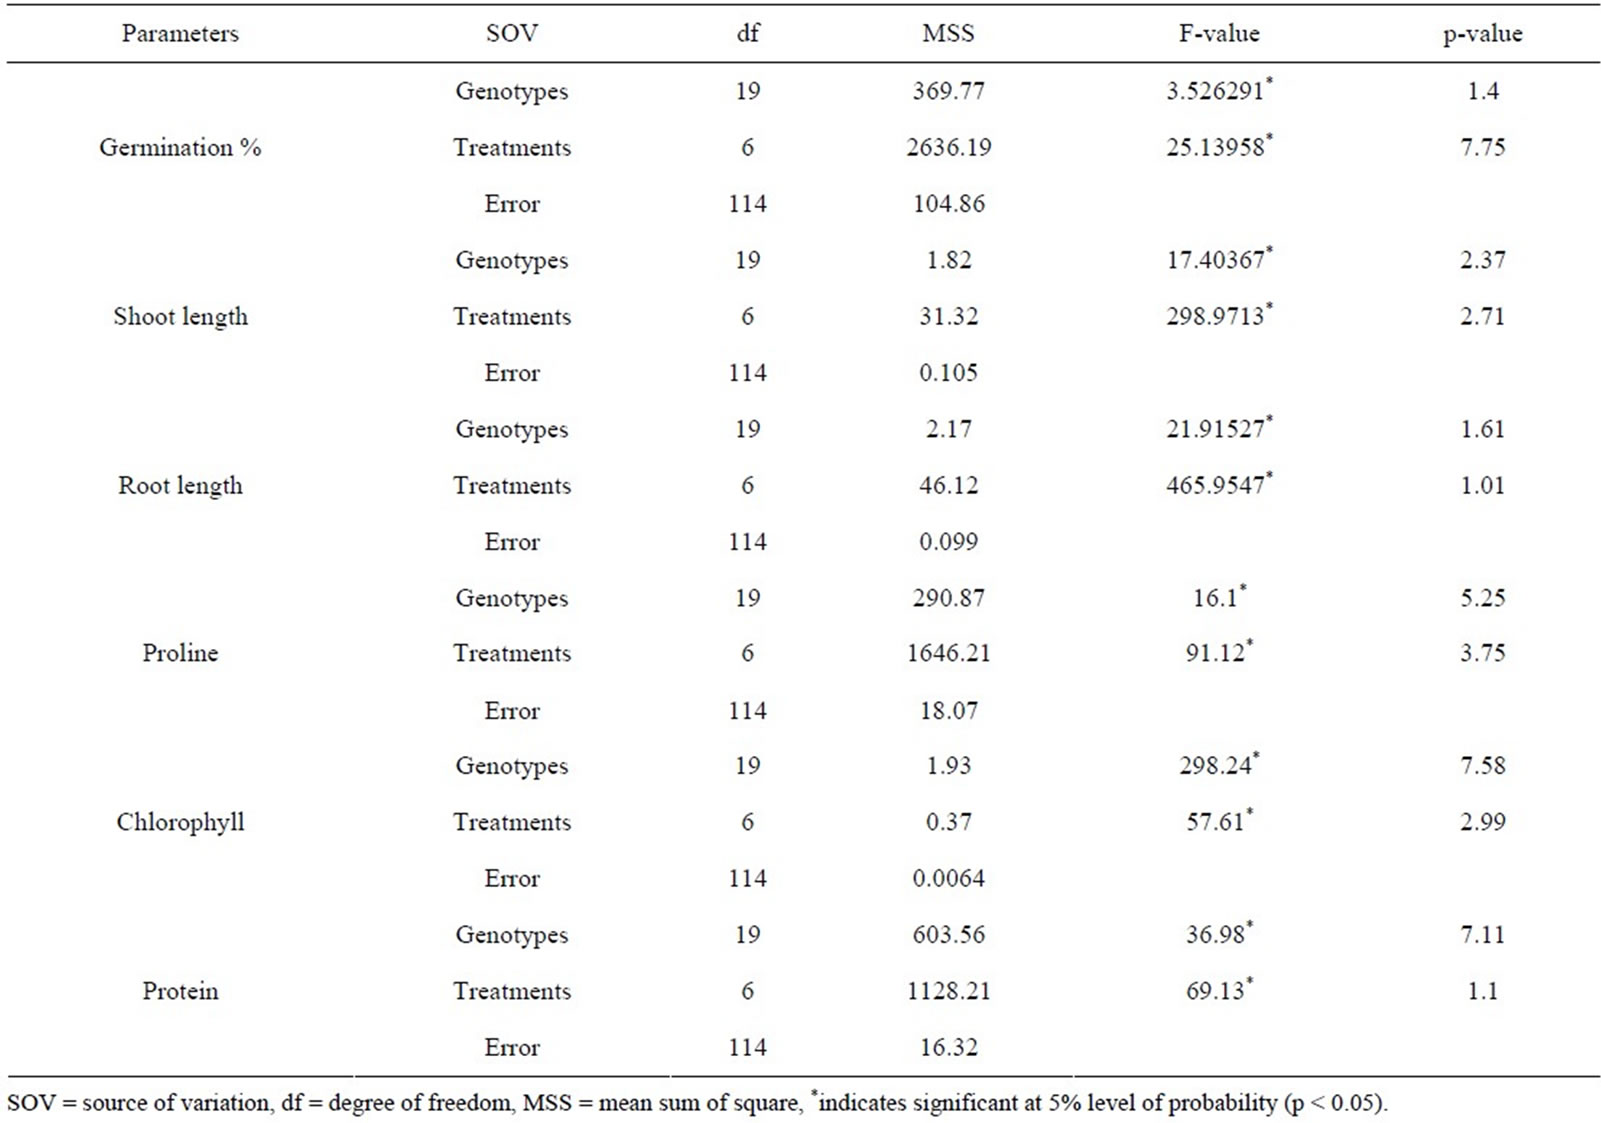
Table 3. Analysis of variance of the physio-biochemical parameters in PEG and NaCl treatments for twenty rice genotypes.
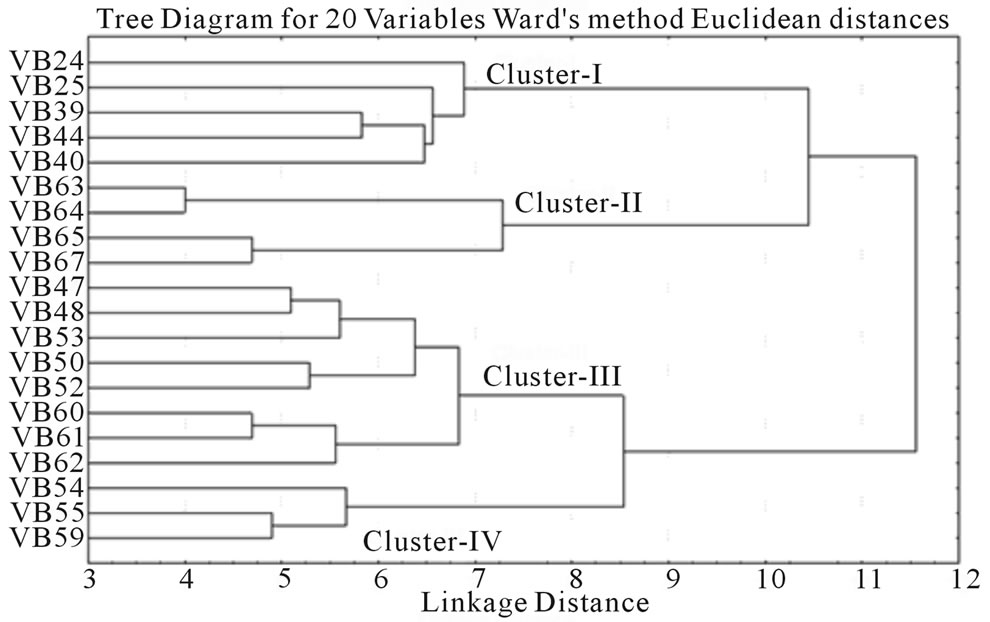
Figure 5. Clustering of twenty rice landraces based on 45 SSR fingerprint.
morphic frequency of biallelic markers was higher than the tri-, tetraand pentaallelic SSRs [11]. The number of SSR amplified alleles and their PIC values also depend upon the repeat motif and the repeat sequence of the microsatellites [52]. Temnykh et al. [53] showed that (CTT) and (AT) rich repeat motifs amplified with higher efficiency and revealed greater overall polymorphism. In this context, it was observed that SSRs (RM 493, RM 206 and RM 3412) with (CT)-rich di or tri-nucleotide repeats were effective for producing the highest number
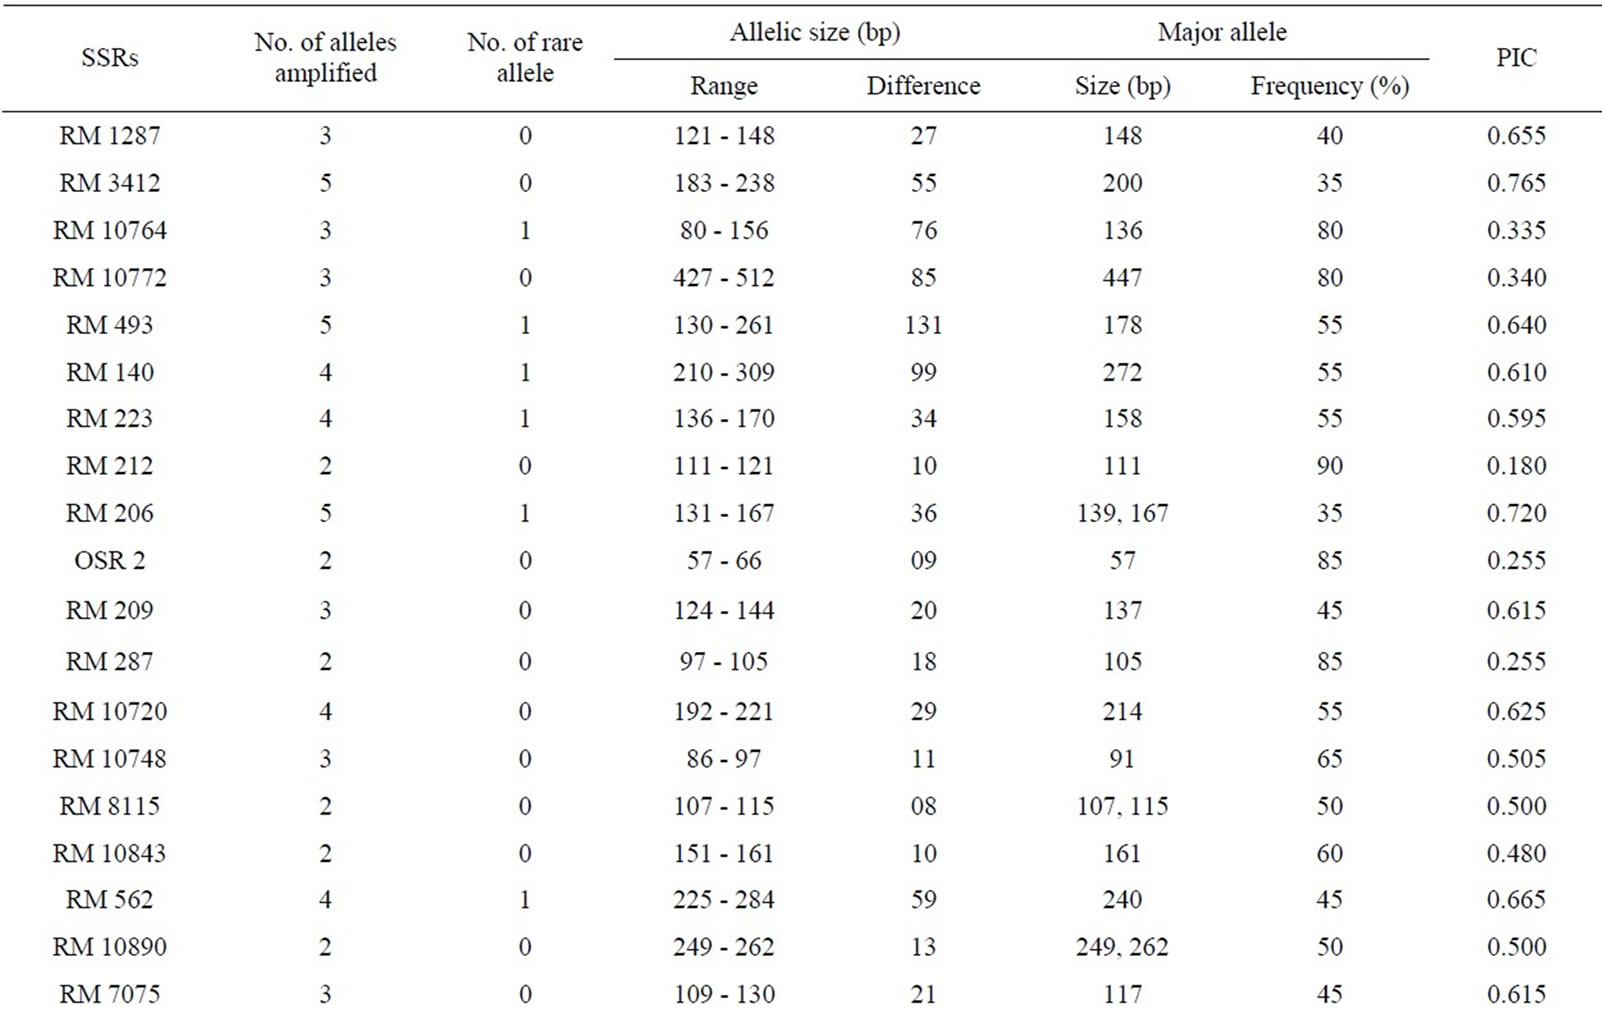
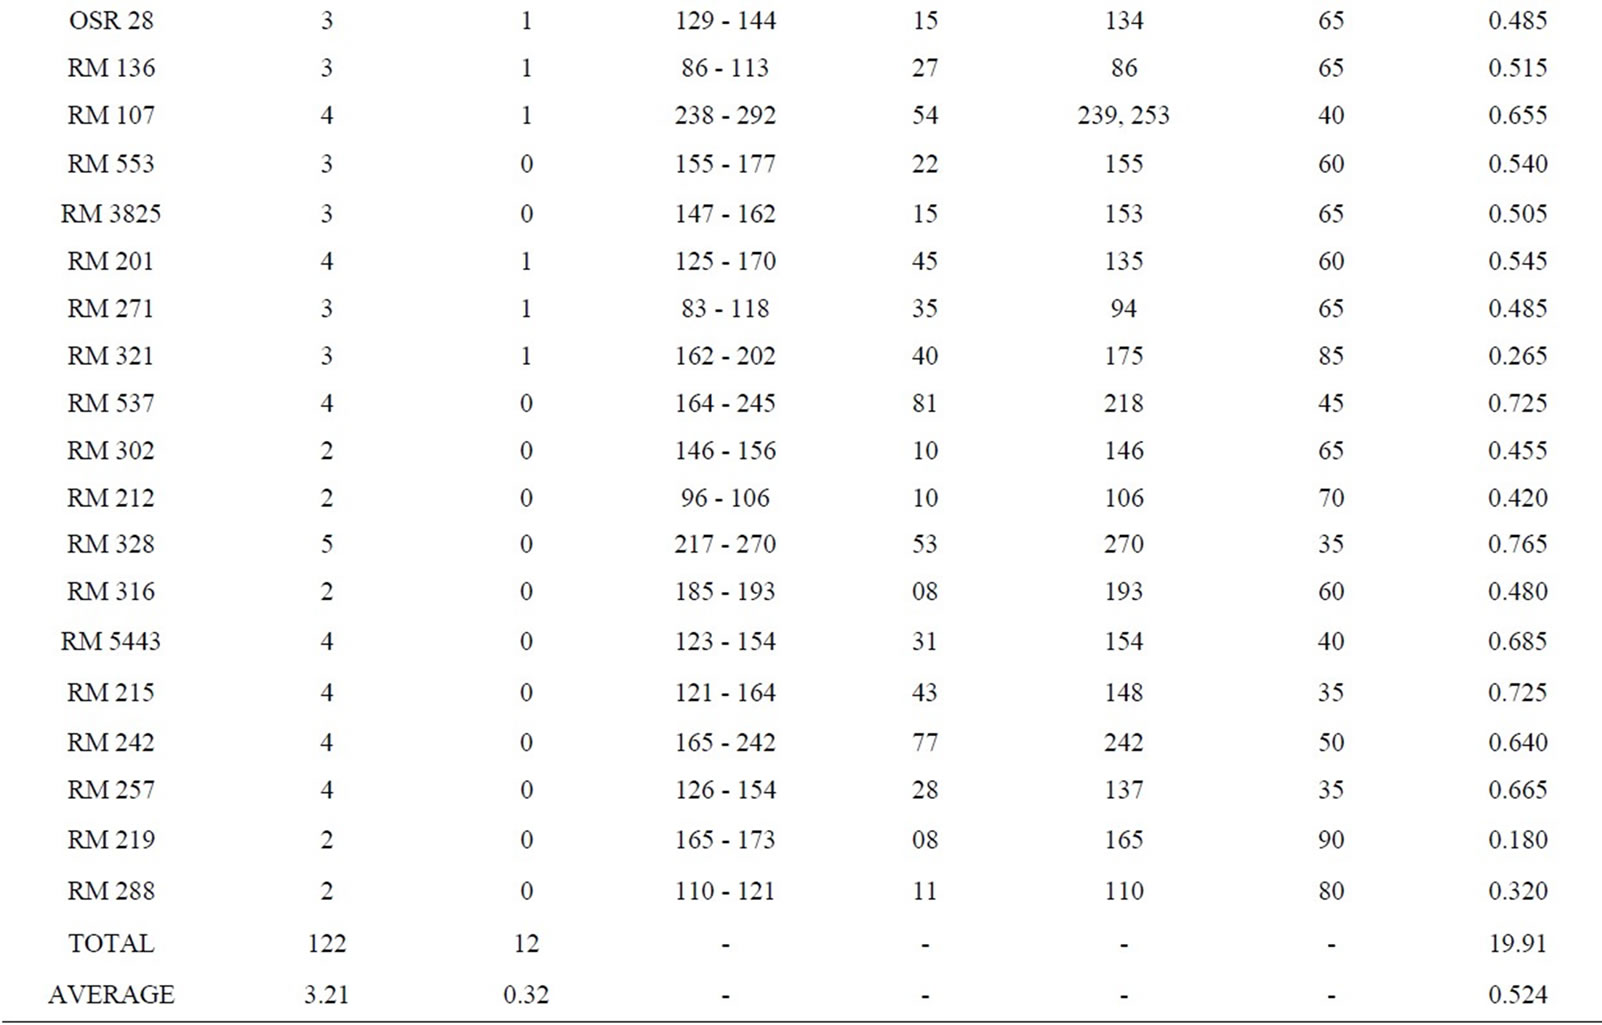
Table 4. Amplicon size range, total scorable bands, total alleles, number of unique alleles, polymorphic alleles and percentage of polymorphism for each SSR marker.
of alleles as well as highest values of PIC than other SSR markers. While variation in the size of SSR alleles results from a change in the number of repeats is the consequence of sequence changes at the primer binding site(s) [54]. The genetic relationship among the studied rice genotypes after SSR based molecular profiling has also partially confirmed by the physio-biochemical screening in relation to osmotic stress tolerance. Malik Sail and Rani Sail showed 100% germination in all stressor (PEG and NaCl) concentrations and were placed in a single cluster and thus initially proved as stress tolerant genotypes. Rup Sail and Sankar Sail showed 100% germination in only NaCl conc., but not in PEG and were placed in an another cluster. For selection of the parental rice genotypes for the development of a mapping and/or breeding population, Laxmi Sail, Mihinagra Sail, Ratan Sail and Raghu Sail were proved as stress susceptible cultivars and were placed in one cluster. On the other hand, Rup Sail-Sindur Sail and Punjab Sail-Neizer Sail pairs were found to be closely linked together in other two clusters, respectively. For future rice breeding program, the probable parental combinations derived from the partially completed analyses will be further studied for selection of the proper parental genotypes.
5. Conclusion
The physiological screening and fingerprint profile, with the aid of quantified biochemical compounds in different stress tissue of the selected traditional rice lines are the first attempt to make their overall multi-informative profiling in relation to osmotic stress tolerance. Osmotic stresses, mainly drought and salinity, adversely affected the germination percentage as well as shoot and root length of germinated seedlings which are necessary to have optimum plant growth for crop production. Chlorophyll and protein contents were declined in increasing stress doses compared to the control; whereas proline was accumulated at the higher concentration in the mature leaves with an elevated stress dose. The 45 sets of SSR markers provide a positive assessment by their ability to produce unique DNA fingerprinting profile of traditional rice genotypes leading to their genetic relationship and diversity. Microsatellite profiling combined with physiological and biochemical screening revealed that Malik Sail and Rani Sail showed full germination at both osmotic stress (due to PEG and NaCl) conditions and were recommended as tolerant genotypes; whereas Laxmi Sail, Mihinagra Sail, Ratan Sail and Raghu Sail were proved to be susceptible to drought and salinity stress for all aspects. The obtained data can be used for varietal identification and the construction of a database of such vulnerable rice landraces of West Bengal. This investigation would be more significant and useful if it can be used for more numbers of trait linked SSR markers spanning all twelve rice chromosomes.
6. Acknowledgements
Financial assistances were provided by University Grants Commission, Government of India and Department of Science and Technology, Government of West Bengal. Authors are also thankful to Prof. Somnath Bhattacharya (Department of Genetics, Bidhan Chandra Krishi Viswavidyalaya) for providing the rice landraces.
REFERENCES
- FAO (Food and Agricultural Organization), “Food Outlook Global Market,” 2008.
- R. Wassmann, S. V. K. Jagadish, S. Heuer, A. Ismail, E. Redona, R. Serraj, R. K. Singh, G. Howell, H. Pathak and K. Sumfleth, “Climate Change Affecting Rice Production: The Physiological and Agronomic Basis for Possible Adaptation Strategies,” In: D. L. Sparks, Ed., Advances in Agronomy, Elsevier Inc., Academic Press, Burlington, 2009, pp. 59-122.
- E. P. Guimaraes, “Rice Breeding,” In: M. J. Carena, Ed., Cereals, The Banks and The Italian Economy, Springer, New York, 2009, pp. 99-126.
- B. K. Joshi, “Rice Gene Pool for Tarai and Inner Tarai Areas of Nepal,” Nepal Agric. Research Journal, Vol. 6, 2005, pp. 10-22.
- N. G. Hanamaratti, S. K. Prashanthi, P. M. Salimath, R. R. Hanchinal, H. D. Mohankumar, K. G. Parameshwarappa and S. D. Raikar, “Traditional Land Races of Rice in Karnataka: Reservoirs of Valuable Traits,” Current Science, Vol. 94, No. 2, 2008, pp. 242-247.
- X. Huang, X. Wei, T. Sang, Q. Zhao, Q. Feng, Y. Zhao, C. Li, C. Zhu, T. Lu, Z. Zhang, M. Li, D. Fan, Y. Guo, A. Wang, L. Wang, L. Deng, W. Li, Y. Lu, Q. Weng, K. Liu, T. Huang, T. Zhou, Y. Jing, W. Li, Z. Lin, E. S. Buckler, Q. Qian, Q-F. Zhang, J. Li and B. Han, “Genome-Wide Association Studies of 14 Agronomic Traits in Rice Landraces,” Nature Genetics, Vol. 42, No. 11, 2010, pp. 961- 967. http://dx.doi.org/10.1038/ng.695
- Z. H. Pervaiz, S. Tehrim, M. A. Rabbani, M. S. Masood and S. A. Malik, “Diversity in Major Seed Storage Proteins of Rice Landraces of Pakistan,” Pakistan Journal of Botany, Vol. 43, 2011, pp. 1607-1612.
- S. G. Ram, V. Thiruvengadam and K. K. Vinod, “Genetic Diversity among Cultivars, Landraces and Wild Relatives of Rice as Revealed by Microsatellite Markers,” Journal of Applied Genetics, Vol. 48, No. 4, 2007, pp. 337-345. http://dx.doi.org/10.1007/BF03195230
- R. Mahajan, S. Tabia, G. Raina and N. Mangotra, “Assessment of Genetic Diversity of Non-Basmati Rice of Jammu and Kashmir Using Microsatellite Markers,” Journal of Cereals and Oil Seeds, Vol. 3, No. 2, 2012, pp. 21- 27.
- B. K. Chakravarthi and R. Naravaneni, “SSR Marker Based DNA Fingerprinting and Diversity Study in Rice (Oryza sativa L.),” African Journal of Biotechnology, Vol. 5, No. 9, 2006, pp. 684-688.
- C.Vanniarajan, K. K. Vinod and A. Pereira, “Molecular Evaluation of Genetic Diversity and Association Studies in Rice (Oryza sativa L.),” Journal of Genetics, Vol. 91, No. 1, 2012, pp. 9-19. http://dx.doi.org/10.1007/s12041-012-0146-6
- A. M. Sajib, M. M. Hossain, A. T. M. J. Mosnaz, H. Hossain, M. M. Islam, M. S. Ali and S. H. Prodhan, “SSR Marker-Based Molecular Characterization and Genetic Diversity Analysis of Aromatic Landraces of Rice (Oryza sativa L.),” Journal of BioScience and Biotechnology, Vol. 1, No. 2, 2012, pp. 107-116.
- B. I. G. Haussmann, H. K. Parzies, T. Presterl, Z. Susic and T. Miedaner, “Plant Genetic Resources in Crop Improvement,” Plant Genetic Resources, Vol. 2, No. 1, 2004, pp. 3-21. http://dx.doi.org/10.1079/PGR200430
- C. Brondani, T. C. O. Borba, P. H. N. Rangel and R. P. V. Brondani, “Determination of Genetic Variability of Traditional Varieties of Brazilian Rice Using Microsatellite Markers,” Genetics and Molecular Biology, Vol. 29, No. 4, 2006, pp. 676-684. http://dx.doi.org/10.1590/S1415-47572006000400017
- N. Dey, S. Biswas, T. Ray Chaudhury, S. R. Dey, M. De and T. K. Ghose, “RAPD-Based Genetic Diversity Analysis of Aromatic Rice (Oryza sativa L.),” Plant Cell Biotechnology and Molecular Biology, Vol. 6, 2005, pp. 133- 142.
- T. Chattopadhyay, T. Biswas, M. Chatterjee, N. Mandal and S. Bhattacharyya, “Biochemical and SSR Marker Based Characterization of Some Bengal Landraces of Rice Suffixed with ‘Sail’ in Their Name,” Indian Journal of Genetics, Vol. 68, No. 1, 2008, pp. 15-20.
- T. Lodha, J. Karmakar, R. Roychoudhuri and N. Dey, “Assessment of Genetic Diversity of Some Commonly Grown Rice Genotypes of South Bengal Using Microsatellite Markers Associated with the saltol QTL Mapped on 1st Chromosome,” NBU Journal of Plant Sciences, Vol. 5, No. 1, 2011, pp. 35-39.
- J. Karmakar, R. Roychowdhury, R. K. Kar, D. Deb and N. Dey, “Profiling of Selected Indigenous Rice (Oryza sativa L.) Landraces of Rarh Bengal in Relation to Osmotic Stress Tolerance,” Physiology and Molecular Biology of Plants, Vol. 18, No. 2, 2012, pp. 125-132. http://dx.doi.org/10.1007/s12298-012-0110-1
- B. Das, S. Sengupta, S. K. Parida, B. Roy, M. Ghosh, M. Prasad and T. K. Ghose, “Genetic Diversity and Population Structure of Rice Landraces from Eastern and North Eastern States of India,” BMC Genetics, Vol. 14, No. 1, 2013, p. 71. http://dx.doi.org/10.1186/1471-2156-14-71
- H. Akagi, Y. Yokozeki, A. Inagaki and T. Fujimura, “Microsatellite DNA Markers for Rice Chromosomes,” Theoretical and Applied Genetics, Vol. 93, No. 7, 1996, pp. 1071-1077. http://dx.doi.org/10.1007/BF00230127
- S. R. McCouch, X. Chen, O. Panaud, S. Temnykh, Y. Xu, Y. G. Cho, N. Huang, T. Ishii and M. Blair, “Microsatellite Marker Development, Mapping and Applications in Rice Genetics and Breeding,” Plant Molecular Biology, Vol. 35, No. 1-2, 1997, pp. 89-99. http://dx.doi.org/10.1023/A:1005711431474
- S. R. McCouch, S. Temnykh, A. Lukashova, J. Coburn, G. DeClerck, S. Cartinhour, S. Harrington, M. Thomson, E. Septiningsih, M. Semon, P. Moncada and L. Jiming, “Microsatellite Markers in Rice: Abundance, Diversity and Applications,” In: G. S. Khush, et al., Eds., Rice Genetics IV, IRRI, Los Baños, Philippines, 2001
- S. R. Berilus, A. Pattanayak and G. Ram, “Analysis of Genetic Variability in Rice Cultivars of Arunachal Pradesh (India) Using Microsatellite Marker,” African Journal of Biotechnology, Vol. 12, No. 8, 2013, pp. 798-810.
- B. Choudhury, M. L. Khan and S. Dayanandan, “Genetic Structure and Diversity of Indigenous Rice (Oryza sativa) Varieties in the Eastern Himalayan Region of Northeast India,” SpringerPlus, Vol. 2, 2013, p. 228. http://dx.doi.org/10.1186/2193-1801-2-228
- S. M. Shah, S. A. Naveed and M. Arif, “Genetic Diversity in Basmati and Non-Basmati Rice Varieties Based on Microsatellite Markers,” Pakistan Journal of Botany, Vol. 45, No. S1, 2013, pp. 423-431.
- M.-H. Lin, C.-W. Lin, J.-C. Chen, Y.-C. Lin, S.-Y. Cheng, T.-H. Liu, F.-J. Jan, S.-T. Wu, F.-S. Thseng and H.-M. Ku, “Tagging Rice Drought-Related QTL with SSR DNA Markers,” Crop, Environment & Bioinformatics, Vol. 4, No. 1, 2007, pp. 65-76.
- R. Venuprasad, M. E. Bool, L. Quiatchon, M. T. Sta Cruz, M. Amante and G. N. Atlin, “A Large-Effect QTL for Rice Grain Yield Under Upland Drought Stress on Chromosome 1,” Molecular Breeding, Vol. 30, No. 1, 2012, pp. 535-547. http://dx.doi.org/10.1007/s11032-011-9642-2
- L. H. Linh, T. H. Linh, T. D. Xuan, T. H. Ham, A. M. Ismail and T. D. Khanh, “Molecular Breeding to Improve Salt Tolerance of Rice (Oryza sativa L.) in the Red River Delta of Vietnam,” International Journal of Plant Genome, 2012, Article ID: 949038.
- M. A. Haque, M. A. Mahmud, M. M. Islam and S. N. Begum, “Identification of Introgressed Rice Lines of Binadhan-7×FL-378 under Salt Stress through SSR Markers,” Journal of Bangladesh Agriculture University, Vol. 10, No. 1. 2012, pp. 49-54.
- T. Biswas, A. Das and S. Bhattacharyya, “Microsatellite Marker Based Diversity Analysis for Submergence Tolerance in Some Bengal Landraces of Rice (Oryza sativa L.),” Journal of Tropical Agriculture, Vol. 50, No. 1-2, 2012, pp. 67-71.
- N. R. M. K. N. D. Rathnayake, A. P. Bentota, D. M. N. Dissanayake, K. L. N. S. Perera, S. D. S. S. Sooriyapathirana and G. A. U. Jayasekera, “DNA Markers RM 464A and RM 219 Haplotypes are Effective in Selecting sub-1 Locus for the Introgression of Submergence Tolerance Into New Rice Varieties,” Ceylon Journal of Science (Biological Science), Vol. 41, No. 2, 2012, pp. 125-136.
- R. K. Agnihotri, L. M. S. Palni and D. K. Pandey, “Germination and Seedling Growth under Moisture Stress: Screening of Landraces of Rice (Oryza sativa L.) from Kumaun Region of India Central Himalaya,” Journal of Plant Biology, Vol. 34, No. 1, 2007, pp. 21-27.
- P. Shanthi, S. Jebaraj and S. Geetha, “In vitro Screening for Salt Tolerance in Rice (Oryza sativa),” Electronic Journal of Plant Breeding, Vol. 1, No. 4, 2010, pp. 1208- 1212.
- ISTA, “International Rules for Seed Testing,” Seed Science and Technology, Vol. 24, 1996.
- D. I. Arnon, “Copper Enzymes in Isolated Chloroplasts: Polyphenoloxidase in Beta vulgaris,” Plant Physiology, Vol. 24, No. 1, 1949, pp. 1-15. http://dx.doi.org/10.1104/pp.24.1.1
- S. Sadasivam and A. Manickam, “Biochemical Methods,” New Age International Publishers (P) Ltd., New Delhi, 2010.
- H. W. Li, B. S. Zang, X. W. Deng and X. P. Wang, “Overexpression of the Trehalose-6-Phosphate Synthase Gene OsTPS1 Enhances Abiotic Stress Tolerance in Rice,” Planta, Vol. 234, No. 5, 2011, pp. 1007-1018. http://dx.doi.org/10.1007/s00425-011-1458-0
- V. G. Panse and P. V. Sukhatme, “Statistical Methods for Agricultural Workers,” 2nd Edition, ICAR publication, New Delhi, 1967.
- R. Roychowdhury, J. Karmakar and N. Dey, “PCR-Compatible Genomic DNA Isolation From Different Tissues of Rice (Oryza sativa) for SSR Fingerprinting,” EurAsian Journal of BioSciences, Vol. 6, 2012, pp. 85-90. http://dx.doi.org/10.5053/ejobios.2012.6.0.10
- G. Mohammadi-Nejad, A. Arzani, A. M. Rezai, R. K. Singh and G. B. Gregorio, “Assessment of Rice Genotypes for Salt Tolerance Using Microsatellite Markers Associated With the saltol QTL,” African Journal of Biotechnology, Vol. 7, No. 6, 2008, pp. 730-736.
- M. S. Rahman, M. K. H. Sohag and L. Rahman, “Microsatellite Based DNA Fingerprinting of 28 Local Rice (Oryza sativa L.) Varieties of Bangladesh,” Journal of Bangladesh Agriculture University, Vol. 8, No. 1, 2010, pp. 7-17.
- H. H. Lee, P. P. N. Neoh, W. S. T. Bong, J. Puvaneswaran, S. C. Wong, P. H. Yiu and A. Rajan, “Genotyping of Sarawak Rice Cultivars Using Microsatellite Markers,” Pertanika Journal of Tropical Agricultural Science, Vol. 34, No. 1, 2011, pp. 123-136.
- T. Y. Hwang, T. Sayama, T. Takahashi, Y. Takada, Y. Nakamoto, H. Funatsuki, H. Hisano, S. Sasamoto, S. Sato, S. Tabata, I. Kono, M. Hoshi, M. Hanawa, C. Yano, Z. Xia, K. Harada, K. Kitamura and M. Ishimoto, “High-Density Integrated Linkage Map Based on SSR Markers in Soybean,” DNA Research, Vol. 16, No. 4, 2009, pp. 213-225. http://dx.doi.org/10.1093/dnares/dsp010
- S. Gulzar and A. Khan, “Seed Germination of a Halophytic Grass Aeluropus agopoides,” Annals of Botany, Vol. 87, No. 3, 2001, pp. 319-324. http://dx.doi.org/10.1006/anbo.2000.1336
- M. Z. Alam, T. Stuchbury and R. E. L. Naylor, “Effect of NaCl and PEG Induced Osmotic Potentials on Germination and Early Seedling Growth of Rice Cultivars Differing in Salt Tolerance,” Pakistan Journal of Biological Science, Vol. 5, No. 11, 2002, pp. 1207-1210. http://dx.doi.org/10.3923/pjbs.2002.1207.1210
- C. Guoxiong, T. Krugman, T. Fahima, A. B. Korol and E. Nevo, “Comparative Study on Morphological and Physiological Traits Related to Drought Resistance between Xeric and Mesic Hordeum spontaneum Lines in Isreal,” Barley Genetics Newsletter, Vol. 32, 2002, pp. 22-33.
- S. K. Pradhan, K. R. Mahanta and G. Ramkrishnayya, “Response of Upland Rice Cultivars Under Varying Soil Moisture Regimes,” Indian Journal of Plant Physiology, Vol. 8, No. 3, 2003, pp. 292-296.
- E. G. Castillo, P. T. Tuong, A. M. Ismail and K. Inubushi, “Response to Salinity in Rice: Comparative Effects of Osmotic and Ionic Stresses,” Plant Production Science, Vol. 10, No. 2, 2007, pp. 159-170. http://dx.doi.org/10.1626/pps.10.159
- S. Cha-um, P. Vejchasarn and C. Kirdmanee, “An Effective Defensive Response in Thai Aromatic Rice Varieties (Oryza sativa L. spp. indica) to Salinity,” Journal of Crop Science and Biotechnology, Vol. 10, No. 4, 2007, pp. 257-264.
- E. S. Koksal, H. Ustun, H. Ozcan and A. Gunturk, “Estimating Water Stressed Dwarf Green Bean Pigment Concentration through Hyperspectral Indices,” Pakistan Journal of Botany, Vol. 42, No. 3, 2010, pp. 1895-1901.
- R. Roy, P. B. Mazumder and G. D. Sharma, “Proline, Catalase and Root Traits as Indices of Drought Resistance in Bold Grained Rice (Oryza sativa) Genotypes,” African Journal of Biotechnology, Vol. 8, No. 23, 2009, pp. 6521- 6528.
- S. Temnykh, G. DeClerck, A. Lukashova, L. Lipovich, S. Cartinhour and S. McCouch, “Computational and Experimental Analysis of Microsatellites in Rice (Oryza sativa L.): Frequency, Length Variation, Transposon Associations and Genetic Marker Potential,” Genome Research, Vol. 11, 2001, pp. 1441-1452. http://dx.doi.org/10.1101/gr.184001
- S. Temnykh, W. D. Park, N. Ayres, S. Cartinhour, N. Hauck, L. Lipovich, Y. G. Cho, T. Ishii and S. R. McCouch, “Mapping and Genome Organization of Microsatellite Sequences in Rice (Oryza sativa L.),” Theoretical and Applied Genetics, Vol. 100, No. 5, 2000, pp. 697-712. http://dx.doi.org/10.1007/s001220051342
- S. Pal, S. Jain, N. Saini, A. Arti and R. K. Jain, “Identification of Microsatellite Markers for Differentiating Some Basmati and Non-Basmati Rice Varieties,” Indian Journal of Biotechnology, Vol. 3, No. 4, 2004, pp. 519-526.
NOTES
*Corresponding author.