American Journal of Plant Sciences
Vol.3 No.8(2012), Article ID:22179,4 pages DOI:10.4236/ajps.2012.38130
Genetic Diversity in Selected Indian Mungbean [Vigna radiata (L.) Wilczek] Cultivars Using RAPD Markers
![]()
1Indian Institute of Pulses Research, Kanpur, India; 2International Center for Agricultural Research in the Dry Areas, Aleppo, Syria; 3Project Coordination Unit, MuLLARP Crops, Indian Institute of Pulses Research, Kanpur, India; 4Applied Genomics Laboratory, International Crops Research Institute for the Semi Arid Tropics, Patancheru, India; 5Crop Sciences Division, Indian Council of Agricultural Research, New Delhi, India.
Email: *subhojit@email.com
Received April 7th 2012; revised May 3rd, 2012; accepted May 12th, 2012
Keywords: Fingerprinting; Genetic Diversity; Mungbean; RAPD
ABSTRACT
Random amplified polymorphic DNA (RAPD) markers were used to study the DNA polymorphism in Indian mungbean cultivars. A total of 60 random primers were used in the study and 33 of them generated reproducible RAPD patterns. Amplification of genomic DNA of most popular 24 Indian mungbean cultivars with these RAPD primers yielded 249 fragments that could be scored, of which 224 were polymorphic, with an average of 7.0 polymorphic fragments per primer. Number of amplified fragments with random primers ranged from 2 (OPI 9) to 17 (OPD 7). Percentage polymorphism ranged from 33% (OPX 5) to a maximum of 100% (OPX 4, OPX 6, OPX 13, OPX 15, OPX 19, OPD 5, OPD 7, OPD 20, OPI 4, OPI 6, OPI 13, OPI 14, OPI 18 and OPF 1), with an average of 90%. The Jaccard’s similarity indices based on RAPD profiles were subjected to UPGMA cluster analysis. And genotypes grouped in two major groups. Sixteen out of 24 released cultivars grouped to cluster I. This indicated the narrow genetic base in the Indian mungbean cultivars used in the study. The details of diversity analysis and possible reasons for narrow genetic base in mungbean cultivars are discussed in the present study.
1. Introduction
Mungbean [Vigna radiata (L.) Wilczek] is one of the most important edible food legumes of Asia. In India and some South Asian countries, it contributes significant dietary protein supply in predominantly cereal rich diets. Recently domestic consumption of mungbean has increased because of the rising popularity in Indian ethnic foods and perceived health benefits due to high levels of certain minerals and vitamins.
Being major producer of mungbean, India has developed 130 commercial cultivars. These varieties are characterized by high degree of homogeneity. A large number of cultivars utilizing limited genetic resources are grown and are being released. A recent study based on pedigree analysis indicated that a group of nine landraces account for nearly 78% contributions in released cultivars in India [1]. Even when breeding programmes emphasize to involve diverse sources as parental lines, the plant breeders generally limit their efforts to a narrow range of adapted lines for genetic improvement, leading to erosion of genetic diversity in long run.
Assessment of genetic diversity in available cultivars has important implications in understanding the progress made in any breeding programme. Morphological markers are routinely used for estimating the genetic diversity, but recently many molecular marker techniques have developed into powerful tools to analyze genetic relationships. Genetic diversity within varieties or germplasm using molecular markers has been studied in several food legume species including Cicer [2,3], Snap bean [4], common bean [5], pea [6], pigeonpea [7], cowpea [8] and soybean [9]. In mungbean, different marker systems like RAPD [10,11], AFLP [12] and ISSR [13], have been employed to study the genetic relationships and genetic variations among the cultivars.
The objective of the present study was to investigate and compare genetic diversity using random amplified polymorphic DNA (RAPD) markers, for assessing the genetic base of released Indian cultivars of mungbean. The study also aims to generate molecular fingerprints for varietal identification.
2. Materials and Methods
2.1. Plant Materials and DNA isolation
The plant materials used for this study included 24 released cultivars of mungbean popularly grown in different regions of India (Table 1). Seeds of these varieties were collected from DUS testing plots maintained for reference cultivars at Indian Institute of Pulses Research, Kanpur. Any off-type plants were removed and pure seeds true to each cultivar were harvested. Seeds of 24 mungbean genotypes were germinated under etiolated conditions on paper towel soaked in sterilized water. One-week-old seedlings were ground in preheated CTAB buffer and incubated at 60˚C for 1 h. The aqueous phase containing DNA was separated using chloroform:isoamyl alcohol (24:1) [14]. The DNA was precipitated with chilled iso-propanol and the pellet was dissolved in 100 µl of T10E1 buffer. The RNA was eliminated by adding 0.5 U of RNase. The pellet was dissolved in appropriate amount of T10E1 (Tris10 mM, EDTA 1 mM) buffer. DNA samples was quantified both by visual quantification by comparing with known amount of lambda DNA and UV spectrophotometry (Smart Spec Plus, BioRad) and finally diluted to a concentration of 25 ng/ml.
2.2. PCR Amplifications
RAPD markers were tested for their ability to detect polymorphisms using template DNA and 60 arbitrary 10 bp long oligonucleotides, as primers belonging to OPD, OPX and OPI series (Operon Technologies, USA). PCR conditions were standardized using varying concentrations of primers and template DNA as described by Deragon and Landry [15]. After standardization, the reaction were carried out in 25 μl volume and contained 2.5 μl of 10× Taq buffer, 2.5 μl of 2 mM dNTP mix, 30 nM primer, 1 unit of Taq polymerase and 25 ng of template DNA. The thermal cycling program was carried out in a PTC Thermal cycler (MJ Research, Biorad). The PCR program had an initial denaturation step at 94˚C for 4 min, followed by 44 cycles of 94˚C for 1 min, 37˚C for 1 min, and 72˚C for 2 min. A final extension step given at
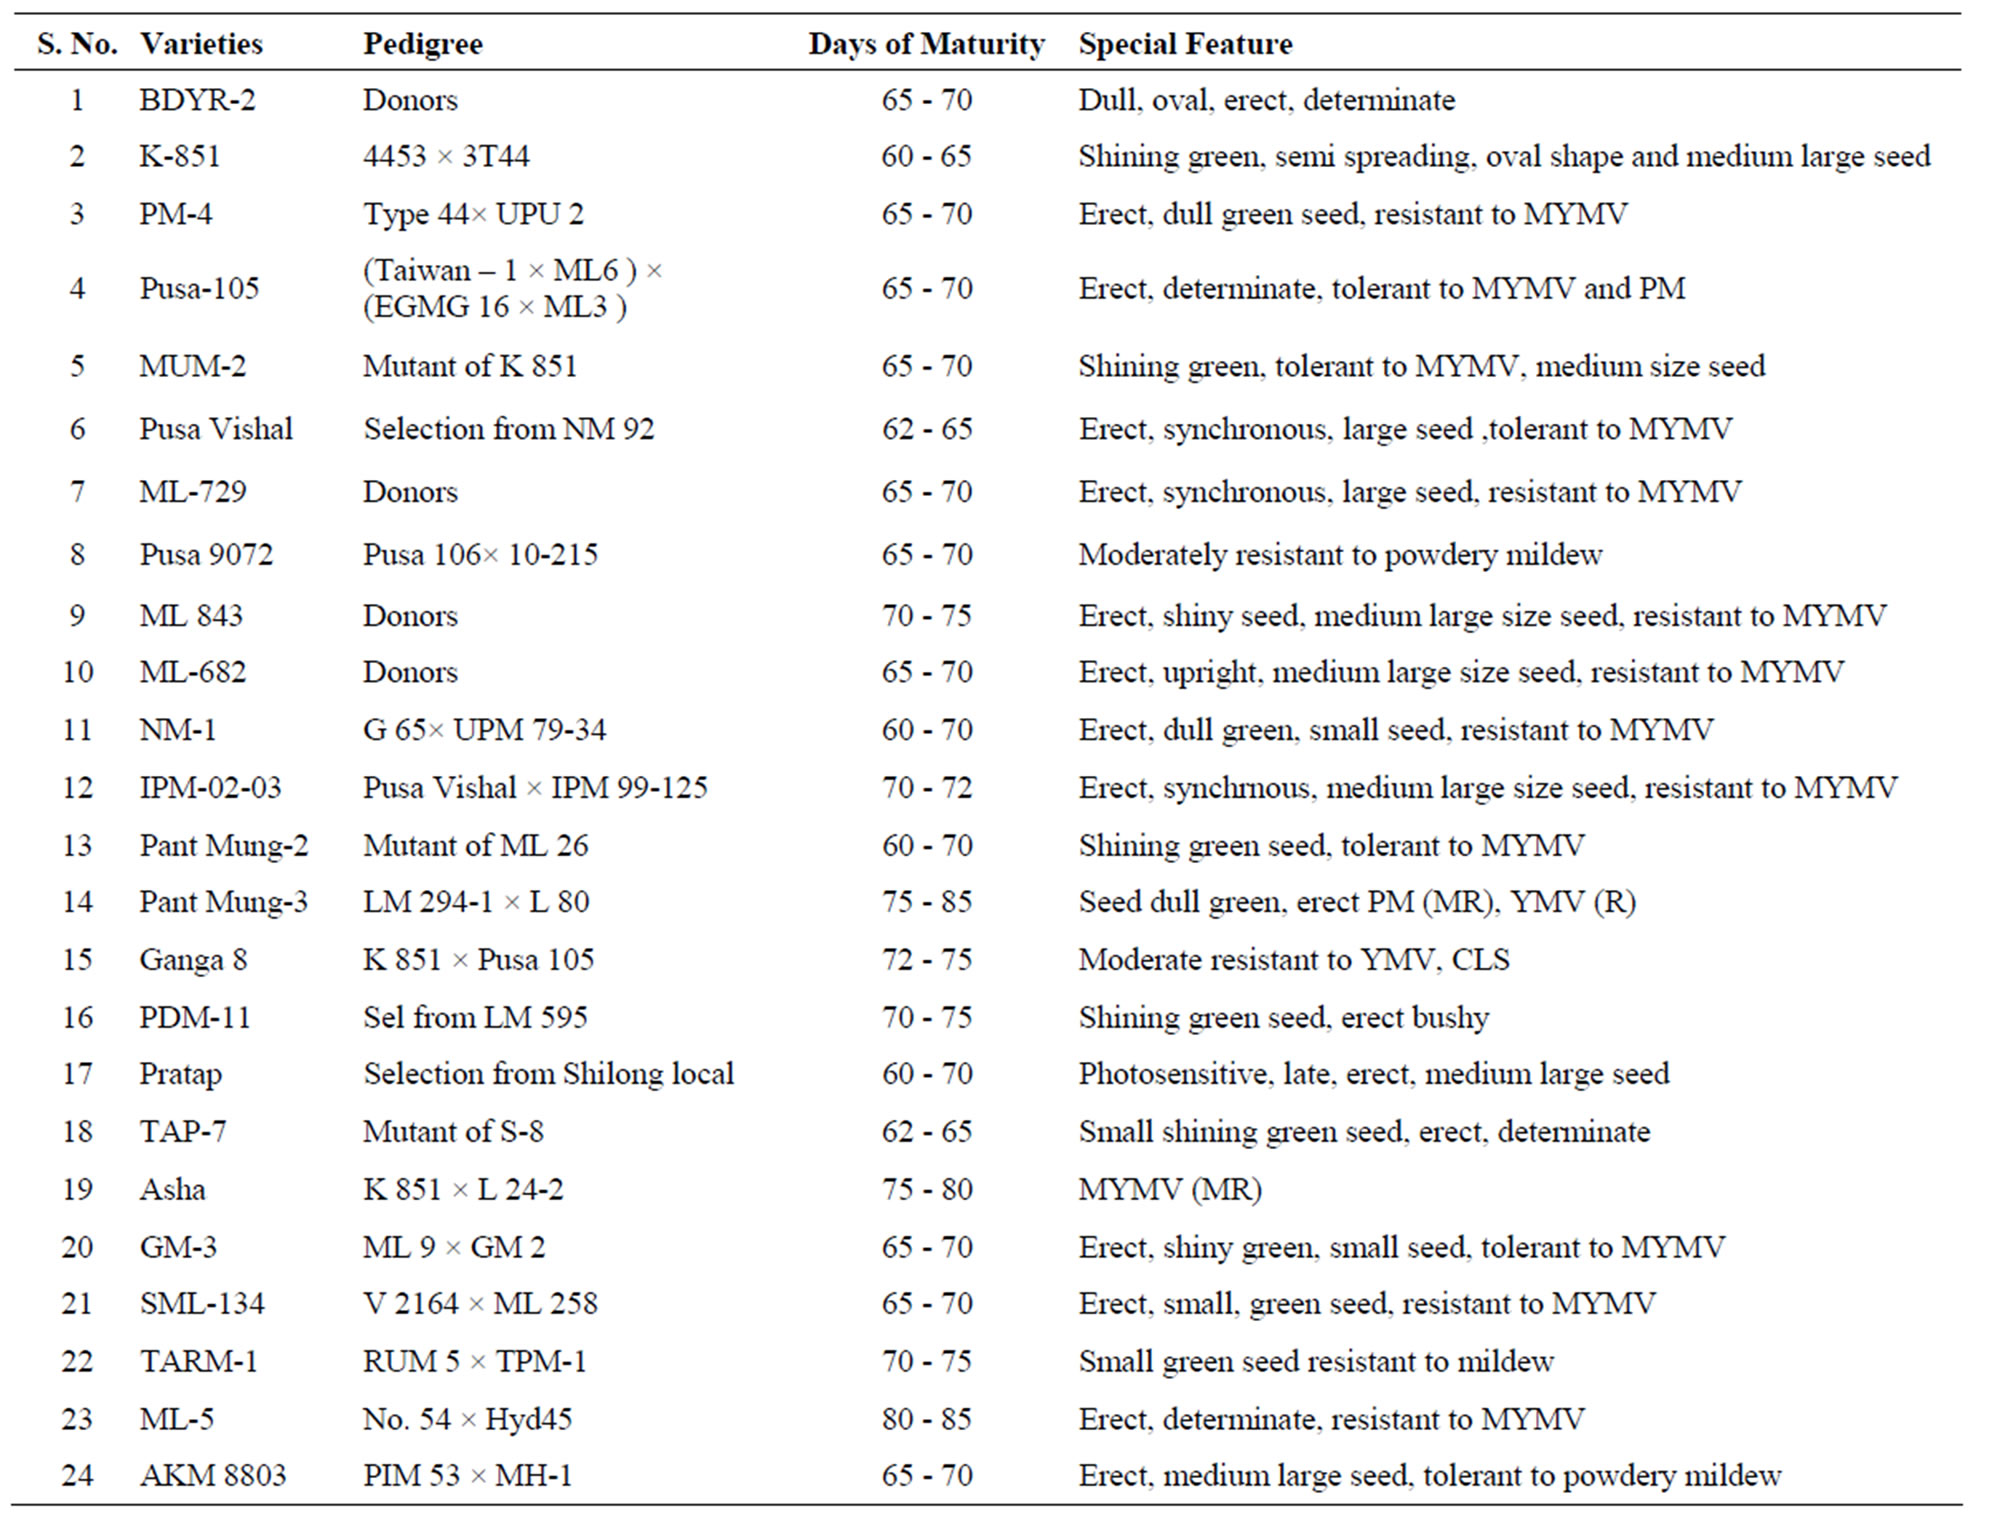
Table 1. Morphological description of 24 mungbean genotypes used in the study.
72˚C for 7 min. The amplified products were resolved by electrophoresis at 75 V for 3 hours in 1.2% agarose gel in 1× TBE buffer. The DNA bands were visualized by staining gel in 1% ethidium bromide solution and photographed under UV light using an Alpha image Digidoc gel documentation system. A 100 bp DNA ladder (MBI Fermentas) was used as a molecular weight marker for determining the molecular weight of the amplified products.
2.3. Scoring and Data Analysis
Digitized gel photograph of RAPD results were analyzed using NTSYS PC Ver.2.0 numerical software package [16]. Data was recorded as 1 (presence) or 0 (absence), each of which were treated as an independent character. The bands which were very faint were not considered for scoring. For each primer, PCR reactions were repeated two times and only reproducible bands were considered for analysis. The primers which did not produce amplification were repeated at least three times before discarding them. The pair wise similarity between isolates and polymorphic bands were calculated using Jaccard’s coefficient [17], a common estimator of genetic identity, or estimates interspecific relationships. The similarity coefficients were used to construct a dendrogram for determining relationship using unweighted pair group method with arithmetic average (UPGMA). Robustness of clusters was evaluated by bootstrap analysis using WINBOOT software [18].
3. Results
3.1. RAPD Analysis
A total of sixty RAPD primers from Operon technologies Inc. were used to assess the diversity in the 24 Indian mungbean cultivars. Out of sixty primers tested, thirty three of them generated reproducible RAPD patterns. These primers amplified a total of 249 bands (Table 2). Thus the average number of bands amplified per primer was 7. Twenty three primers showed more than 80% polymorphism. The total number of polymorphic bands amplified was 224 (90%). Among the responding primers OPD-7 produces maximum number of bands (17) with 100% polymorphism while primer OPI-9 produces the minimum number of bands (2). The size of products ranged from 250 bp to 2600 bp. Percentage polymorphism ranged from 33% (OPX 5) to a maximum of 100% (OPX 4, OPX 6, OPX 13, OPX 15, OPX 19, OPD 5, OPD 7, OPD 20, OPI 4, OPI 6, OPI 13, OPI 14, OPI 18 and OPF 1). Figure 1 is the representative of the extent of polymorphism observed among the mungbean cultivars as revealed by OPD 7 and OPD 15.
3.2. Cluster Analysis
The Jaccard’s similarity indices based on RAPD profiles were subjected to UPGMA analysis. The dendrogram revealed the genetic similarity among the twenty four varieties of mungbean which ranged from 0.45 to 0.78, but mostly concentrated between 0.60 and 0.75 (Figure 2). The RAPD cluster pattern is presented in Figure 2. It showed two main clusters, Cluster I comprising of sixteen varieties in five sub clusters (IA to IE) and cluster II comprises of four varieties. But, four varieties AKM 8803, ML843, Pusa 9972 and Pant Mung 3 took an independent position.
Sub cluster IA comprised of two varieties and one donor (IPM-02-3, Ganga 8 and BDYR-2), which has been used in development of most cultivars. Sub cluster IB consist of three varieties( Pratap, Asha, TAP 7), sub cluster IC also comprised of three varieties K 851, Pant Mung 4, MUM 2; sub cluster ID consists five varieties (Pusa-105, PusaVishal, ML 729, NM 1 and ML 682), sub cluster IE comprised Pant mung 2 and PDM 11. Cluster II comprise of four varieties (GM-3, TARM-1, ML-5 and SML-134). Robustness of the nodes in the dendrogram was tested using Bootstraps analysis. Cultivars TAP 7 and Pratap clustered in sub cluster IB shared 86% similarity. The genetic similarity was good (78%) between these two cultivars, while Pusa Vishal and ML 729 in sub cluster ID showed 75% genetic similarity with bootstrap value of 58.4%. In sub cluster IC, K-851 and PM 4 were showing a bootstrap value of 40.6% at a genetic diversity of 71%. In Cluster II, TRAM 1 and ML 5 share 59% genetic similarity with 54.9% bootstrap confidence.
4. Discussion
In this study, the objective was to examine the relationship among 24 commonly grown mungbean cultivars of India. In recent years a number of studies have been undertaken to assess the genetic diversity and phylogenetic relationship in plant genetic resources. Several workers have reported the usefulness of RAPD technique in studying the diversity of crop cultivars [19]. RAPD markers have been used successfully to assess molecular polymorphism in Vigna [20], mungbean [10,11], Chickpea [3], pea [6], pigeonpea [7], and in cowpea [8]. The use of appropriate statistical method especially in case of RAPD analysis is very important to make genetic variation more definitive. The UPGMA is based on the assumption that mutation rate among different genotypes is constant and this has been widely used for analysis of genetic variation in plants. This method has been employed in present study during analysis of RAPD polymorphism and thus the clusters obtained are reproducible.
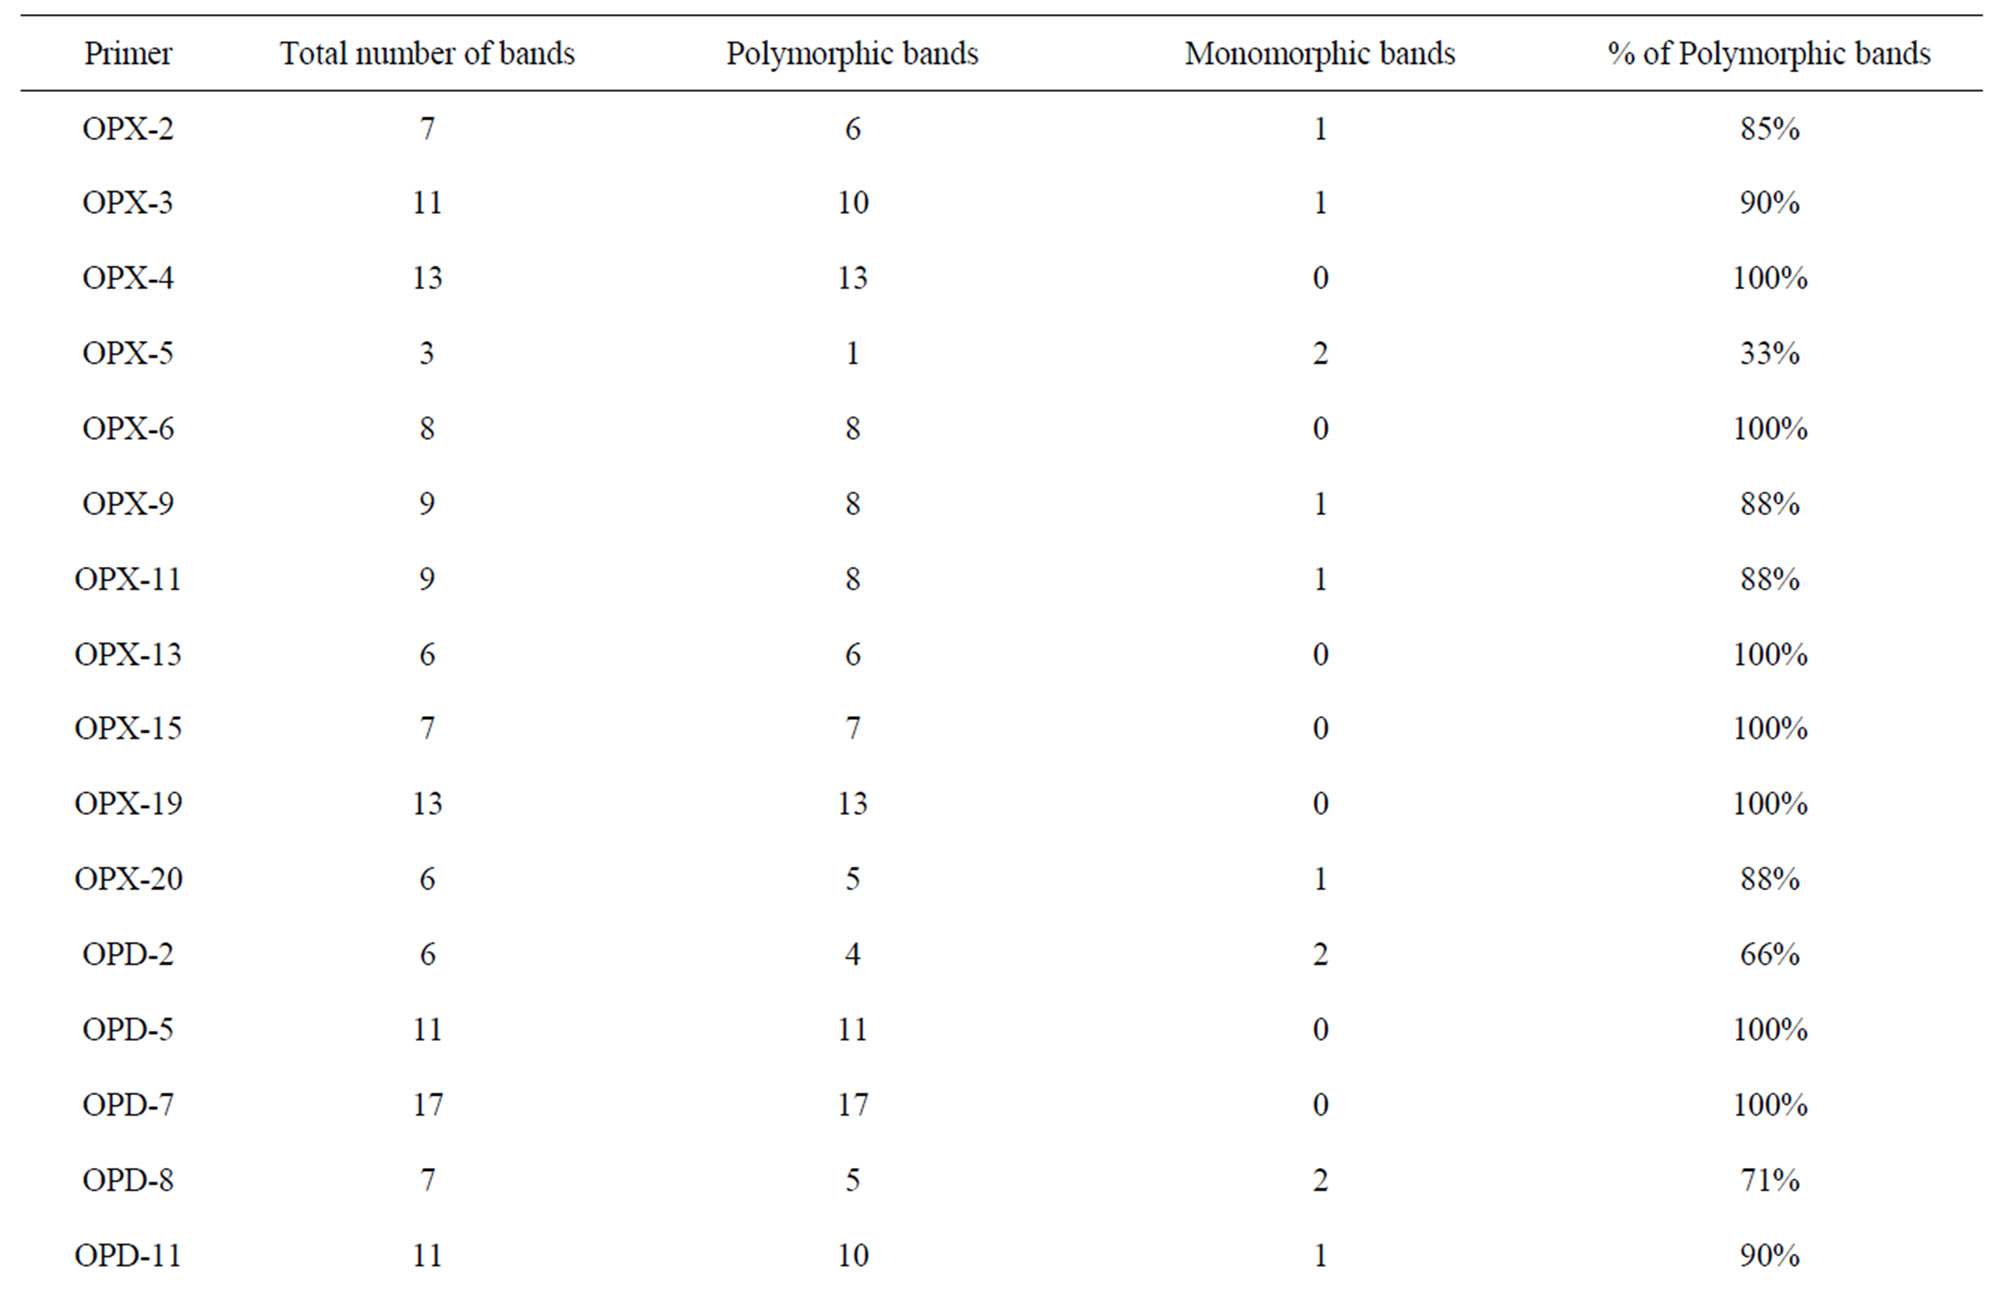
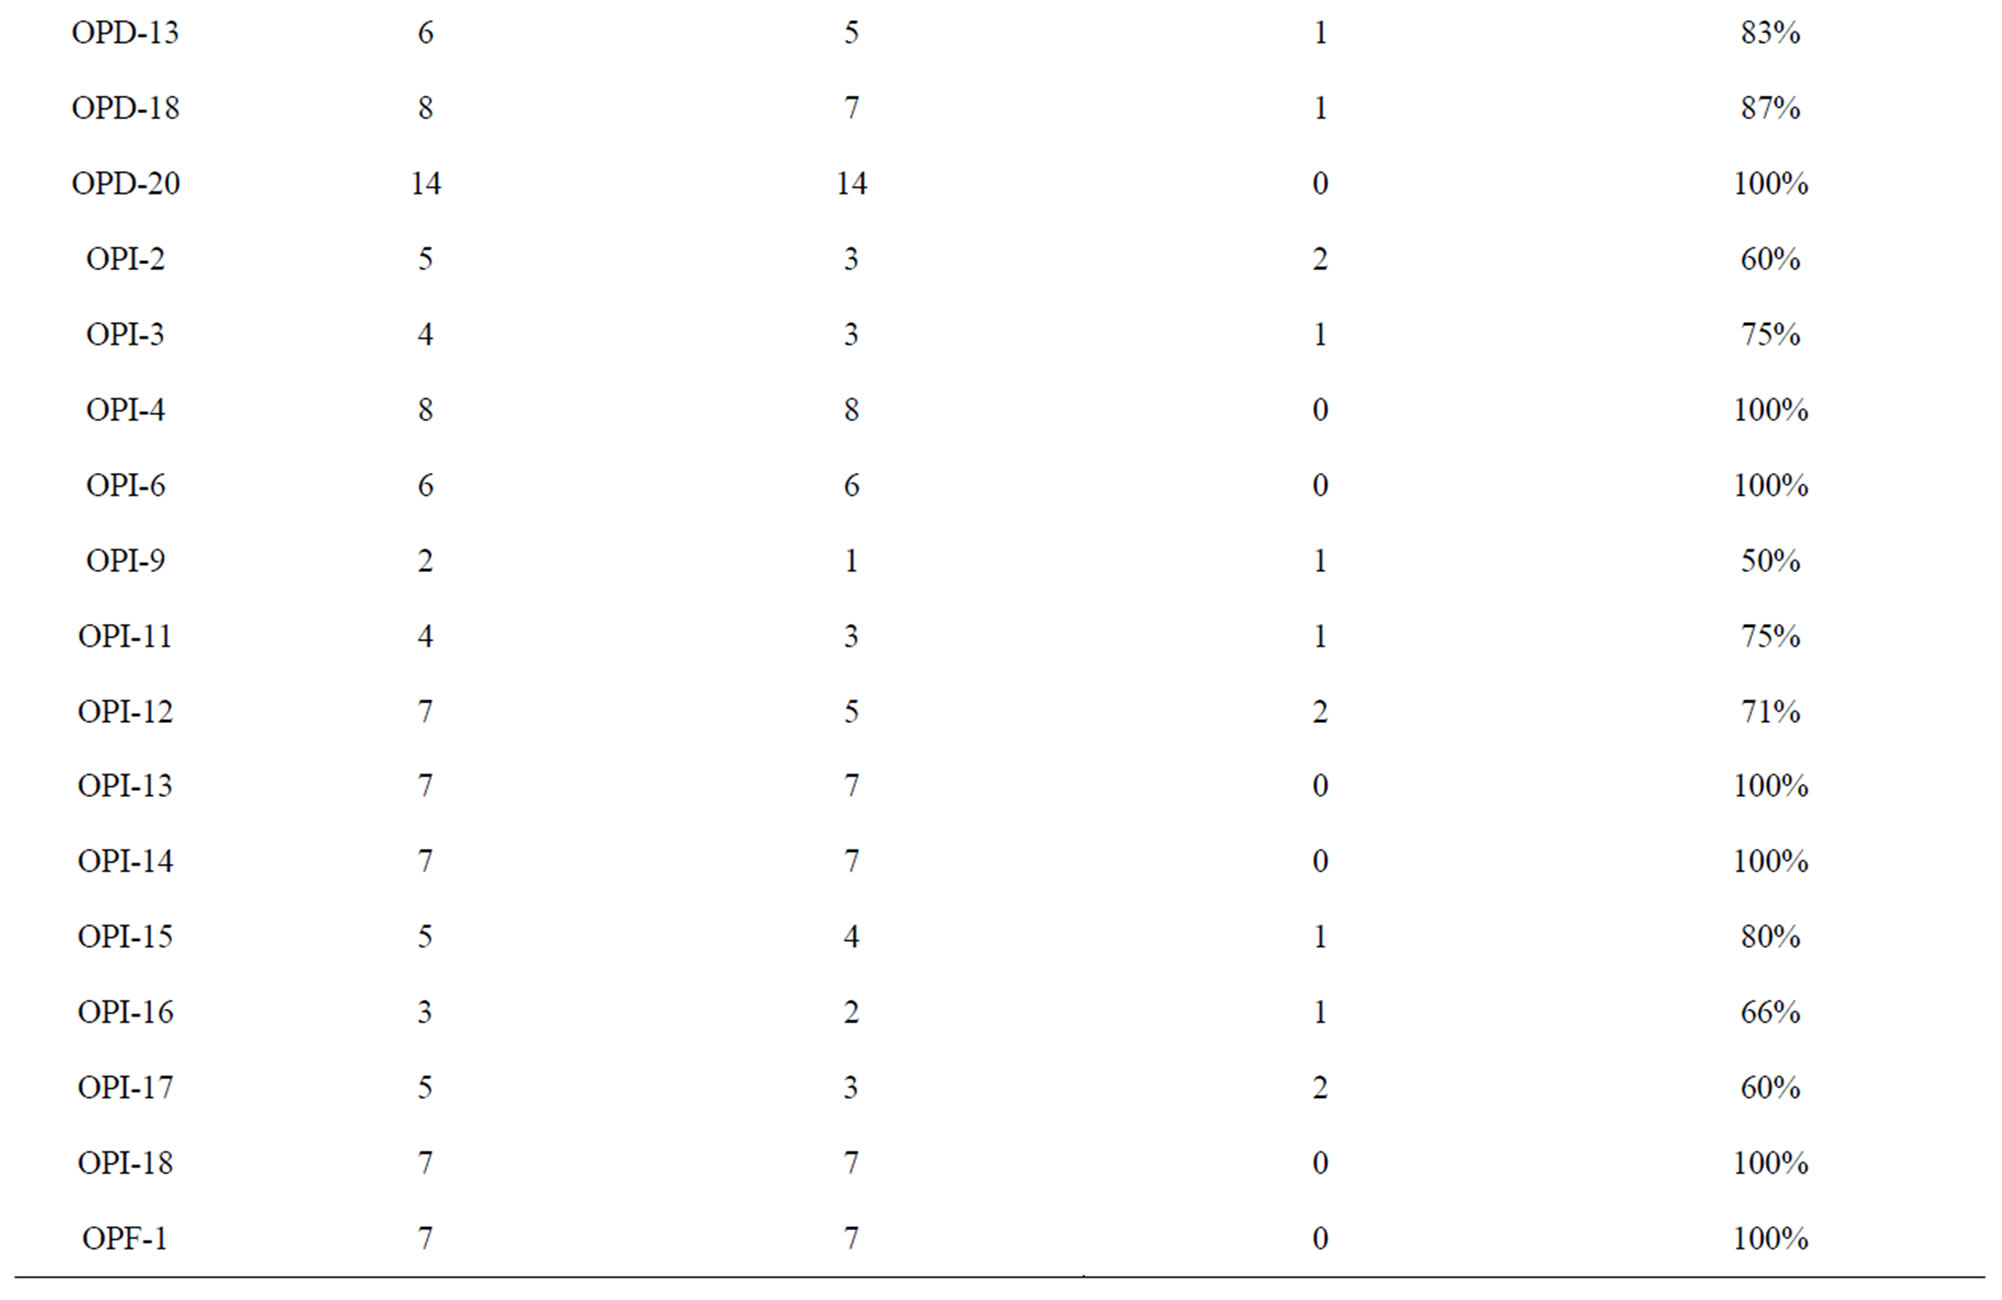
Table 2. Amplification profiles of the RAPD markers on mungbean genotypes.

Figure 1. RAPD profile of 24 mungbean varieties using RAPD markers. (a) OPD 7; (b) OPD 15. Lanes M1: Marker DNA, 1 kb ladder. Lane M2 100 bp ladder: Marker DNA, Lanes 1 - 24: Different varieties of mungbean. 1: BDYR2, 2: K851, 3: PM4, 4: Pusa105, 5: MUM2, 6: Pusa Vishal, 7: ML729, 8: Pusa 9972, 9: ML 843, 10: ML 682, 11: NM1, 12: IPM 02-03, 13: Pant Mung2, 14: Pant Mung3, 15: Ganga 8, 16: PDM11, 17: Pratap, 18: TAP7, 19: Asha, 20: GM 3, 21: SML134, 22: TARM1, 23: ML5, 24: AKM 8803.

Figure 2. Dendrogram derived from UPGMA cluster analysis showing genetic relationship among Indian mungbean cultivars based on random amplified polymorphic DNA markers.
All the 224 polymorphic fragments scored were used for genetic diversity analysis. Jaccard’s similarity coefficients were calculated to assess the genetic resemblances among the cultivars and the similarity coefficient matrix was used for UPGMA cluster analysis. The cluster analysis totally separated 24 cultivars in only two distinct groups. All the genotypes grouped in cluster I are popular cultivars showing greater adaptability as most of these cultivars are grown in more than one mungbean growing states of the country. IPM 02-3, Ganga 8 and BDYR 2 formed one sub-cluster which can be characterized for stable resistance against MYMV disease. Moreover, BDYR 2, a resistant donor of this disease is one of the ancestors in development of IPM 02-3. IPM 02-3, because of durable resistance is becoming popular in different states and in different growing seasons. In sub-group ID, five cultivars (Pusa 105, Pusa Vishal, ML-729, NM-1 and ML-682) were grouped together which are very diverse, as these belong to different origin, adaptability and maturity duration. However, all these were characterized with large seed size and formed a group together. Pant Mung 2 and PDM 11, both are characterized by shining seeds and formed a subgroup IE. K851, Pant M4 and MUM-2 which together formed subgroup IC shared common ancestors in their pedigree. Cultivars, GM 3, TRAM 1, ML 5 and SML 134 grouped in cluster II, were distinct from cultivars grouped in cluster I. These cultivars were characterized for small seed size, resistant to MYMV, with medium maturity and suitable for kharif cultivation. Thus, RAPD analysis proved to be applicable for genotyping, genetic diversity and relatedness evaluation. The analysis revealed narrow genetic base among cultivars used in the study.
The narrow genetic base of commercial cultivars of mungbean observed in this study is in conformity with other reports [10,11], emphasizing the need to broaden genetic variation by utilization of diverse germplasm collections. Wild relatives, exotics and mutant lines appeared to be good sources for genetic variation. Prebreeding or genetic enhancement needs emphasis for the transfer or introgression of genes and gene combinations from unadapted sources into more useable breeding material.
REFERENCES
- S. Gupta, S. Kumar and B. B. Singh, “Relative Genetic Contributions of Ancestral Lines of Indian Mungbean Cultivars Based on Coefficient of Parentage Analysis,” Indian Society of Genetics and Plant Breeding, Vol. 64, 2004, pp. 299-302.
- F. Ahmad, “Random Amplified Polymorphic DNA Analysis Reveals Genetic Relationship among Annual Cicer Species,” Theoretical and Applied Genetics, Vol. 98, No. 3-4, 1999, pp. 657-663. doi:10.1007/s001220051117
- G. Sonnate, A. Marangi, G. Venora and D. Pignone, “Using RAPD Markers to Investigate Genetic Variation in Chickpea,” Journal of Genetics and Breeding, Vol. 51, 1997, pp. 303-307.
- P. Skrotch and J. Nienhuis, “Qualitative and Quantitative Characterization of RAPD Variation among Snap Bean Phaseolus lanatus L. Genotypes,” Theoretical and Applied Genetics, Vol. 91, 1995, pp. 1086-1091.
- M. Z. Galván, M. B. Aulicino, S. Garcia-Medina and P. A. Balatti, “Genetic Diversity among Northwestern Argentinian Cultivars of Common Bean (Phaseolus vulgaris L.) as Revealed by RAPD Markers,” Genetic Resources and Crop Evolution, Vol. 48, No. 3, 2001, pp. 251-260. doi:10.1023/A:1011264009315
- D. Simioniuc, R. Uptmoor, W. Friedt and F. Ordon, “Genetic Diversity and Relationships among Pea Cultivars Revealed by RAPDs and AFLPs,” Plant Breeding, Vol. 121, No. 5, 2002, pp. 429-435. doi:10.1046/j.1439-0523.2002.733320.x
- M. B. Ratnaparkhe, V. S. Gupta, M. R. Ven Murthy and P. K. Ranjekar, “Genetic Fingerprinting of Pigeon Cajanus cajan (L.) Millsp and Its Wild Relatives Using RAPD Markers,” Theoretical and Applied Genetics, Vol. 91, No. 6-7, 1995, pp. 893-898. doi:10.1007/BF00223897
- H. D. Mignouna, N. Q. Ng, J. Ikca and G. Thottapilly, “Genetic Diversity in Cowpea as Revealed by Random Amplified Polymorphic DNA,” Journal of Genetics and Breeding, Vol. 52, 1998, pp. 151-159.
- Z. Li, L. Qiu, J. A. Thompson, M. M. Welsh and R. L. Nelson, “Molecular Genetic Analysis of U.S. and Chinese Soybean Ancestral Lines,” Crop Science, Vol. 41, No. 4, 2001, pp. 1330-1336. doi:10.2135/cropsci2001.4141330x
- M. Santalla, J. B. Pawar and M. R. Davey, “Genetic Diversity in Mungbean Germplasm Revealed by RAPD Markers,” Plant Breeding, Vol. 117, No. 5, 1998, pp. 473-478. doi:10.1111/j.1439-0523.1998.tb01976.x
- S. Lakhanpaul, S. Chadha and K. V. Bhat, “Random Amplified Polymorphic DNA (RAPD) Analysis in Indian Mung Bean (Vigna radiata (L.) Wilczek) Cultivars,” Genetica, Vol. 109, No. 3, 2000, pp. 227-234. doi:10.1023/A:1017511918528
- K. V. Bhat, S. Lakhanpal and S. Chadha, “Amplified Fragment Length Polymorphism (AFLP) Analysis of Genetic Diversity in Indian Mungbean [Vigna radiata (L.) Wilczek] Cultivars,” Indian Journal of Biotechnology, Vol. 4, 2005, pp. 56-64.
- S. Singh, “DNA Markers in Mungbean,” Ph.D. Thesis, University of Mumbai, Mumbai, 2003.
- R. V. Abdelnoor, E. G. Barros and M. A. Moreira, “Determination of Genetic Diversity within Brazilian Soybean Germplasm Using Random Amplified Polymorphic DNA Techniques and Comparative Analysis with Pedigree Data,” Brazilian Journal of Genetics, Vol. 18, 1995, pp. 265-273.
- J. M. Deragon and B. S. Ladry, “RAPD and Other PCRBased Analysis of Plant Genome Using DNA Extracted from Small Leaf Disks,” PCR Methods and Applications, Vol. 1, 1992, pp. 175-180.
- F. J. Rohlf, “NTSYS-PC Numerical Taxonomy and Multivariate Analysis System Version 2.1,” Exeter Software, Applied Biostatistics, New York, 1998.
- P. Jaccard, “Nouvelles Recherches sur La Distribution Florale,” Bulletin de la Société Vaudoise des Sciences Naturelles, Vol. 44, 1908, pp. 223-270.
- I. V. Yap and R. J. Nelson, “WINBOOT: A Program for Performing Bootstrap Analysis of Binary Data to Determine the Confidence Limits of UPGMA-Based Dendrograms,” International Rice Research Institute, Manila, 1996, pp. 1-22.
- J. G. K. Williams, A. R. Kubelik, K. J. Livak, J. A. Rafalski and S. V. Tingey, “DNA Polymorphisms by Arbitrary Primers Are Useful as Genetic Markers,” Nucleic Acids Research, Vol. 18, No. 22, 1990, pp. 6531-6535. doi:10.1093/nar/18.22.6531
- A. N. Kaga, N. Tomooka, Y. Egawa, K. Hosaka and O. Kamijima, “Species Relationships in Subgenus Ceratotropis (Genus Vigna) as Revealed by RAPD Analysis,” Euphytica, Vol. 88, No. 1, 1996, pp. 17-24. doi:10.1007/BF00029261
NOTES
*Corresponding author.