Open Journal of Applied Sciences
Vol.4 No.6(2014), Article ID:46087,9 pages DOI:10.4236/ojapps.2014.46034
Bitumen Removal Determination on Asphalt Pavement Using Digital Imaging Processing and Spectral Analysis
Alessandro Mei, Ciro Manzo, Cristiana Bassani, Rosamaria Salvatori, Alessia Allegrini
Institute of Atmospheric Pollution Research, National Research Council (CNR), Monterotondo, Italy
Email: mei@iia.cnr.it, c.manzo@iia.cnr.it
Copyright © 2014 by authors and Scientific Research Publishing Inc.
This work is licensed under the Creative Commons Attribution International License (CC BY).
http://creativecommons.org/licenses/by/4.0/


Received 3 April 2014; revised 9 May 2014; accepted 16 May 2014
ABSTRACT
This research aims to define an efficient and fast quantification of bitumen removal on the road surface by Digital Imaging Processing (DIP) and spectral analysis. The retrieval of bitumen removal is an important issue for road management and environmental studies related to asphalt wear and environmental pollution. The calculation of the Exposed Aggregate Index (EAI), based on DIP, allows to quantify in each frame the superficial removal of bitumen and the exposure of aggregates. A procedure, based on non-parametric classification process of digital images, gives a fast response of EAI. A correlation among EAI and spectral data, between 390 nm and 900 nm range, is evaluated. Results show a good correlation between spectral data at different wavelength and EAI. Finally, this work evaluates the possibility to retrieve asphalt bitumen removal through remote sensed imagery.
Keywords:Exposed Aggregate Index, Asphalt, Bitumen, Digital Imaging Processing, Spectral Signatures, Remote Sensing

1. Introduction
Asphalt spectral analysis and image classification can provide wide information to support local authorities for urban planning and environmental monitoring [1] [2] . In asphalted roads, aggregate compounds cause the increase of reflectance while the bitumen absorbs main part of solar incident radiation. Vehicle transit and natural worsening of bitumen may cause changes on surface composition and aggregate reorganization [3] and can have a significant impact on the mechanical behavior of asphalt [4] . These changes can also affect the capacity of stone fraction to absorb pollutants such as metal ions, which are transported by particles produced by wear of road surfaces [5] . In visible range (VIS), the loss of bitumen on asphalt surface shows a slope change of spectral signatures [6] -[8] while weathering processes are evident by iron oxide absorption peaks at 520 nm, 670 nm and 870 nm [9] .
Nowadays research aims to define new road pavement management systems in a way to identify relationship between spectral index and physical data like Structure Index (SI) or Pavement Condition Index (PCI). [10] finds a spectral index, VIS2-difference, that is calculate by R830 - R490, where, R830 is the reflectance at 830 nm and R490 at 490 nm. A linear relation between VIS2-difference and (i) PCI (R2 = 0.63) and (ii) SI (R2 = 0.55) is established.
Several researches focus the attention on bitumen removal as a parameter that contributes on asphalt spectral classification. [7] [11] associate bitumen removal to spectral correlation between 460 nm and 740 nm reflectance values from field and remote sensed data. A superficial bitumen retrieval is achieved in the last two works but it is never assessed quantitatively; removal processes are related to bitumen percentage loss over aggregates and its estimation is performed by Shvetsov’s classification (1954) [12] . This operation allows to aiding the visual estimation of trace and accessory constituents during sedimentological microscopic analysis. This classification technique highlights the lack to retrieve a real quantification of the percentage of superficial removal of bitumen for each target keeping this evaluation to the user subjectivity.
Digital Imaging Processing (DIP) techniques can help to overcome this issue. The interest of this kind of application is due to the influence of heterogeneous asphalt mixtures to mechanical properties and internal structure characterization. Pictures can be used to retrieve parameters related to: road macro-texture by road surface modeling for binder/aggregate ratio [13] [14] , grading curve retrieval by digital imaging segmentation [15] , aggregates characterization [16] and hyperspectral imaging [17] . Road condition is also evaluated using a fullyautomatic method to detect cracks from pavement images [18] . These different kinds of applications show that use of digital camera is an useful tool to define both superficial physical (such as shape and size) and mechanical characteristics.
Considering that new asphalt brightness is lower than oldest ones, spoliation effects can be linked to colorimetric variation in visible range. Study of Red (680 nm), Green (526 nm) and Blue (423 nm) values of pictures may provide this information in an objective and quantitative way. As shown in [19] , spectral response of asphalts and classification of RGB pictures allow to finding an empirical equation (ICNR) to retrieve a spectral index for superficial bitumen removal quantification. This retrieval is computed by the use of the Exposed Aggregate Index (EAI).
This paper focuses the process to retrieve the EAI by digital imaging processing (DIP). Pictures are used to perform a standardize retrieval process which allows to reduce user subjectivity in bitumen removal quantification. This is achieved by the use of non-parametric classification for superficial bitumen removal quantification. EAI is finally compared with spectral data acquired during the field survey, taking also into account spectral indices already adopted in bibliography to characterize physical and chemical properties of asphalt. Due to newest high resolution satellites and airborne devices for synoptic analysis of road condition [20] , a preliminary evaluation of EAI retrieval by remote sensing imagery is suggested for further analysis.
2. Studied Area
For this work a data set of 200 digital asphalt images, with respective spectral signatures, is adopted. These data are acquired during field surveys in Campania Department (Italy) relevant to the National Operative Program (PON) 2007-2013/(“Security for the Development of Southern Italy” mission).
3. Materials and Methods
Different kinds of asphalts without relevant damages have been taking into account for this paper. Pictures are captured using a digital camera with a 35 mm focal length and a sensor of 10.7 Megapixels. Every picture has been acquired with a graduated calibration ruler (dimensions 40 cm × 40 cm) located always in the same relative position (Figure 1). This reference ruler has black and white stripes (width of 5 cm) that allows a field pre-calibration for each image. For every target a spectral measurement is carried out using a hyperspectral portable device (Fieldspec 3—A.S.D.) which measures radiance (W·sr−1·m−2) in a range of 350 nm to 2500 nm (Instant Field Of View—IFOV of 25˚). The instrument is composed by three detectors spanning the visible and
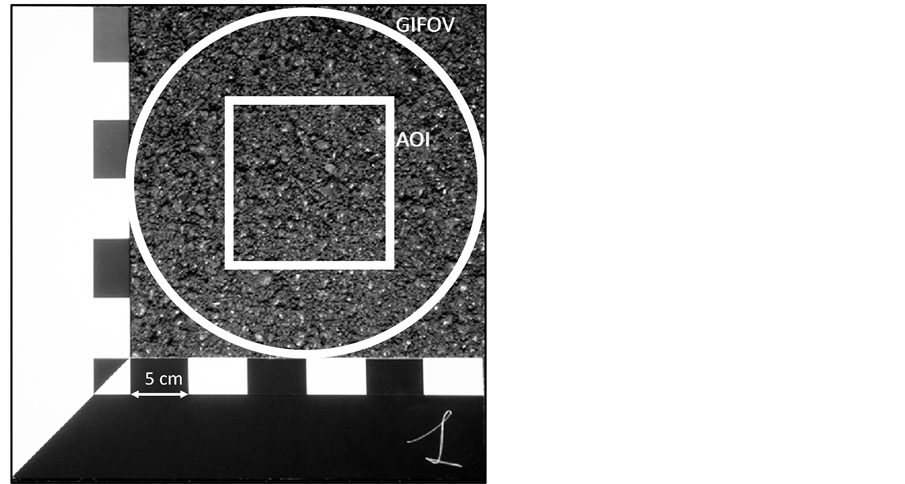
Figure 1. Scheme of target acquisition and reference ruler (every mark is 5 cm). The circle represent spectroradiometer footprint (GIFOV), the square represent the Area of Interest (AOI) adopted for classification.
near-infrared (VNIR) and short-wave infrared region of spectrum (SWIR1 and SWIR2) with a spectral sampling interval of 1.4 nm for the VNIR and 2 nm for the SWIR detectors.
A spectralon panel (high-density fluoropolymer), assumed as Lambertian surface, is used as white reference to retrieve target reflectance.
The vertical distance of tripod to targets is defined considering the inner area of the ruler (1600 cm2). The spectrometer Ground Instant Field of View (GIFOV) has a radius of 15 cm. Camera and pistol grip (optical fiber) are fixed on a tripod at 68 cm from targets. The Area of Interest (AOI) is made by a square which is into the GIFOV of spectroradiometer with dimension of 15 cm × 15 cm corresponding to a total of 565423 pixels.
3.1. Image Pre-Processing
Considering that pictures were acquired in different times of the day and, consequently, with different solar illumination conditions, a picture normalization has to be performed. This normalization process is computed by mean white bands of ruler reference of each picture. This procedure is widely adopted to calibrate field spectral data by white reference which represents the local radiance during measurements (e.g. ASD).
All images are co-registered adopting corners of ruler with an RMSE of 0.09 cm. A batch process allows to performing this operation, indeed iteratively each channel of picture (Red-Green-Blue) is normalized per its own white part of ruler.
3.2. Exposed Aggregate Index and Spectral Analysis
On asphalt surface the outcropping of aggregate fragments is due to time and degradation processes that cause the bitumen removal and the increase of reflectance values [21] . These events also cause the appearance of absorption bands in the spectrum related to mineralogical characteristics of aggregates. Consequently, paved surface spoliation is closely related to spectral data and colorimetric changes.
As seen before, DIP is an efficient technique for several purposes to establish, through image segmentation, asphalt mixtures properties. At the same time, images can be processed to provide statistical analysis of RGB values by using supervised classifications for automatic visual inspection [22] . In the image dataset, due to tires erosion of superficial bitumen, bright colors can be related to “old” asphalt with aggregate exposition versus dark colors for newest surfaces with an high superficial bitumen presence. From each image, Region of Interest (ROI) of aggregates, bitumen and shadow were selected. Separability analysis of these classes allows to defining threshold values in the RGB feature space. For this purpose the Jeffries-Matusita (J-M) distance and the Transformed Divergence (TD) are adopted. These statistics are ranged from 0 to 2.0 and, as a general rule, the separability between two classes is considered high when values are greater than 1.9. Two classes are considered to be very poorly separated when the J-M distance is below 1.0 [23] .
A supervised classification is performed to quantify aggregate presence in the Area of Interest (AOI). Finally, to perform an index for bitumen removal identification, the Exposed Aggregate Index (EAI) is obtained by equation [19] :
 (1)
(1)
where, Ip is the number of pixels corresponding to aggregates exposed on the asphalt surface which causes the appearance of spectral characteristics of outcropping aggregate fragments; Tp correspond to the AOI area expressed as number of pixels. Therefore, EAI classes can be related to the superficial bitumen percentage (BIT) over aggregates as: BIT = 100% − EAI (%). In [19] , different equations evaluate the relationship between EAI and spectral response. From those examined, ICNR exponential spectral index (Equation (2)) shows higher statistical correlation (rp = 0.83).
 (2)
(2)
In [10] , VIS2-difference spectral index is calculated by reflectance value at 830 nm minus reflectance at 490 nm. In [21] , this index was used to retrieve asphalt deterioration/aging by Pavement Condition Index and Structure Index (SI). IMEI uses wavelengths already identified in [7] and applied in [24] for asphalt differentiation using different sensors. This index is calculated by the difference of reflectance values at 740 nm minus reflectance at 460 nm.
The relationship between the Exposed Aggregate Index and spectral data is evaluated using ICNR index and other spectral indices already used in bibliography such as VIS2-diff, IMEI (which use two wavelengths) and first derivative at 400 nm. Our attention is focused on visible-near infrared (VNIR) spectral range and in particular at 460 nm, 490 nm, 740 nm, 830 nm to retrieve which wavelengths are more sensitive to bitumen removal. First derivative at 400 nm is also computed. Figure 2 shows the work flow of this paper.
The definition of a correlation between the Exposed Aggregate Index and spectral indices will allow to evaluating its application and extension using remote sensed imagery surveys.
In Figure 3 are reported 5 examples of targets classified with different amount of exposed aggregate and the associated spectral signatures: a) 0% < EAI < 10%, b) 10% < EAI < 20%, c) 20% < EAI < 30%, d) 30% < EAI < 40% and e) EAI > 40%. It is evident that low values of EAI correspond on high presence of superficial bitumen which shows low removal process. Results of this computation show the increasing of reflectance values in VIS region with the increasing of EAI.
EAI classes can be referred to the superficial bitumen percentage (BIT) over aggregates such as: a) 90% < BIT < 100%, b) 80% < BIT < 90%, c) 70% < BIT < 80%, d) 60% < BIT < 70% and e) BIT < 60%.
4. Results and Discussion
For each picture Region of Interest (ROI) are defined for bitumen, aggregates and shadow. Transformed Divergence and Jeffries-Matusita ROI analysis shows values greater than 1.9 that indicate a good statistical separability between such classes. In order to retrieve the EAI, a batch procedure is implemented to elaborate each raw picture.
To retrieve EAI, a non-parametric classification procedure (parallelepiped method) of RGB stacked images is used. This allows to defining the number of pixel corresponding to exposed aggregates related to the total number of pixel in the AOI.
To validate those results, an accuracy assessment is carried out using validation ROI as recommended by [25] . This analysis takes into account about 100 reference points per image distributed around the AOI according to a random sampling grid. By the use of the confusion matrix an averaged overall accuracy of 0.91 and a kappa statistic of 0.81 are calculated on classified images. These values confirm the good quality of the adopted procedure. Table 1 show an example of classification results of an image with high EAI value and one with low value of EAI.
Figure 2. Work flow.
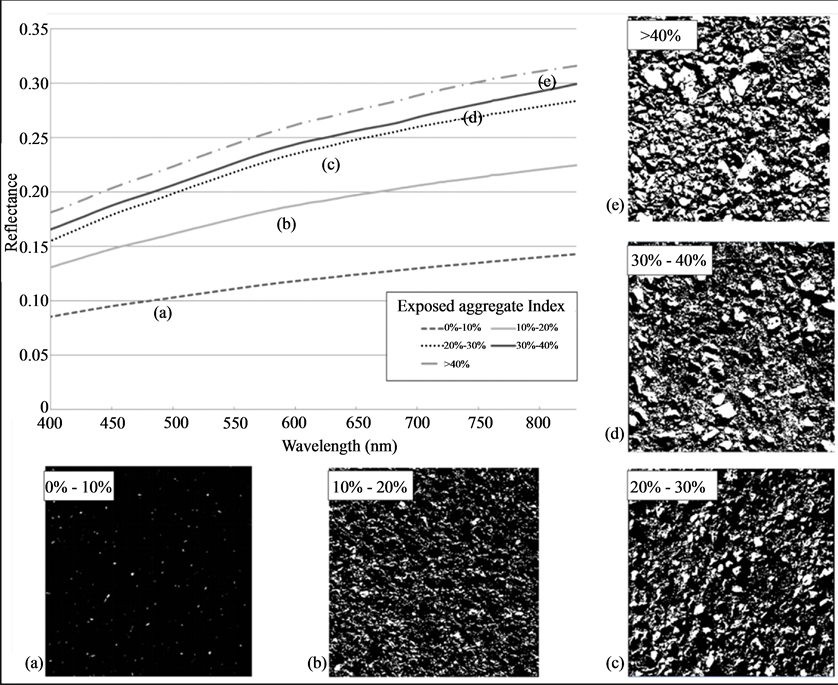
Figure 3. Reflectance of 5 asphalt signatures with different level of EAI (from (a) to (e) increase of index).

Table 1. Correlation values of EAI.
ICNR, VIS2-difference, IMEI indices and the first derivative of spectrum at 400 nm are performed in order to test different spectral indices and to provide the best empirical correlation with EAI. Results show that Pearson’s correlation (rp) values of each pair of variables are generally high. In particular VIS2-difference show an rp of 0.78, IMEI an rp of 0.80 and first derivative at 400 nm an rp of 0.69. As seen above ICNR present an rp of 0.83. The correlation between the EAI and spectral indices with wavelength corresponding to 460 nm, 490 nm, 740 nm, 830 nm shows a great correlation among picture classification and in situ spectral measurements. At the opposite, First derivative at 400 nm doesn’t show great correlations values with EAI.
Results show that an increase of aggregating exposure enhances the difference of spectra among 830 and 460 nm so that the higher this difference the higher the EAI. Then, results suggest that EAI is strongly linked to spectral signatures of asphalt surface.
Highest correlation values of ICNR to EAI indicate that this index is suitable to retrieve removal bitumen level by remote sensed image. Considering that it uses four wavelengths (460, 490, 740 and 830 nm), we can find its application to airborne hyperspectral imagery such as Multispectral Infrared and Visible Imaging Spectrometer (MIVIS), Airborne Visible/Infrared Imaging Spectrometer (AVIRIS) or Compact Airborne Spectrographic Imager (CASI). MIVIS is an instrument consisting of 4 spectrometers. These spectrometers simultaneously measure the radiation in the visible (20 bands between 430 and 830 nm), near (8 bands between 1150 and 1550 nm), medium (64 bands between 2000 and 2500 nm) and the thermal infrareds (10 bands between 8200 and 12700 nm) for a totality of 102 bands. The AVIRIS instrument contains 224 different detectors with a spectral bandwidth of approximately 10 nm, and covers the range between 380 nm and 2500 nm. While CASI-1500 sensor covers a lower spectral range, from 380 to 1050 nm, their 288 bands allow to identifying bands needed for ICNR computation. Considering the target spatial dimensions and the need of four wavelengths, ICNR can be well exploit by the use of high spectral and spatial resolution imagery such as hyperspectral airborne sensors.
To enlarge the possibility to retrieve EAI also on sensors with a lower spectral range, Quickbird and Worldview-2 multispectral satellite data are considered. These sensors show a good correlation between their spectral bands and the wavelengths used in both 2-bands spectral indices. Their spatial resolution is similar to that obtained from airborne sensors and, then, is enough for EAI retrieval by the use of VIS2-dif and IMEI. At the opposite, due to low spectral resolution of multispectral imagery, ICNR computation seems to be not feasible for this kind of satellite sensors. Table 2 shows the correlation between wavelengths used to calculate mentioned spectral indices and different sensors bands.
Through the integration of all VIS spectrum (450 nm to 680 nm) it is possible to analyze the total energy reflected by asphalt surface. As seen before the increase of aggregates outcropping causes an increase of reflectance values and brightness. We fit a logarithmic function to the plot of integrated reflectance versus EAI and found a good correlation (R2 = 0.75) (Figure 4). This figure put on evidence the higher variation of reflectance for first EAI classes (such as a and b) versus low variations for last EAI classes (such as d and e).
By the use of this logarithmic function, panchromatic images can be also used to retrieve EAI. Their high spatial resolution, 50 cm for Worldview and 60 cm for Quickbird, could improve its retrieval also using pan-sharpening technique.
Table 2. Band correlation with remote sensed imagery.
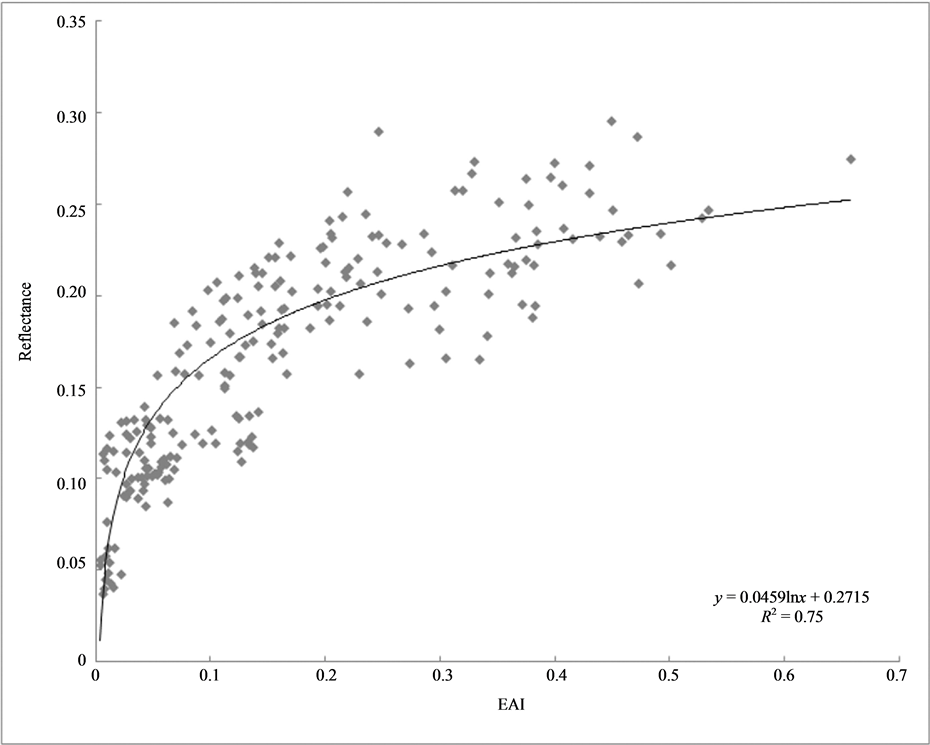
Figure 4. Scatter plot of integrated reflectance values in the visible range (440 - 680 nm) vs EAI.
5. Conclusions
The proposed methodology, based on pattern recognition techniques, allow to producing repeatable measurements to assess the amount of bitumen removed on asphalt surface and allow to quantifying the aggregate exposure to the atmosphere. This can be achieved by the calculation of Exposed Aggregate Index and by performing a correlation with spectral data. While values of the first derivative at 400 nm don’t show great correlations values with EAI, VIS2-difference and IMEI seems to be adequate to retrieve superficial bitumen removal also by the use of both hyperspectral and multispectral data. Due to the need of four different bands, ICNR can be efficiently taken into account only with high spectral and spatial resolution such as MIVIS.
This paper shows how the Exposure Aggregate Index computation can be considered as a link between remote sensing and field analysis and, therefore, can be used to improve studies related to civil engineering. In addition, EAI presents another potential use in environmental studies through the estimation of asphalt wear products contribution (bitumen and available particles derived from aggregate crumbling) to the contamination of different matrices such as air and soil.
Further research will be focused on the calculation of EAI through remote sensed data and, also, through samples laboratory analysis in order to obtain a spectral library associated with physical data.
Acknowledgements
The authors wish to thank “Arma dei Carabinieri” which authorized the use of data acquired during our activities relating to “Security for the Development of Southern Italy” mission as a part of the National Operative Program (PON) 2007-2013 funded by the European Union (EU) and Italian Ministry of Interior (contract No. 9904 10/07/2009).
References
- Andreou, C., Karathanassi, V. and Kolokoussis P. (2011) Investigation of Hyperspectral Remote Sensing for Mapping Asphalt Road Conditions. International Journal of Remote Sensing, 32, 6315-6333. http://dx.doi.org/10.1080/01431161.2010.508799
- Villa, P., Boschetti, M., Bianchini, F. and Cella, F. (2012) A Hybrid Approach for Remote Sensing Multi-Temporal Mapping of Urban Areas in Milan Province, Italy. European Journal of Remote Sensing, 45, 333-347. http://dx.doi.org/10.5721/EuJRS20124529
- Bell, C.A. (1989) Summary Report on the Aging of Asphalt-Aggregate Systems. Strategic Highway Research Program (SHRP) Publications SHRP-A-305, 100 p. http://onlinepubs.trb.org/onlinepubs/shrp/SHRP-A-305.pdf
- Saoula, S., Soudani, K., Haddadi, S., Munoz, M. and Santamaria, A. (2013) Analysis of the Rheological Behavior of Aging Bitumen and Predicting the Risk of Permanent Deformation of Asphalt. Materials Sciences and Applications, 4, 312-318. http://dx.doi.org/10.4236/msa.2013.45040
- Lindgren, A. (1996) Asphalt Wear and Pollution Transport. The Science of the Total Environment, 189-190, 281-286. http://dx.doi.org/10.1016/0048-9697(96)05220-5
- Noronha, V., Herold, M., Gardner, M. and Roberts, D.A. (2002) Spectrometry and Hyperspectral Remote Sensing for Road Centerline Extraction and Evaluation of Pavement Condition. Proceedings of the Pecora Conference, Denver, CO. http://www.geogr.uni-jena.de/~c5hema/spec/Pecora_noronha_herold_final.pdf
- Mei, A., Salvatori, R. and Allegrini, A. (2011) Analysis of Paved Areas with Field Data and MIVIS Hyperspectral Images. Italian Journal of Remote Sensing, 43, 147-159. http://dx.doi.org/10.5721/ItJRS201143212
- Mei, A., Fiore, N., Salvatori, R., D’Andrea, A. and Fontana, M. (2012) Spectroradiometric Laboratory Measures on Asphalt Concrete: Preliminary Results. Procedia-Social and Behavioral Sciences, 53, 514-523.
- Herold, M., Roberts, D.A., Gardner, M. and Dennison, P. (2004) Spectrometry for Urban Area Remote Sensing-Development and Analysis of a Spectral Library from 350 to 2400 nm. Remote Sensing Environment, 91, 304-319. http://dx.doi.org/10.1016/j.rse.2004.02.013
- Herold, M. and Roberts, D. (2005) Spectral Characteristics of Asphalt Road Aging and Deterioration: Implications for Remote-Sensing Applications. Applied Optics, 44, 4327-4334. http://dx.doi.org/10.1364/AO.44.004327
- Mei, A. and Salvatori, R. (2013) Urban Mapping Using Ikonos Imagery. International Journal of Remote Sensing & Geoscience, 2, 55-58.
- Shvetsov, M. (1954) Concerning Some Additional Aids in Studying Sedimentary Formations. Bulletin Moscow Society Naturalists (Pub. Moscow Univ. Geol. Sect.), 29, 61-66.
- Elunai, R., Chandran, V. and Gallagher, E. (2011) Asphalt Concrete Surfaces Macrotexture Determination from Still Images. IEEE Transactions on Intelligent Transportation Systems, 12, 857-869. http://dx.doi.org/10.1109/TITS.2011.2116784
- Bruno, L., Parla, G. and Celauro, C. (2012) Image Analysis for Detecting Aggregate Gradation in Asphalt Mixture from Planar Images. Construction and Building Materials, 28, 21-30. http://dx.doi.org/10.1016/j.conbuildmat.2011.08.007
- Marinoni, N., Pavese, A., Foi, M. and Trombino, L. (2005) Characterization of Mortar Morphology in Thin Sections by Digital Image Processing. Cement and Concrete Research, 35, 1613-1619. http://dx.doi.org/10.1016/j.cemconres.2004.09.015
- Bessa, I.S., Castelo Branco, V.T.F. and Soares, J.B. (2012) Evaluation of Different Digital Image Processing Software for Aggregates and Hot Mix Asphalt Characterizations. Construction and Building Materials, 37, 370-378. http://dx.doi.org/10.1016/j.conbuildmat.2012.07.051
- Priego, B., Souto, D., Bellas, F. and Duro, R.J. (2013) Hyperspectral Image Segmentation through Evolved Cellular Automata. Pattern Recognition Letters, 34, 1648-1658. http://dx.doi.org/10.1016/j.patrec.2013.03.033
- Zou, Q., Cao, Y., Li, Q., Mao, Q. and Wang S. (2012). CrackTree: Automatic Crack Detection from Pavement Images. Pattern Recognition Letters, 33, 227-238. http://dx.doi.org/10.1016/j.patrec.2011.11.004
- Manzo, C., Mei, A., Salvatori, R., Bassani, C. and Allegrini, A. (2014) Spectral Modeling for Retrieval of Aggregates Index of Asphalted Surfaces and Sensitivity Analysis. Building and Construction Materials, 61, 147-155. http://dx.doi.org/10.1016/j.conbuildmat.2014.02.056
- Skoglar, P., Orguner, U., Tornqvist, D. and Gustafsson, F. (2012) Road Target Search and Tracking with Gimballed Vision Sensor on an Unmanned Aerial Vehicle. Remote Sensing, 4, 2076-2111. http://dx.doi.org/10.3390/rs4072076
- Herold, M., Roberts, D., Noronha, V. and Smadi, O. (2008) Imaging Spectrometry and Asphalt Road Surveys. Transportation Research Part C: Emerging Technologies, 16, 153-166. http://dx.doi.org/10.1016/j.trc.2007.07.001
- Jia, J., (1993) Seed Maize Quality Inspection with Machine Vision. Proceedings SPIE Computer Vision for Industry, 1989, 288-295. http://dx.doi.org/10.1117/12.164872
- Richards, J.A. and Jia, X. (1999) Remote Sensing Digital Image Analysis—An Introduction. 3rd Edition, Springer Verlag, Berlin. http://dx.doi.org/10.1007/978-3-662-03978-6
- Mei, A., Salvatori, R., Fiore, N., Allegrini, A. and D’Andrea, A. (2014) Integration of Field and Laboratory Spectral Data with Multi-Resolution Remote Sensed Imagery for Asphalt Surface Differentiation. Remote Sensing, 6, 2765- 2781. http://dx.doi.org/10.3390/rs6042765
- Congalton, R.G. and Green, K. (1999) Assessing the Accuracy of Remotely Sensed Data: Principles and Practices. Lewis Publishers, Boca Raton.