American Journal of Analytical Chemistry
Vol.3 No.11(2012), Article ID:24931,9 pages DOI:10.4236/ajac.2012.311101
A Comparative Study of the Novel Ratio Difference Method versus Conventional Spectrophotometric Techniques for the Analysis of Binary Mixture with Overlapped Spectra
1Analytical Chemistry Department, Faculty of Pharmacy, Cairo University, Cairo, Egypt
2Analytical Chemistry Department, Faculty of Pharmacy, October University for Modern Sciences and Arts (MSA), 6th October City, Egypt
3Analytical Chemistry Department, Faculty of Pharmacy, Assuit University, Assuit, Egypt
Email: *drsarahsalah@gmail.com
Received September 18, 2012; revised October 20, 2012; accepted October 31, 2012
Keywords: Ratio Difference; Sodium Cromoglicate; Fluorometholone; Binary Mixtures; Spectrophotometry
ABSTRACT
The smart novel ratio difference spectrophotometric method was developed and validated for the determination of a binary mixture of Sodium cromoglicate (SCG) and Fluorometholone (FLU) in presence of benzalkonium chloride without prior separation. The results were compared to that of the conventional methods (dual wavelength and first derivative of ratio spectra). The suggested methods were validated in compliance with the ICH guidelines and were successfully applied for determination of SCG and FLU in their laboratory prepared mixtures and commercial ophthalmic solution. The novel method showed significant advantages over the conventional methods regarding simplicity, minimal data manipulation and maximum reproducibility and robustness; which enabled the analysis of binary mixtures with overlapped spectra for routine quality control testing with quite satisfactory.
1. Introduction
The spectrophotometric based methods have the advantages of being the most simple, fast and applicable in all laboratories, as most of the active compounds show absorbance in the UV region. But usually compounds are present in the form of mixtures through which they exhibit strongly overlapped spectra that impede their simultaneous determination. Different manipulating techniques for absorption such as using different order derivatives [1-3], derivatives of the ratio spectrum [1,2,4], ratio subtraction [5,6], dual wavelength [7,8] and chemometric-assisted techniques [3,4] gave a solution for this problem.
The aim of this work is to develop and conduct a comparative study on the novel ratio difference method and two conventional spectrophotometric methods (dual wavelength and first derivative of ratio spectra) for resolving those mixtures with spectral interfering problems without preliminary separation.
The novel method showed significant advantages over the other methods regarding simplicity, maximum reproducibility and robustness; and minimal data manipulation as it does not require any sophisticated apparatus or computer programs.
The paper deals with the use of smart original mathematical techniques utilizing the constant present in the ratio spectra, and how this could be adapted to resolve spectral overlap of Sodium cromoglicate (SCG) and Fluorometholone (FLU) in their binary mixture in the presence of benzalkonium chloride as a preservative without preliminary separation.
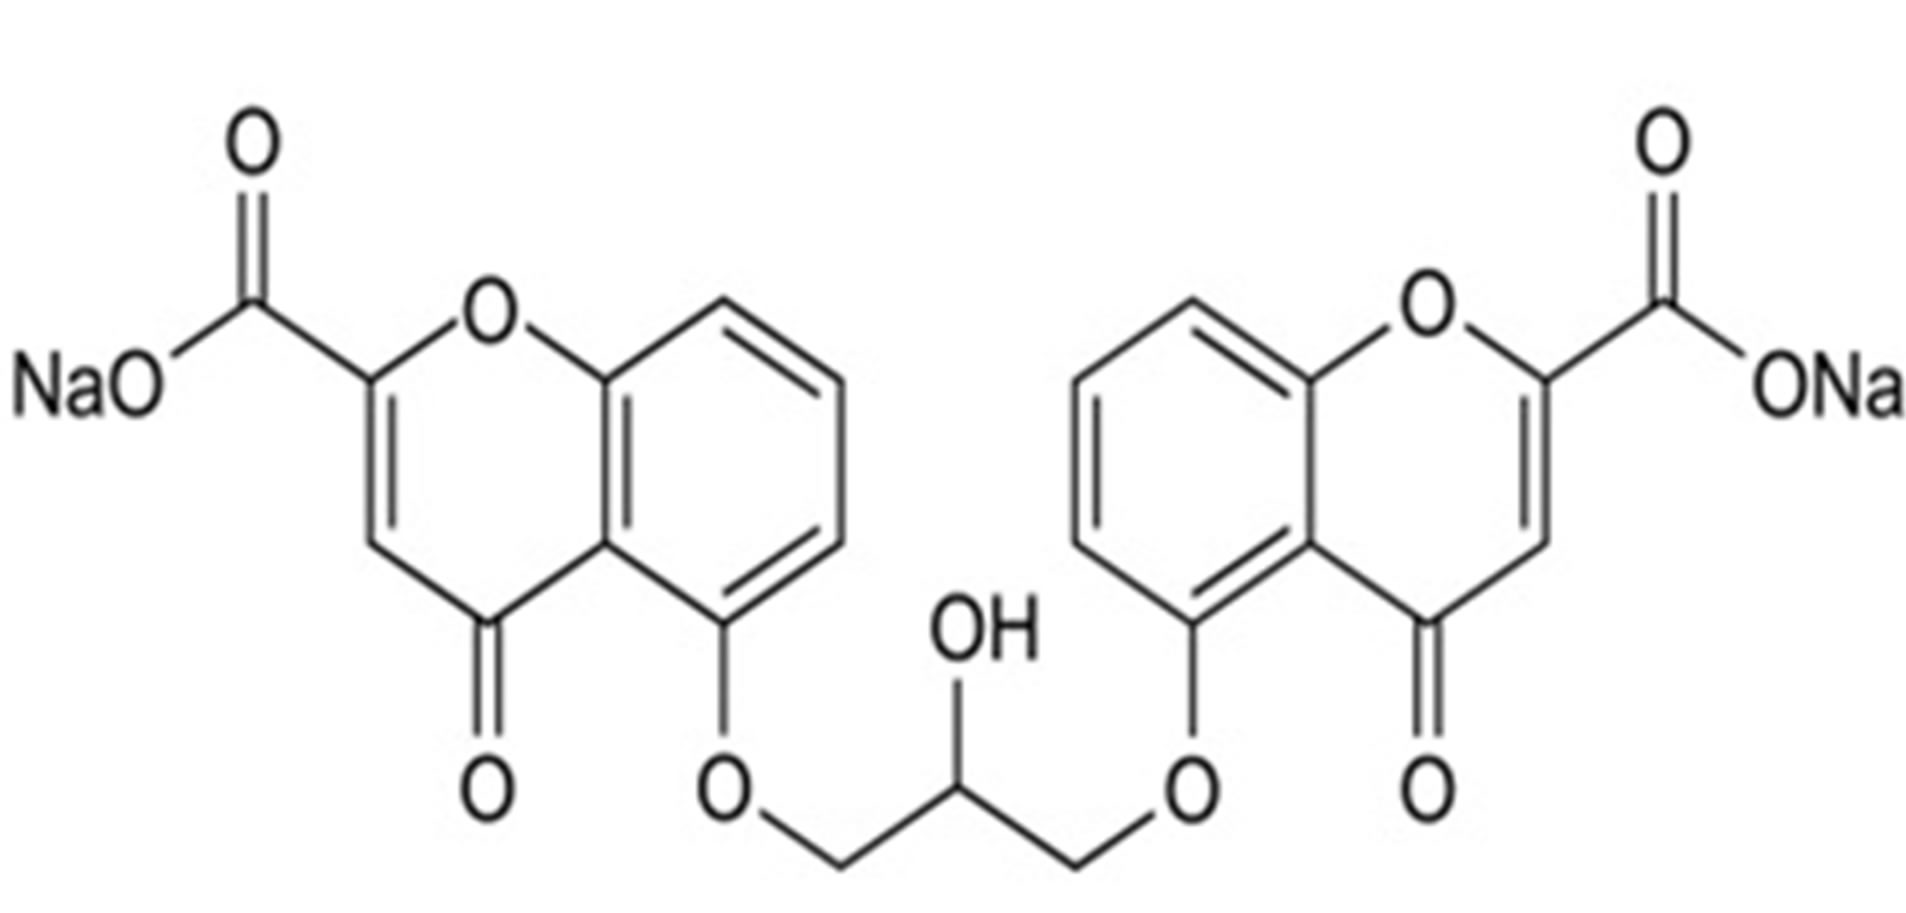
Sodium cromoglicate (SCG) is a mast cell stabilizer that inhibits the release of histamine and other inflammatory mediators from sensitized mast cells. Fluorometholone (FLU) is a corticosteroid employed for its glucocorticoid activity. Both drugs are formulated together in the form of ophthalmic solution for treatment of allergic conjunctivitis & vernal keratoconjunctivitis [9]. The chemical structures of both drugs [10] were shown in Figure 1. No methods have been reported for the analysis of the binary mixture of the two drugs.
Theory of the Novel Method
Lotfy et Hagazy [11] introduced the ratio difference spectrophotometric method (RDSM), in which the amplitude difference between two points on the ratio spectra of a mixture is directly proportional to the concentration
 (a)
(a)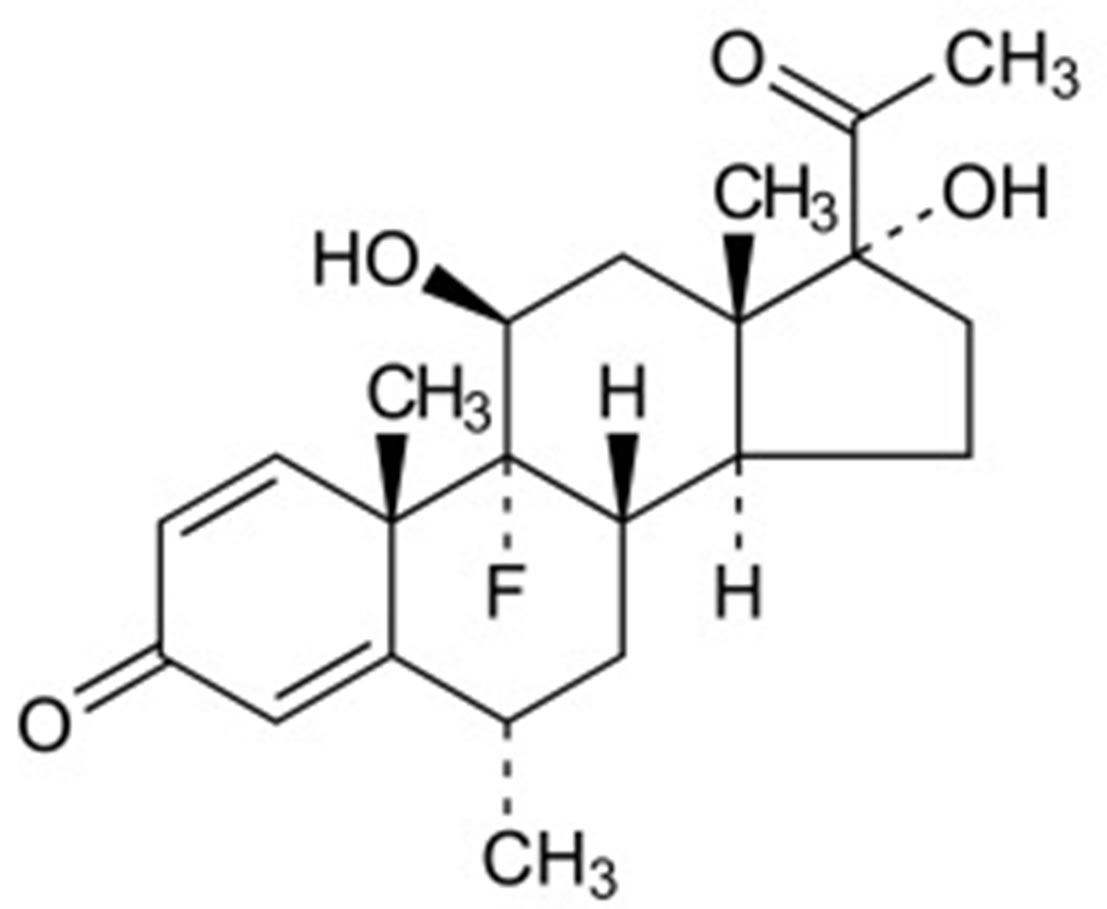 (b)
(b)
Figure 1. The chemical structures of (a) Sodium cromoglicate (SCG) and (b) Fluorometholone (FLU).
of the component of interest; independent of the interfering component.
For a mixture of the two drugs (X) and (Y), X can be determined by dividing the spectrum of the mixture by a known concentration of Y as a divisor (Y'). The division will give a new curve that represents
 .
.
By selecting two wavelengths (λ1 and λ2) on the obtained ratio spectrum and subtracting the amplitudes at these two points the constant Y/Y' will be cancelled along with any other instrumental error or any interfereence from the sample matrix.
Suppose the amplitudes at the two selected wavelength are P1 and P2 at λ1 and λ2, respectively; by subtracting the two amplitudes the interfering substance Y shows no interference; then;
P1 − P2 = [ + constant] – [
 + constant] =
The concentration of X is calculated by using the regression equation representing the linear relationship between the differences of ratio spectra amplitudes at the two selected wavelengths versus the corresponding concentration of drug (X). Similarly, Y could be determined by the same procedure using a known concentration of X as a divisor X'.
2. Experimental
2.1. Apparatus and Software
Shimadzu-UV 1800 double beam UV-Visible spectrophotometer (Japan) with matched 1 cm quartz cells at 200 - 800 nm range was used for all absorbance measurements. Spectra were automatically obtained by Shimadzu UV-Probe 2.32 system software.
2.2. Chemicals and Reagents
Pure samples. Sodium cromoglycate (SCG) was kindly supplied by Sigma Pharmaceutical Industries Limited; Al-Monofeya, Egypt, While Fluorometholone (FLU) was kindly supplied by Egypt Egyptian International Pharmaceutical Industries Co. (EIPICO), Cairo, Egypt. Their purity was found to be 100.80 ± 0.74 and 100.12 ± 0.52 for SCG and FLU respectively by the official methods [10].
Market sample. Fluca® eye drops, labeled to contain 20 mg of SCG and 1mg of FLU per 1 mL (Batch number: LM036), was manufactured by Jamjoompharma, Kingdom of Saudi Arabia.
Solvents. Methanol of spectroscopy grade supplied from (S. D. Fine-Chem Limited-Mumbai); and distilled water were used.
2.3. Standard Solutions
Stock solutions: prepared in a solvent mixture of methanol: water (50:50 v/v), of concentration 1 mg/mL and 0.5 mg/mL for SCG and FLU, respectively; and stored in dark bottles at 4˚C.
Working solutions: freshly prepared by dilution from the stock solutions with solvent mixture to get concentrations of 50 μg/mL and 20 μg/mL of SCG and FLU respectively.
2.4. Procedure
2.4.1. Linearity and Construction of Calibration Curves
Linearity of SCG. Aliquots (0.5 - 7.0 mL) of SCG working solution (50 μg/mL) were transferred into a series of 10 mL volumetric flasks, and the volume was completed with solvent mixture. The absorption spectra were measured for the prepared solutions at (200 - 400 nm) against solvent mixture as a blank.
The absorbance difference at two selected wavelengths 230 and 253 nm was recorded. Calibration curve relating the absorbance difference at the selected wavelengths to the corresponding concentrations was constructed and the regression equation was computed.
The zero order spectra of the prepared solutions were divided by the spectrum of 8 µg/mL FLU. The amplitudes of the ratio spectra were measured at 274.5 and 252.3 nm. Calibration curve relating the difference in amplitude of ratio spectra (ΔP274.5 − 252.3) to the corresponding concentrations was constructed and the regression equation was computed.
The first derivative of the stored ratio spectra 1DD were recorded (∆λ = 8; scale 20). Calibration curve relating the 1DD amplitude at 260.5 nm to the corresponding concentrations was constructed and the regression equation was computed.
Linearity of FLU. Aliquots (1.0 - 8.0 mL) of FLU working solution (20 μg/mL) were transferred into a series of 10 mL volumetric flasks, and the volume was completed with solvent mixture. The absorption spectra were measured for the prepared solutions at (200 - 400 nm) against solvent mixture as a blank.
The absorbance difference at two selected wavelengths 242 and 222.5 nm was recorded. Calibration curve relating the absorbance difference at the selected wavelengths to the corresponding concentrations was constructed and the corresponding regression equation was computed.
The zero order spectra of the prepared solutions were divided by the spectrum of 10 µg/mL SCG. The peak amplitudes of the ratio spectra were measured at 252 and 305 nm. Calibration curve relating the difference in amplitude of ratio spectra (ΔP252 − 305) to the corresponding concentrations was constructed and the regression equation was computed.
The first derivative of the stored ratio spectra 1DD were recorded (∆λ = 8; scale 20). Calibration curve relating the 1DD amplitude at 258.8 nm to the corresponding concentrations was constructed and the regression equation was computed.
2.4.2. Application to Laboratory Prepared Mixtures
Into two series of 10 mL volumetric flasks (A & B), accurate aliquots of SCG and FLU were transferred from their working solutions (50 μg/mL and 20 μg/mL), respectively, to prepare mixtures containing different ratios of the two drugs. Each flask in the second series (B) was spiked with 40 μg of FLU from its working solution (2 mL). Complete both series to volume with the solvent mixture. Record and store the spectra of the prepared solutions of both series from 200 to 400 nm. SCG was determined using series A, FLU was determined using series B. Proceed as detailed under linearity for both drugs. The concentration of each drug was calculated using the corresponding regression equation. The claimed concentration of FLU in each mixture was calculated after subtraction of the added concentration (FLU solution 4 μg/mL analyzed by using the same procedure).
2.4.3. Application to Pharmaceutical Preparation
One milliliter was accurately transferred from Fluca® eye drops to a 100 mL volumetric flask and diluted to the mark with solvent mixture to get 200 μg/mL of SCG and 10 μg/mL of FLU; the prepared solution was filtered through 0.45 μm Millipore syringe membrane filter. One milliliter of the prepared solution was transferred into two separate 10 mL volumetric flasks. Complete the first flask to volume with solvent mixture to obtain solution with a final concentration 20 μg/mL of SCG and 1 μg/mL of FLU, while the second flask was spiked with 40 μg of FLU from its working solution (2 mL) and complete to volume with solvent mixture. SCG was determined from the first flask and FLU was determined from the second flask. Proceed as detailed under linearity for both drugs. The concentration of each drug was calculated using the corresponding regression equation. The claimed concentration of FLU in the solution was calculated after subtraction of the added concentration (FLU solution 4 μg/mL analyzed by using the same procedure). When carrying out the standard addition technique, different known concentrations of pure standard SCG and FLU were added to the pharmaceutical dosage form before proceeding in the previously mentioned methods.
3. Results and Discussion
The aim of this work was to develop simple, sensitive, selective and precise spectrophotometric method for the simultaneous determination of the components in binary mixtures with overlapping spectra without previous separation. The binary mixture of SCG and FLU was chosen as an example for the application.
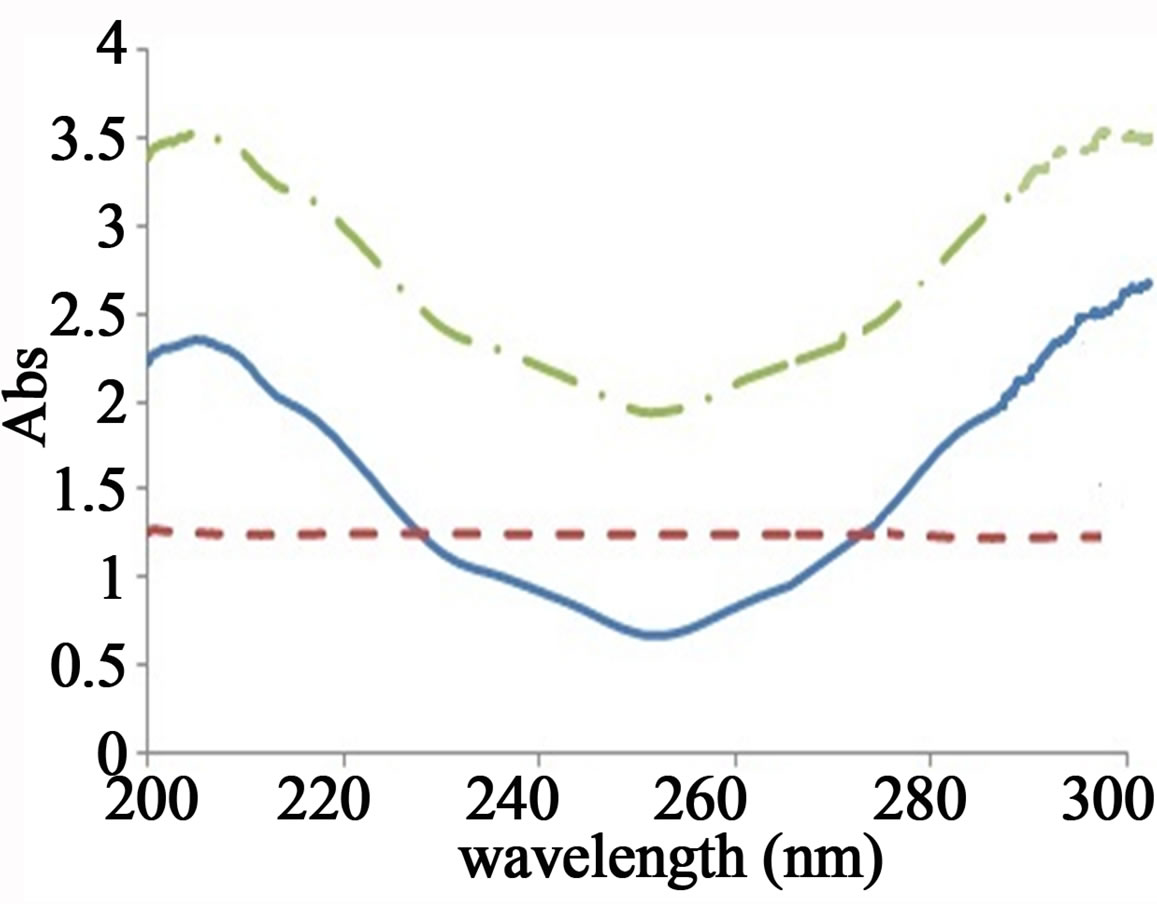
Two major problems raised upon the analysis of this binary mixture which were: the overlapped spectra with large difference between the absorptivities of the two drugs; and the ratio of the drugs in the dosage form SCG: FLU (20:1) which make it difficult to determine FLU accurately. On the analysis of mixtures of compounds of largely variable absorptivities, there is a need to use higher concentration of the component mixture solution to analyze those with low absorptivity this may lead to a deviation from Beer’s law due to the electrostatic attracttion between ions [12]. To facilitate the determination of the minor component (FLU), there is a need to increase its concentration in the binary mixture using sample enrichment technique. This is done adding fixed amounts of standard FLU to each experiment then subtract its concentration before calculating the claimed concentration of the drug. This technique has been used to solve the same problem for analyzing other drug mixtures [11,13]. The UV absorption spectra (D0) of SCG and FLU are shown in Figure 2, where FLU couldn’t be resolved by direct derivative spectrophotometry. So, different spectral manipulating techniques, including the novel method, have been applied.
3.1. Dual Wavelength Method (DWM)
The principle for dual wavelength method is that the absorbance difference between two points on the mixture spectra is directly proportional to the concentration of component A; while for component B the absorbance difference equals to zero.
For the determination of SCG two wavelengths (230 and 253 nm) were selected where the absorbance difference between the two wavelengths is directly proportional to the concentration of SCG and the absorbance difference of FLU at these wavelengths is zero.
For the determination of FLU two wavelengths (242 and 222.5 nm) were selected where the absorbance difference between the two wavelengths is directly proportional to the concentration of FLU and the absorbance difference of SCG at these wavelengths is zero, Figure 2.
The main disadvantage of this method is the restriction in the choice of the selected wavelengths which are restricted to those wavelengths with constant absorbance of the interfering substance. This lead to the necessity of critical measurement of the absorbance of the component of interest, as any minor change in the selected wavelengths will affect the results and subsequently shows poor reproducibility and robustness.
3.2. First Derivative of Ratio Spectra (1DD)
Salinas et al. [14] developed the derivative ratio spectrophotometry. This is done first by the division of the mixture’s spectrum by the spectrum of one fixed component named “divisor”. Then the derivative ratio spectrum of that mixture will be independent on that component “divisor”, and the other component can be determined with no interference. The main disadvantage of the ratio-spectra derivative spectrophotometry is the multiple manipulateing steps: division then calculating the derivative.
Different concentrations of SCG (5, 10 and 15 μg/mL) and of FLU (4, 8 and 12 μg/mL) were tested as a divisor but the concentrations 10 μg/mL of SCG and 8 μg/mL of FLU gave minimum noise in ratio spectra and maximum sensitivity. The wavelength increment over which the derivative is obtained (Δλ) was carefully tested; Δλ = 8 with medium scanning speed was chosen to perform measurements to obtain minimum noise, Figure 3.
Several amplitude peaks were observed for both drugs spectra but the previous wavelength showed minimum noise and best recovery percentages in laboratory prepared mixtures. The concentrations were calculated using the regression equations representing the linear relationship between the 1DD of each at 260.5 and 258.8 nm versus the corresponding concentrations of SCG and FLU, respectively.
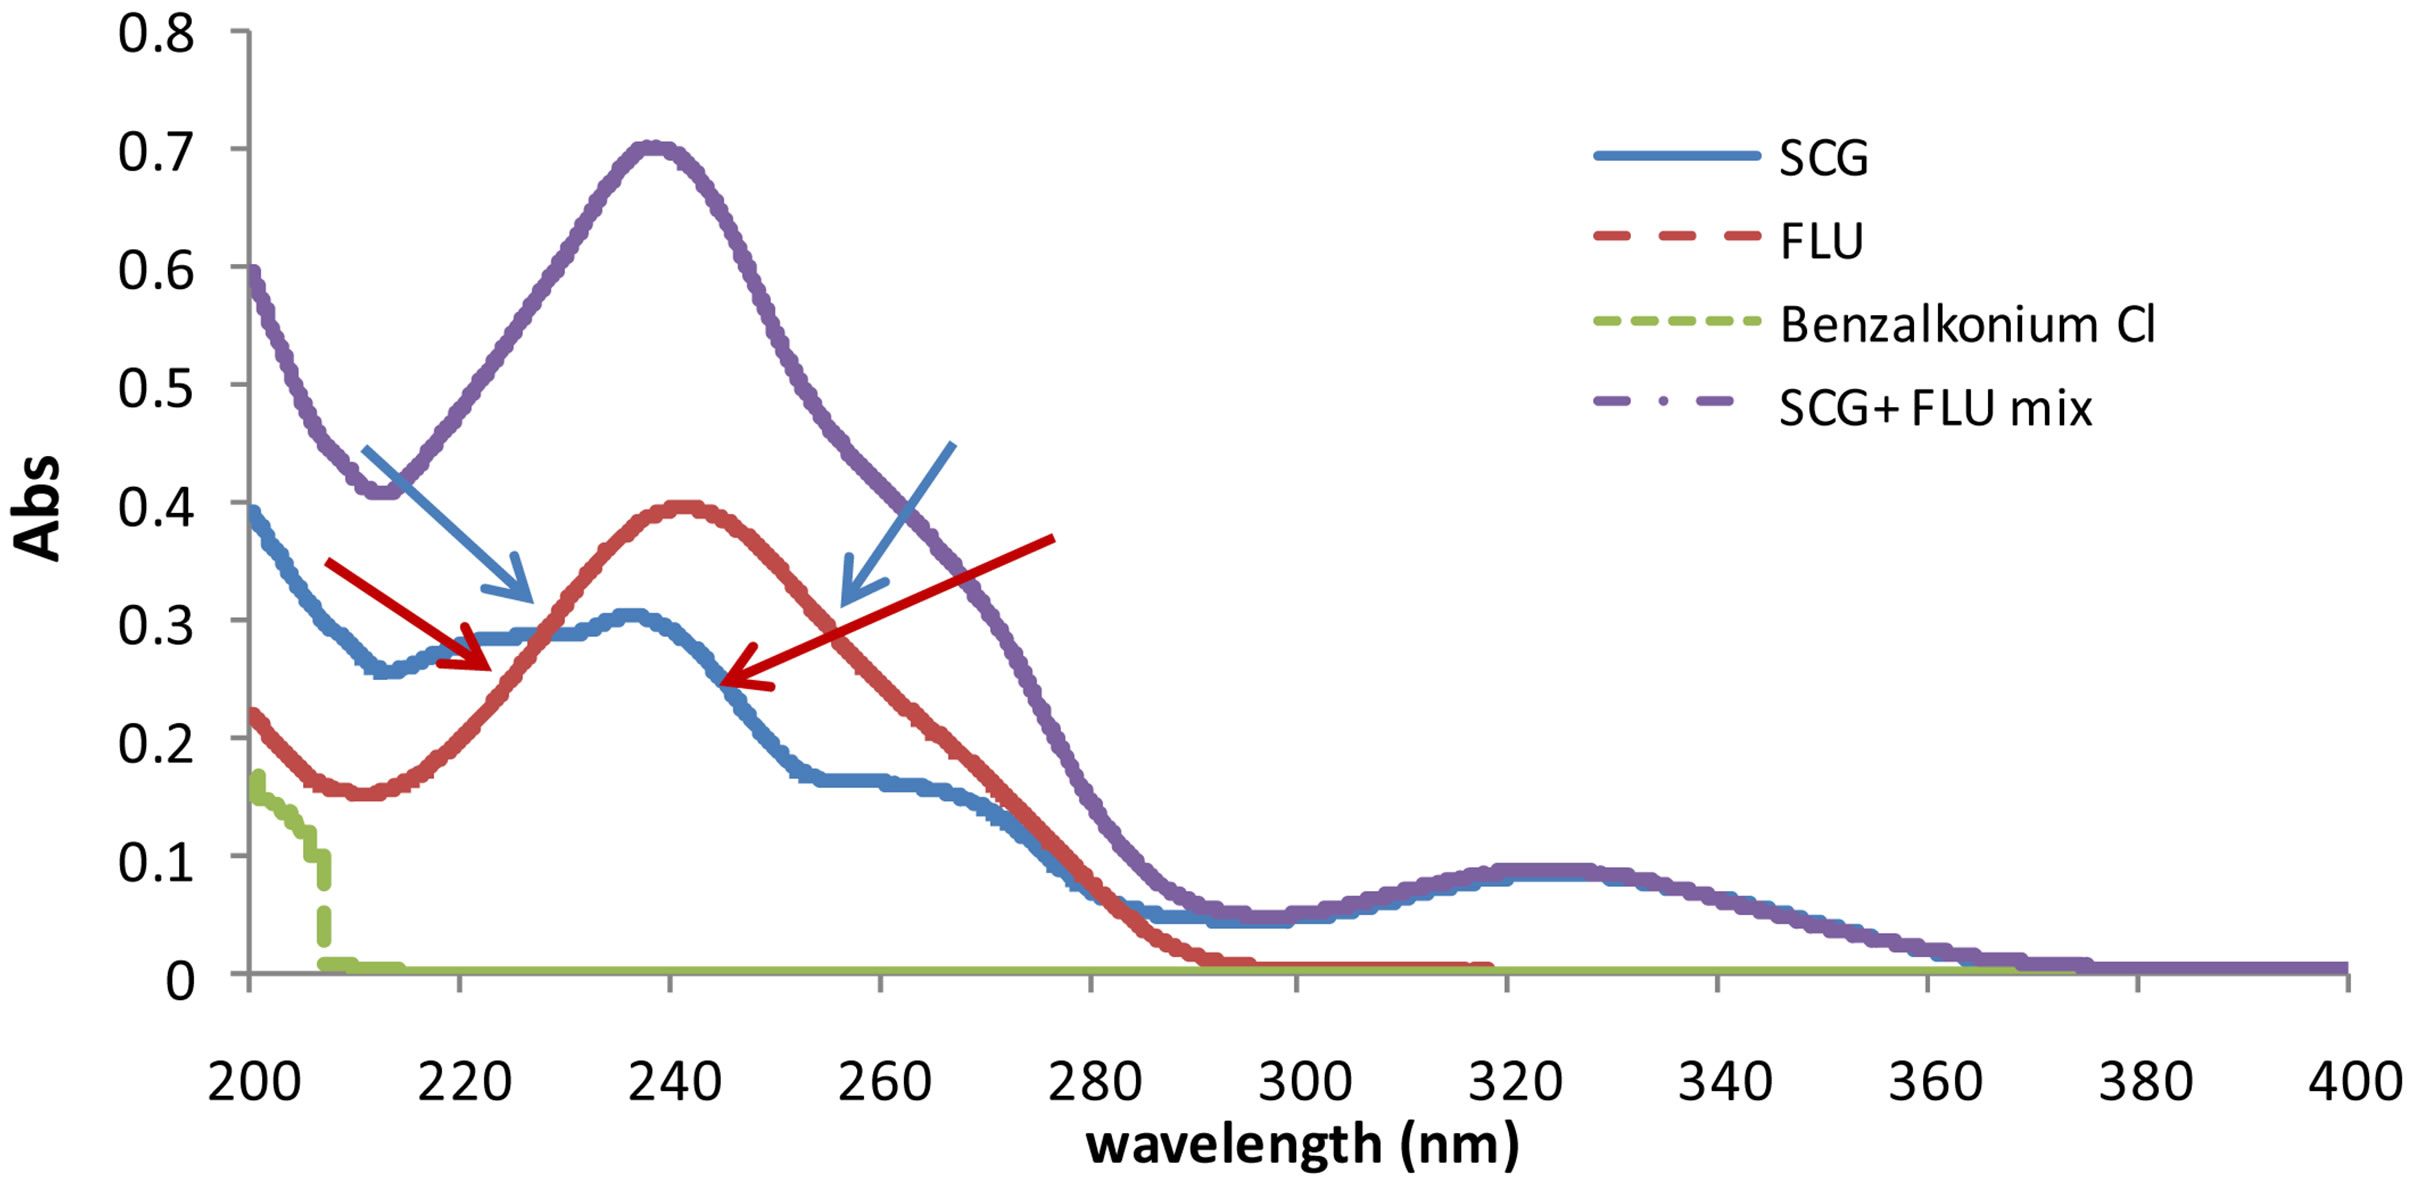
Figure 2. UV spectra of SCG (5 µg/mL), FLU (10 µg/mL), benzalkonium chloride (10 µg/mL) and mixture of 5 µg/mL of SCG and 10 µg/mL of FLU against solvent mixture of methanol:water (50:50 v/v) as blank.
 (a) (b)
Figure 3. (a) 1DD spectra of SCG (2.5 - 35 μg/mL); (b) 1DD spectra of FLU (2 - 14 μg/mL).
3.3. Ratio Difference Spectrophotometric Method (RDSM)
The most striking feature of the ratio difference method is its simplicity, accuracy and reproducibility. This novel method has the ability of solving severely overlapped spectra without prior separation meanwhile it doesn’t require any sophisticated apparatus or computer programs. The basic principle of the RDSM is that the amplitude difference between two points on the ratio spectra of a mixture is directly proportional to the concentration of the component of interest; independence of the interfering component.
The advantage of this method over the DWM is the complete elimination of the interfering component in the form of constant and the difference at any two points will be equal to zero, so there is no need for critical measurements which leads to highly reproducible and robust results. The advantage over the 1DD method is the reduced manipulating steps (eliminates the step of derivative calculation, so signal to noise ratio is enhanced).
For the determination of SCG concentration by this method, the only requirement was the contribution of the SCG and FLU at the two selected wavelengths (274.5 and 252.3 nm) where the ratio spectra of the FLU showed the same amplitudes (constant) whereas SCG ratio spectra showed significant difference in these two amplitude values at these two selected wavelengths with concentration. Similarly, another two wavelengths (252 and 305 nm) were selected for the estimation of the FLU, as shown in Figure 4.
The linearity of the amplitude values at each of the chosen wavelength against the corresponding concentration should be checked to ensure minimal noise to signal ratio at these wavelengths. By applying the ratio difference method, the difference between the two amplitude values is measured by subtraction the two values at the two selected wavelengths, so the noise will be completely cancelled.
The selected divisors should compromise between minimal noise and maximum sensitivity, so the divisors were chosen as in 1DD method. The SCG solutions (2.5 - 35 μg/mL) spectra were divided by the spectrum of FLU (8μg/mL) and the FLU solutions (2 - 16 μg/mL) spectra were divided by the spectrum of SCG (10 μg/mL). The concentration of SCG was calculated by using the regression equation representing the linear relationship between the differences of these ratio spectra amplitudes at the two selected wavelengths versus the corresponding concentration of drug SCG. Similarly, FLU could be determined by the same procedure.
All spectral measurements were done without interference of Benzalkonium chloride (preservative present in Fluca® eye drops) which did not show any absorption and its contribution to the absorption of the mixture above 220 nm was considered to be negligible at a concentration up to100 µg/mL, so the ternary mixture in range (220 - 400 nm) acts as a binary mixture of FLU and SCG.
The corresponding concentration ranges, calibration equations and other statistical parameters for the proposed methods were listed in Table 1.The selectivity of the proposed procedures was assessed by the analysis of laboratory prepared mixtures containing different ratios of the two drugs, where satisfactory results were obtained over the calibration ranges as shown in Table 2. The proposed procedures were also applied for the determination of SCG and FLU in Fluca® eye drops; and were compared to the manufacturer HPLC method [15]. The validity of the proposed procedures is further assessed by applying the standard addition technique. The results obtained are shown in Table 3.
4. Methods Validation
Method validation was performed according to ICH guidelines [16] for the proposed methods as follows.
4.1. Range and Linearity
The linearity of the proposed methods was evaluated by processing the different calibration curves on three dif-
 (a)
(a) (b)
(b)
Figure 4. Ratio spectra of SCG (5 µg/mL), FLU (10 µg/mL) and mixture of 5 µg/mL of SCG and 10 µg/mL of FLU (a) Using 8 µg/mL of FLU as a divisor; (b) Using 10 µg/mL of SCG as a divisor.
ferent days. The calibration curves were constructed within concentration ranges that were selected on the basis of the anticipated drugs concentration during the assay of the dosage form. For the DWM, the difference of absorbance between the two selected wavelengths at lower concentrations showed higher percentage error due to its small value, so the ranges for SCG and FLU were (5 - 25 µg/mL) and (5 - 16 µg/mL) respectively, while for the RDSM and 1DD the range of SCG was (2.5 - 35 µg/mL), and FLU was (2 - 14 µg/mL). The RDSM and 1DD showed a correlation coefficient of (0.9999) while for DWM it was found to be (0.9997). The corresponding concentration ranges, calibration equations and other statistical parameters for the proposed methods were listed in Table 1.
4.2. Limits of Detection and Quantification
The limit of detection (LOD) and limit of quantification (LOQ) were calculated respectively, for both drugs using the proposed methods with a ratio of 3.3 and 10 standard deviations of the blank and the slope of the calibration line, as shown in Table 1. The RDSM showed the lowest LOD and LOQ which proves its maximum sensitivity.
4.3. Accuracy
To study the accuracy of the proposed methods, procedures under study of linearity, for both drugs using the proposed methods, were repeated three times for the determination of six different concentrations of SCG and FLU within the linearity range. The accuracy expressed as percentage recoveries and standard deviation was shown in Table 1. The RDSM showed better percentage recoveries of accuracy with lower relative standard deviation (RSD) than the other methods.
4.4. Precision
The intra-day and intra-day precision of the proposed methods were determined by the analysis of three different concentrations of SCG and FLU, within the linearity range, by three replicate analyses of three pure samples of both drugs on a single day and on three consecutive days, respectively. The RDSM and 1DD methods showed better results with lower RSD values than the DWM. The results were illustrated in Table 1.
4.5. Selectivity
Selectivity was ascertained by analyzing different mixtures containing both drugs in different ratios within the linearity range. The RDSM showed good percentage recoveries with the lowest standard deviation among the other methods. Satisfactory results were shown in Table 2.
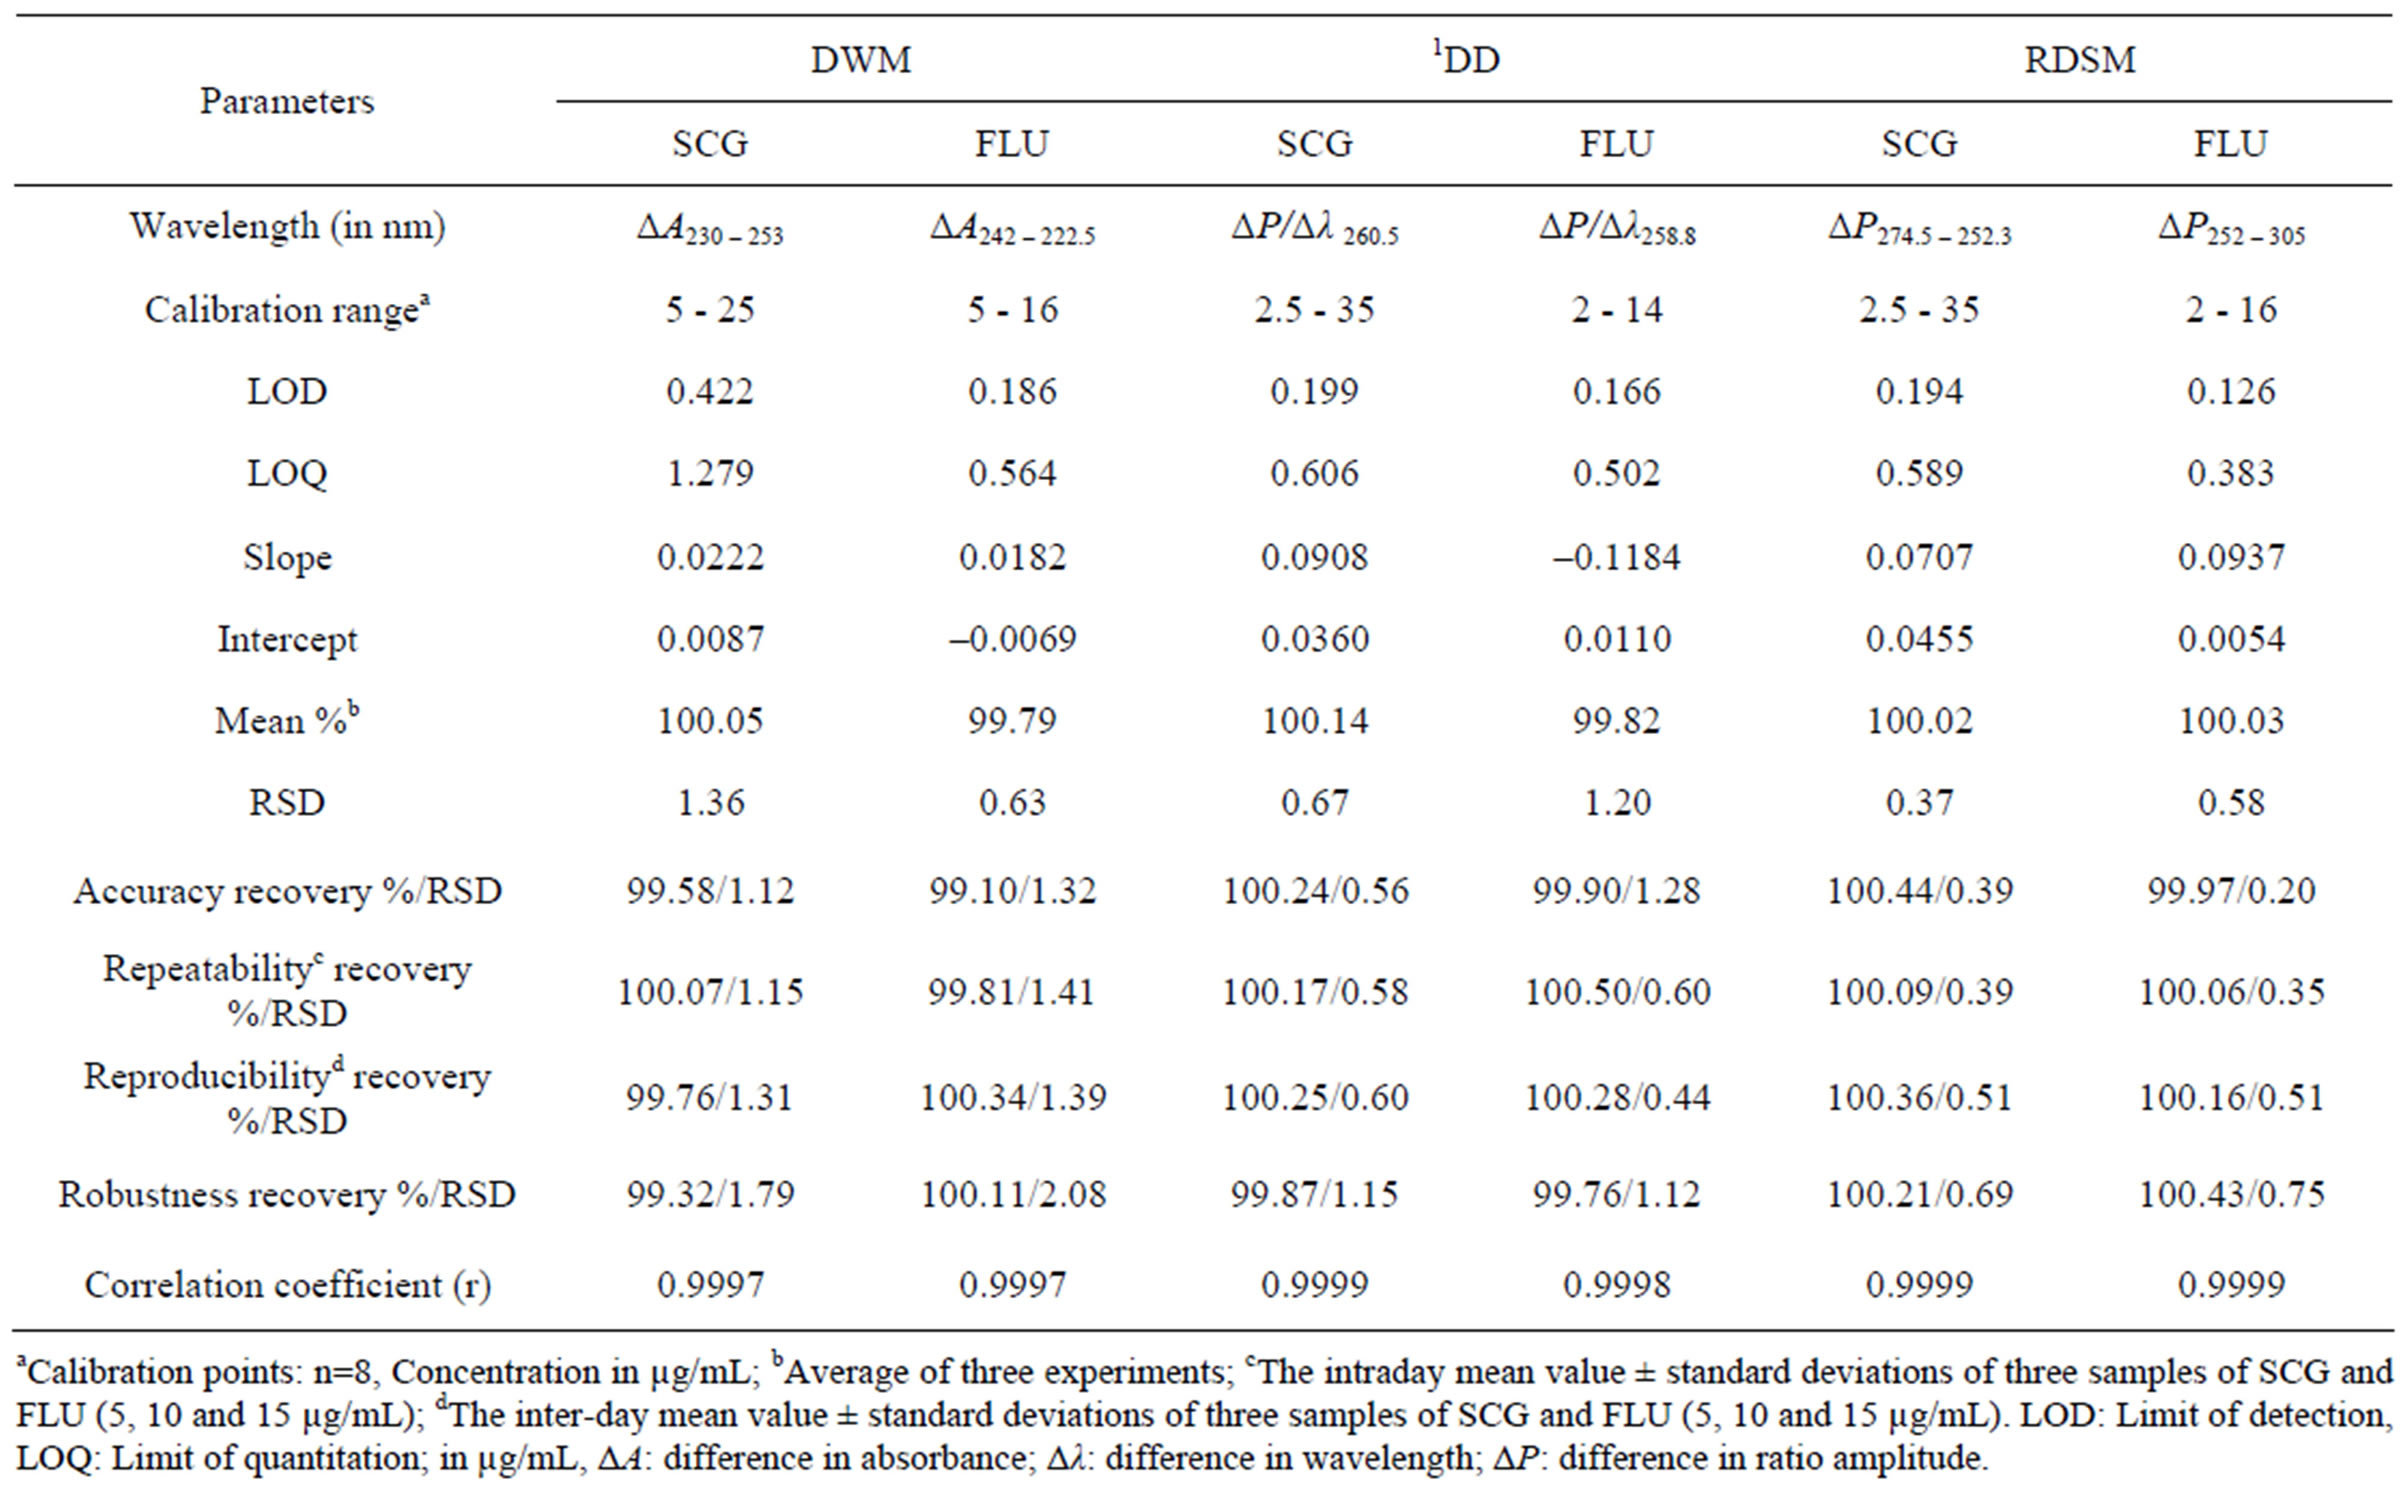
Table 1. Assay parameters and method validation obtained by applying the proposed methods.
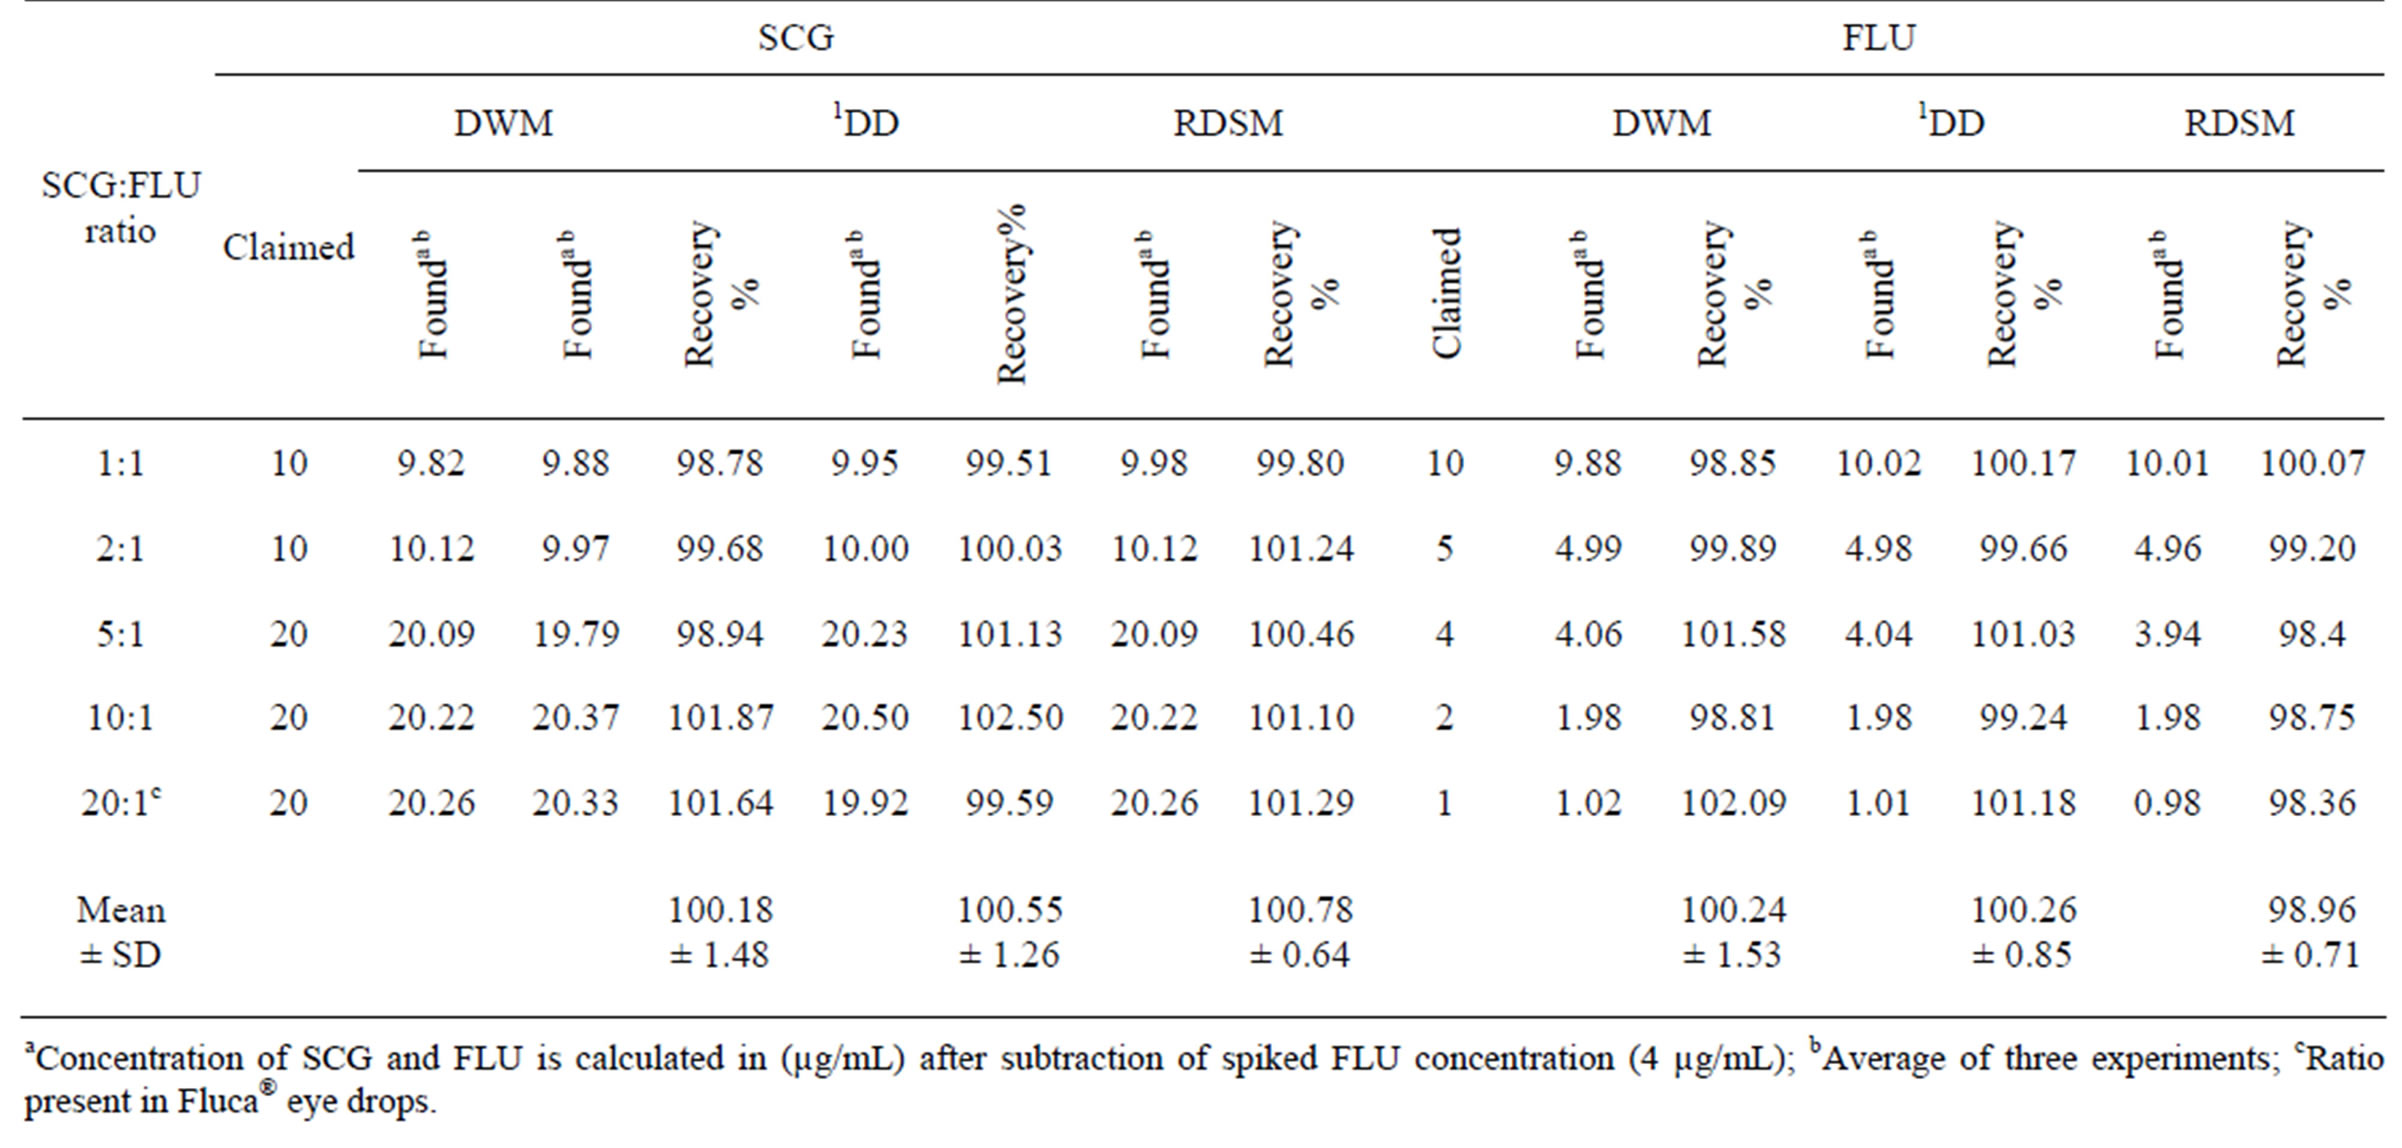
Table 2. Determination of SCG and FLU in laboratory prepared mixtures by applying the proposed methods.
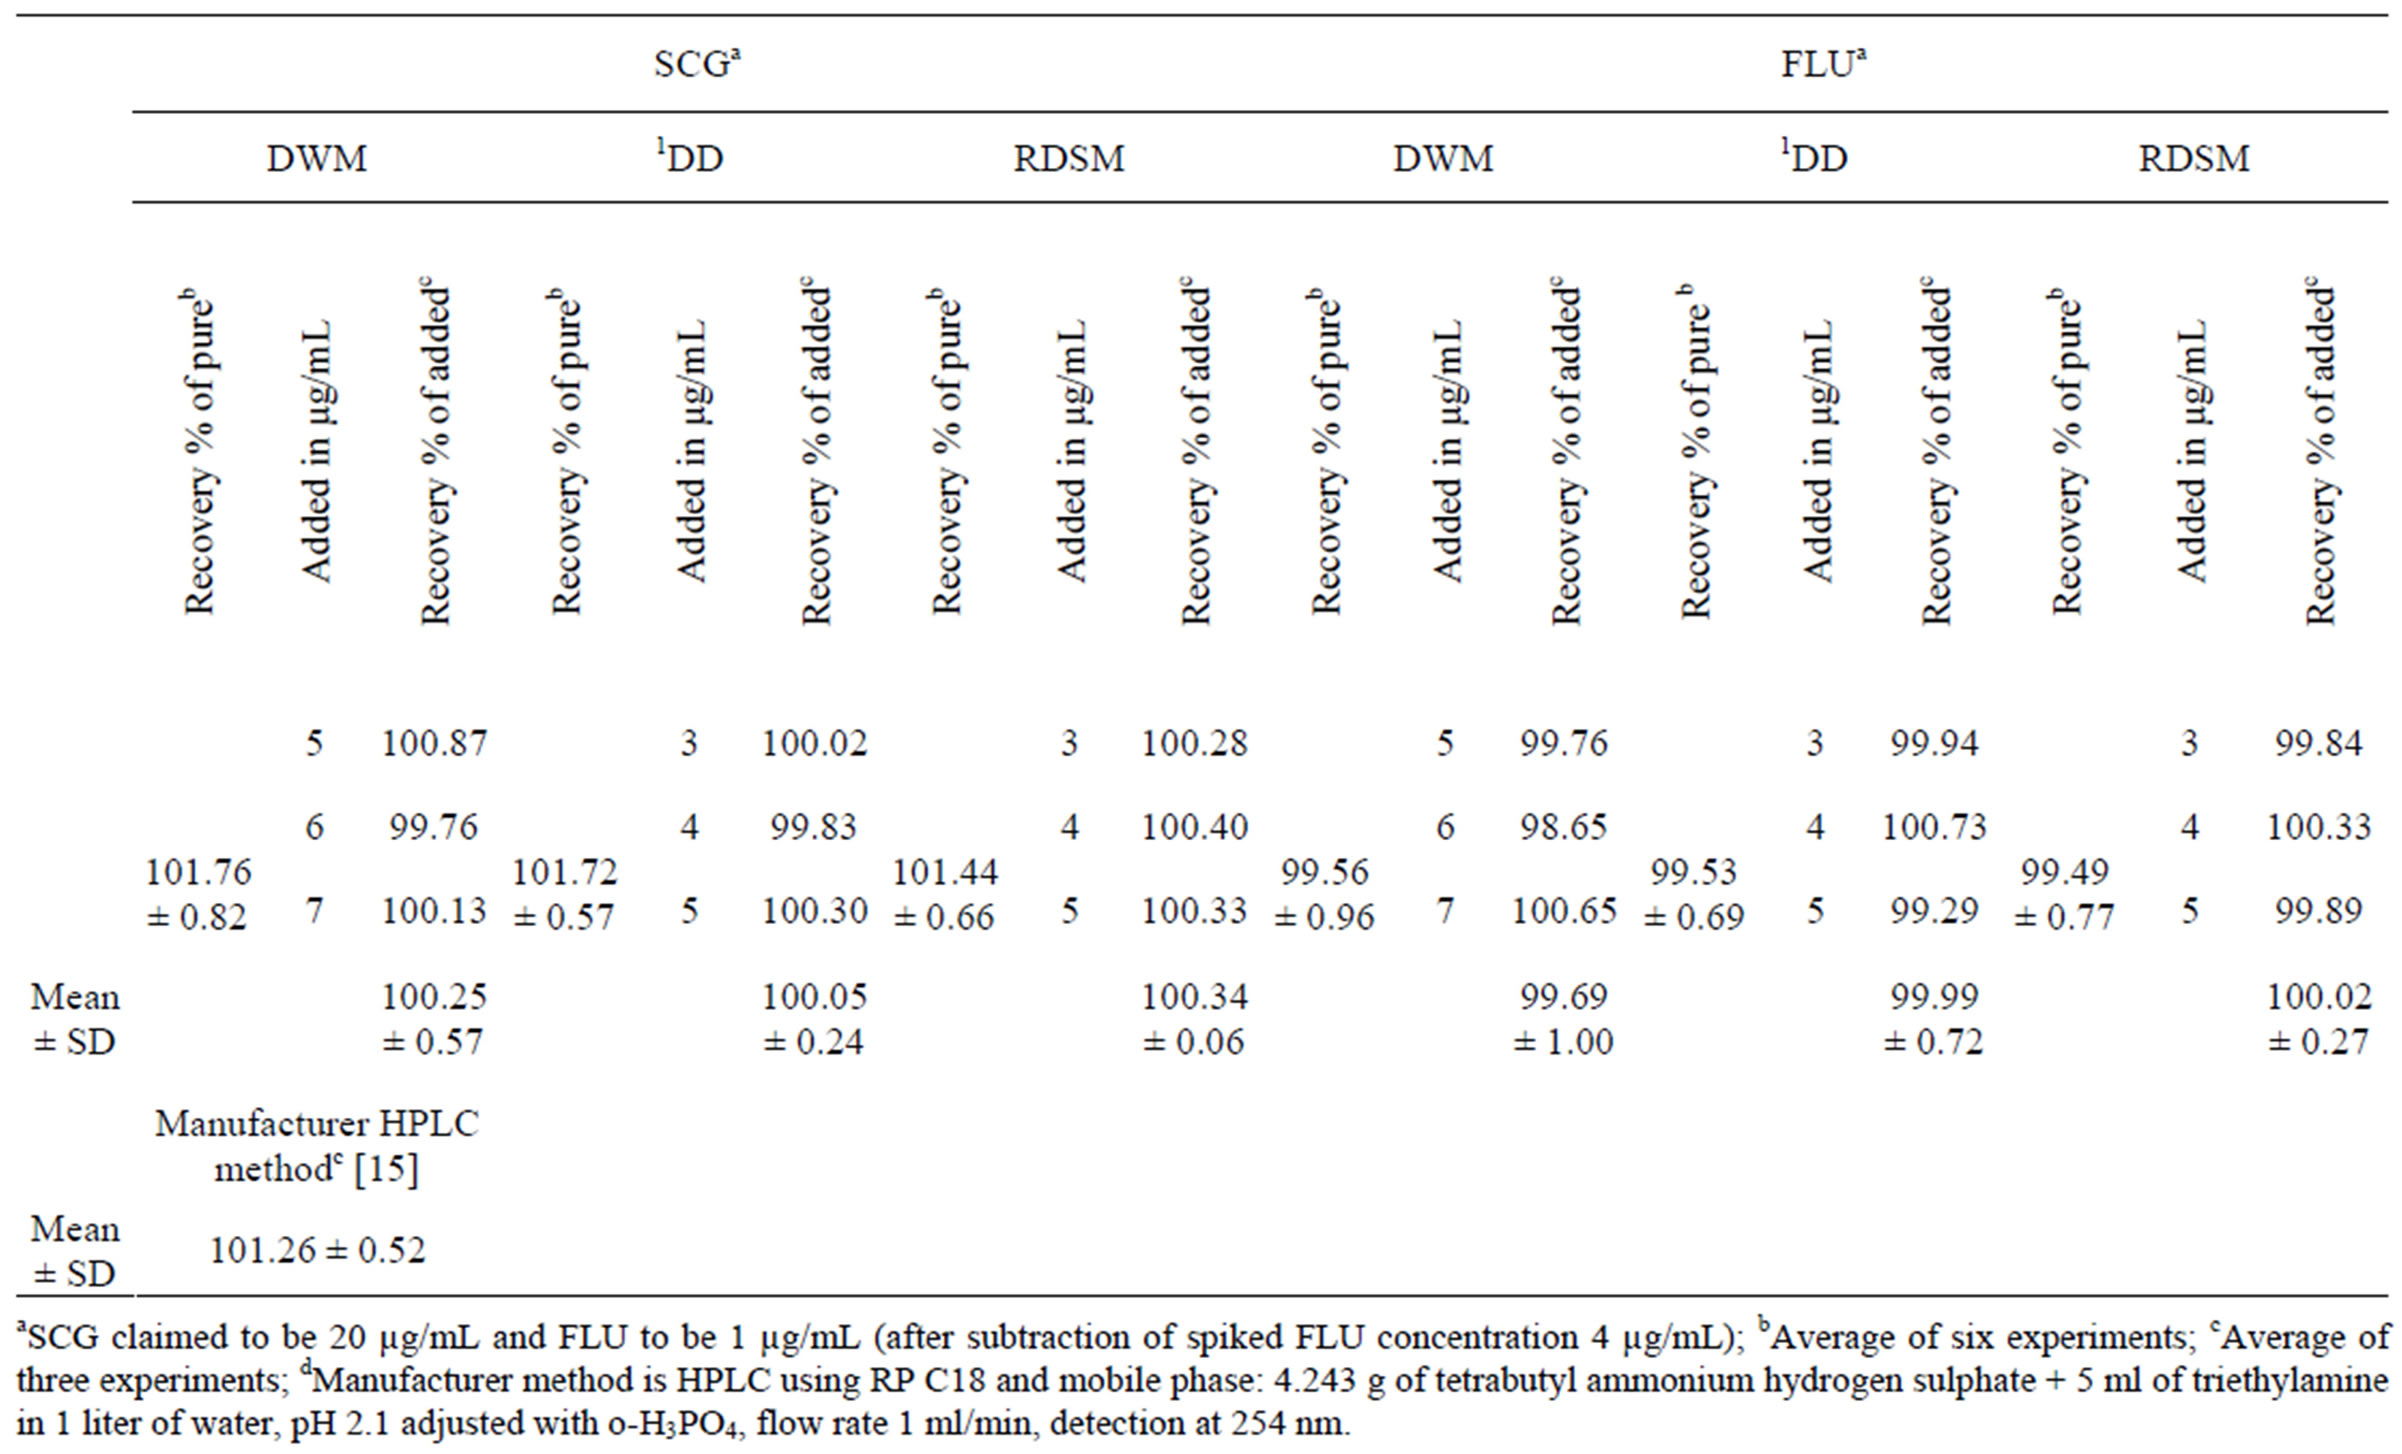
Table 3. Application of standard addition technique to the analysis of SCG and FLU in Fluca® eye drops (Batch No. LM036) by applying the proposed methods.
4.6. Robustness
Testing for robustness involved performing the spectral measurements at ±2 nm. The robustness was calculated as percentage recoveries and relative standard deviation as shown in Table 1. As mentioned before, the RDSM had advantages over the DWM as there is no need for critical measurements. The results revealed that the RDSM and 1DD methods gave robust results (RSD < 2) while DWM proved to be not robust as it gave a RSD > 2.
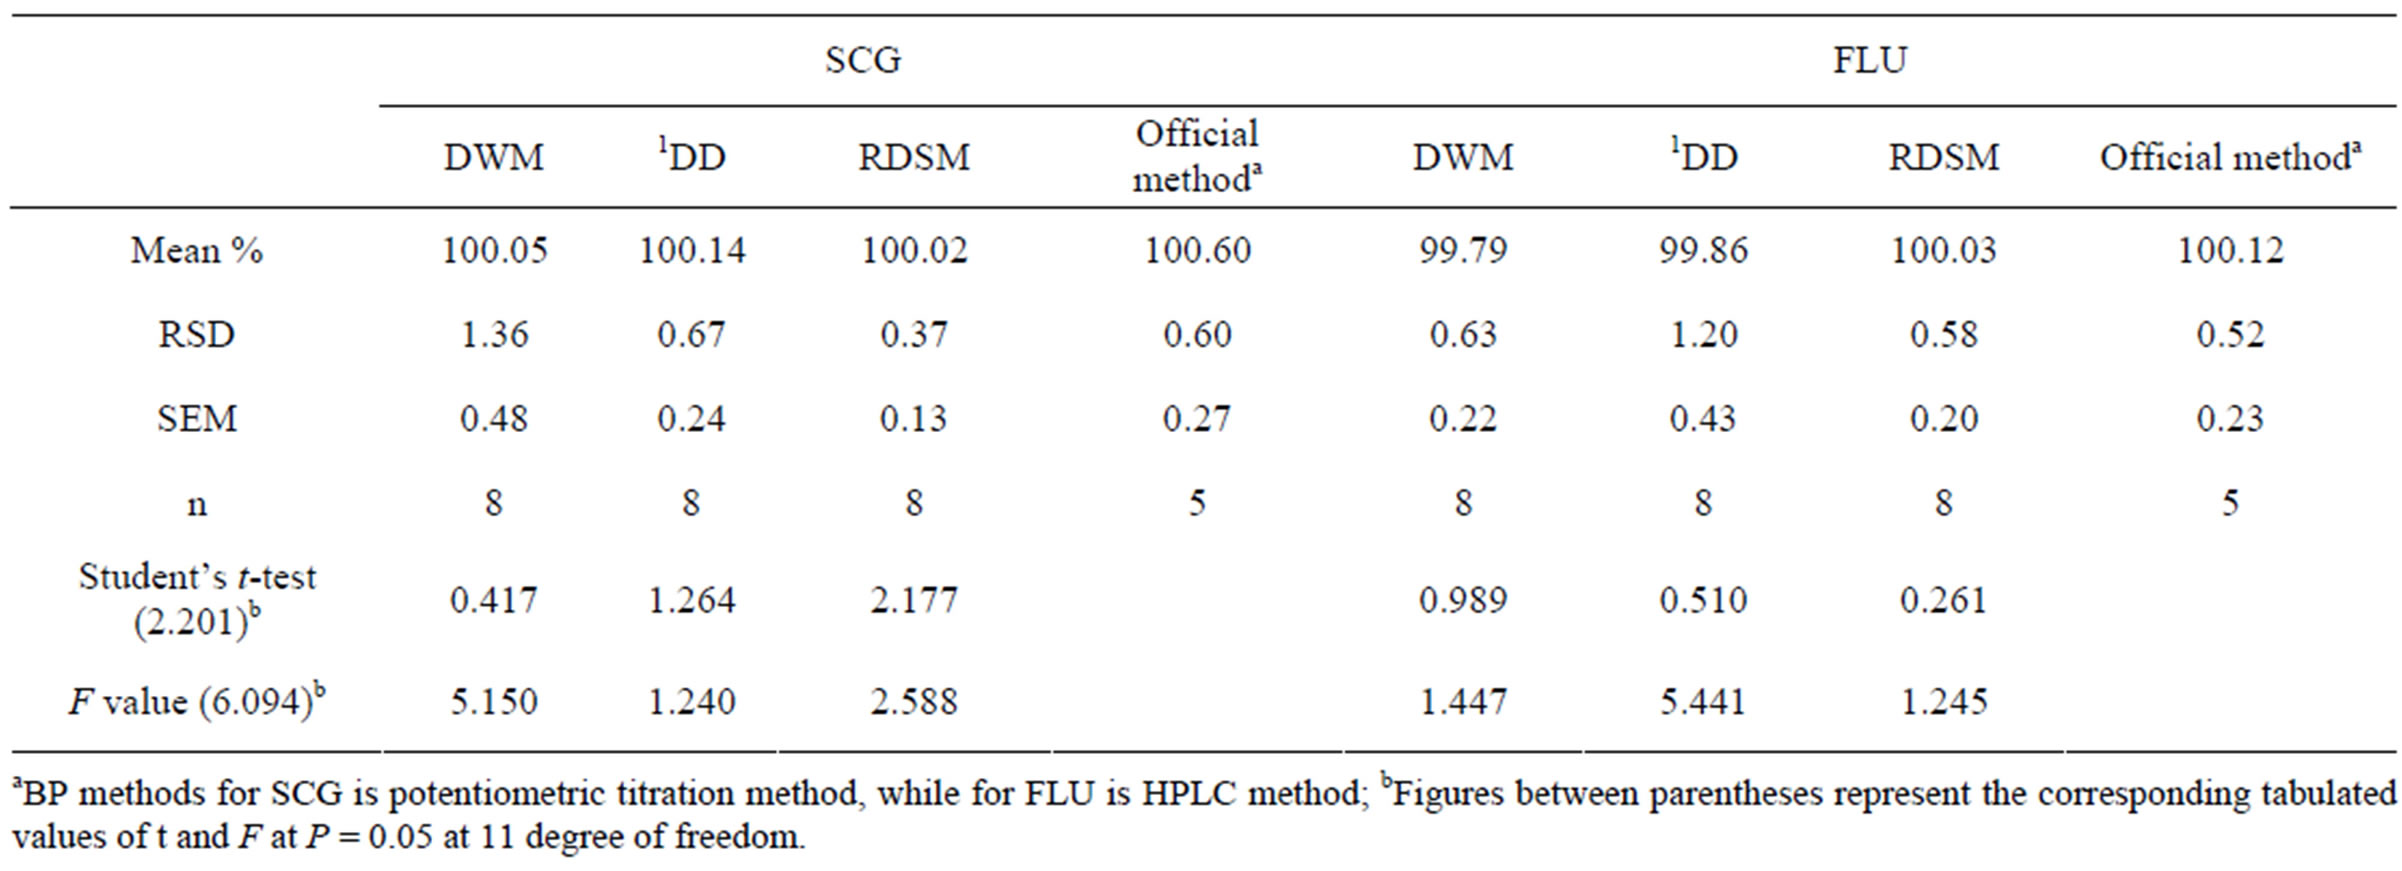
Table 4. Statistical comparison between the results obtained by the proposed method and the official BP methods [10] for the determination of SCG and FLU in pure powder form.
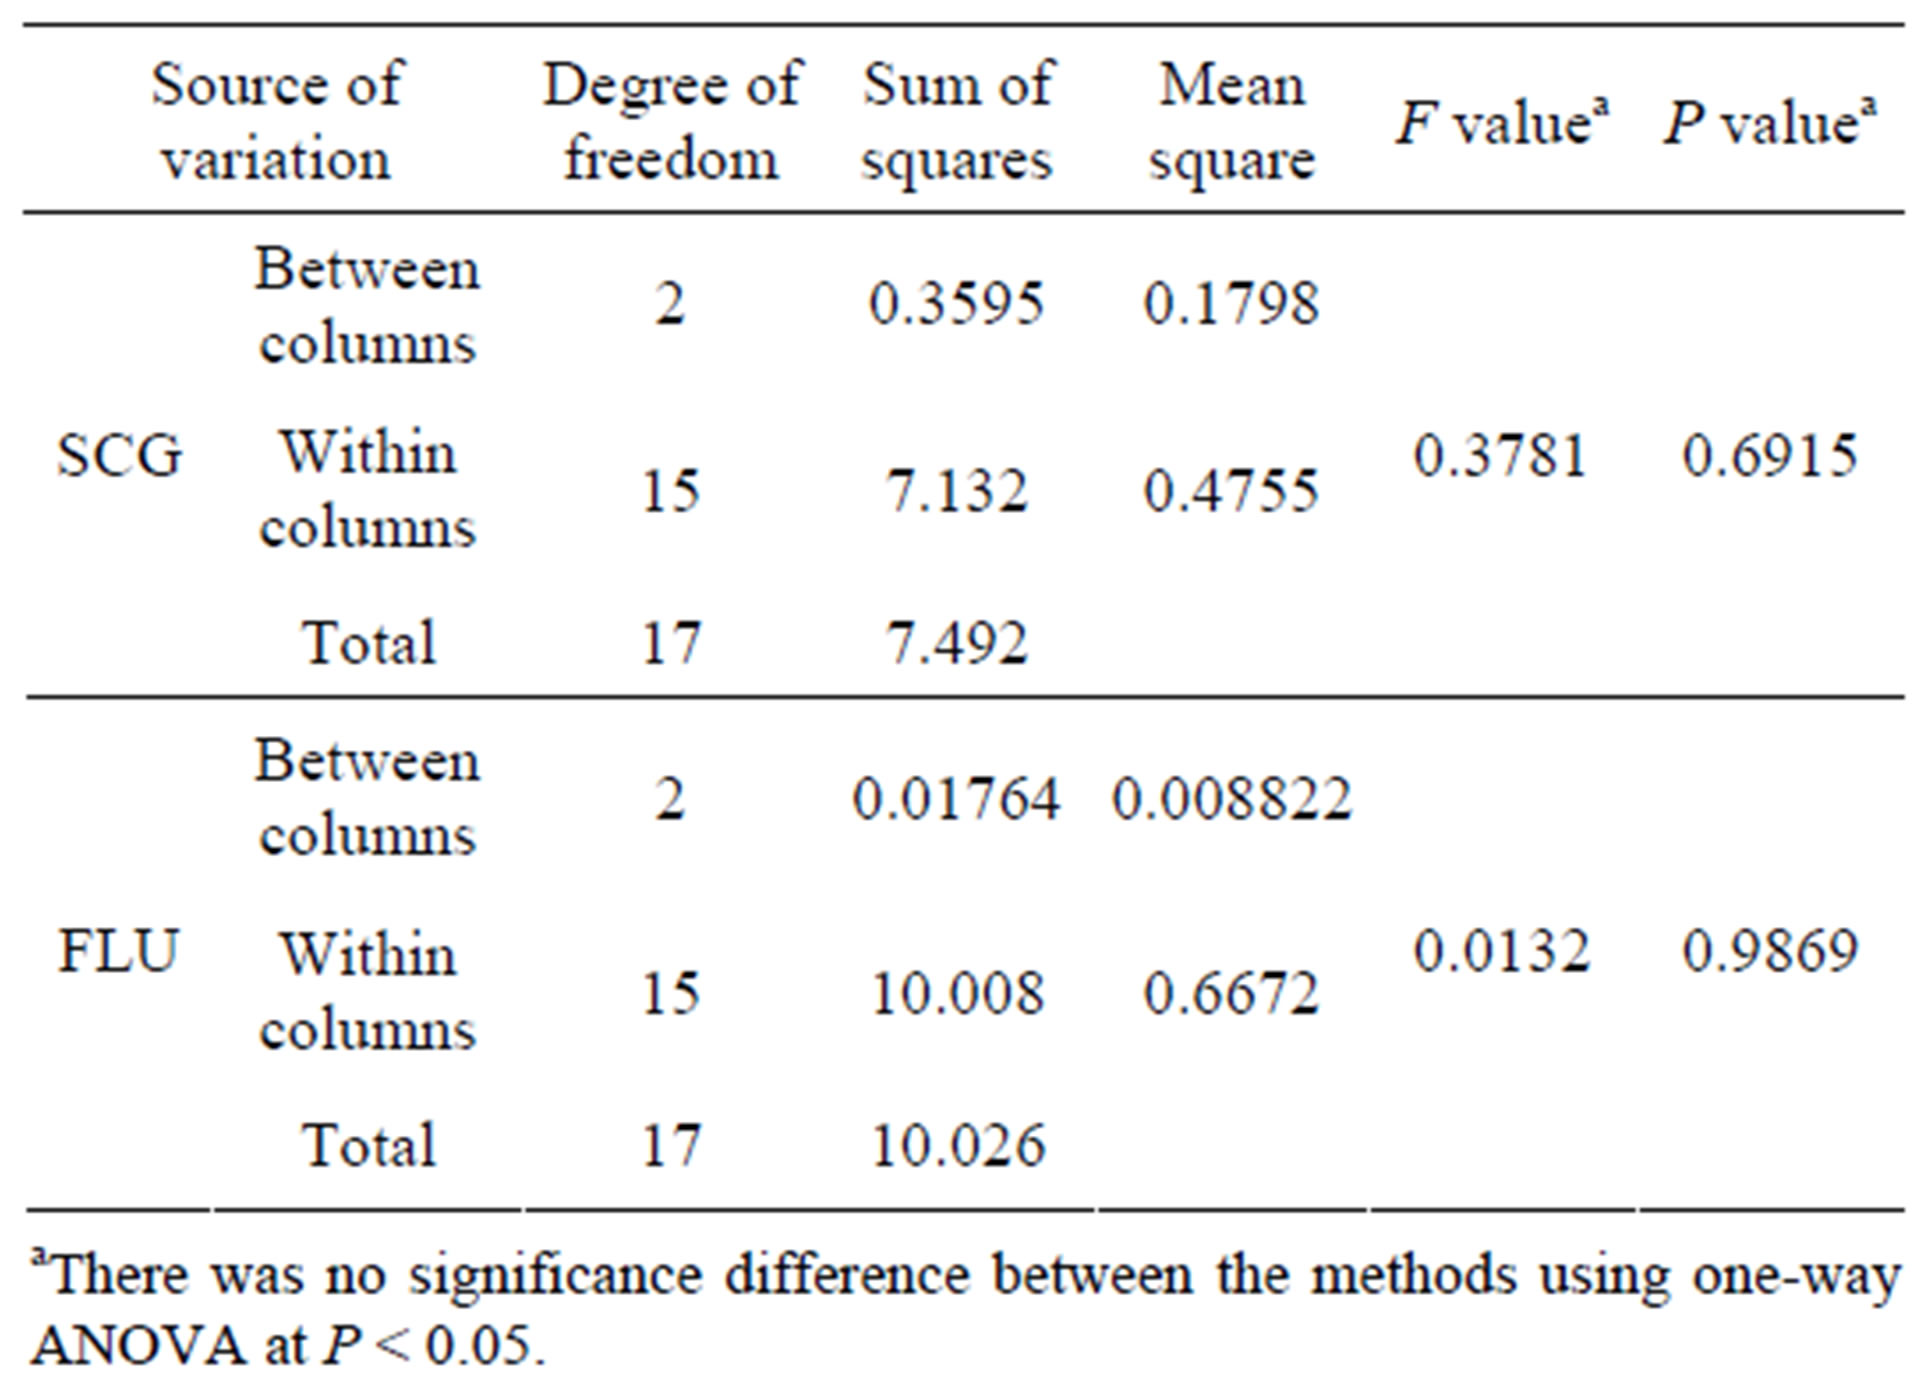
Table 5. Results of ANOVA (single factor) for comparison of the proposed for the determination of SCG and FLU in pharmaceutical dosage form.
5. Statistical Analysis
Table 4 showed statistical comparison of the results obtained by the proposed methods and official methods [10]. The calculated t and F values were less than the theoreticcal ones indicating that there was no significant difference between the proposed and the official methods with respect to accuracy and precision. One-way ANOVA was applied for the comparison of the proposed methods; Table 5 shows that there was no significant difference between the novel RDSM and the conventional methods, proving the validity of the novel method.
6. Conclusion
The developed RDSM method has the advantages of being simpler and selective than the conventional spectrophotometric ones as it does not need critical measurement at fixed wavelengths or any derivative calculation, hence signal to noise ratio is enhanced and by difference between two wavelengths, noise will be cancelled. The developed methods do not need sophisticated instruments or any prior separation steps and so it can be used as alternative methods to LC methods in laboratories lacking the required facilities for these techniques for the analysis of any binary mixture without any limitation or specified requirement except that the two spectra of the proposed drugs should be contributed at the chosen wavelengths.
REFERENCES
- N. Y. Hassan, E. M. Abdel-Moety, N. A. Elragehy and M. R. Rezk, “Selective Determination of Ertapenem in the Presence of Its Degradation Product,” Spectrochimica Acta Part A: Molecular and Biomolecular Spectroscopy, Vol. 72, No. 5, 2009, pp. 915-921. doi:10.1016/j.saa.2008.12.025
- H. M. Lotfy, M. M. A. Abosen and M. G. El-Bardicy, “Stability-Indicating Methods for the Determination of Famciclovir in the Presence of Its Alkaline-Induced Degradation Product,” Drug Testing and Analysis, Vol. 2, No. 4, 2010, pp. 188-199. doi:10.1002/dta.119
- N. Aguerssif, M. Benamor, M. Kachbi and M. T. Draa, “Simultaneous Determination of Fe(III) and Al(III) by First-Derivative Spectrophotometry and Partial Least- Squares (PLS-2) Method—Application to Post-Haemodialysis Fluids,” Journal of Trace Elements in Medicine and Biology, Vol. 22, No. 3, 2008, pp. 175-182. doi:10.1016/j.jtemb.2007.12.004
- N. E. Wagieh, M. A. Hegazy, M. Abdelkawy and E. A. Abdelaleem, “Quantitative Determination of Oxybutynin Hydrochloride by Spectrophotometry, Chemometry and HPTLC in Presence of Its Degradation Product and Additives in Different Pharmaceutical Dosage Forms,” Talanta, Vol. 80, No. 5, 2010, pp. 2007-2015. doi:10.1016/j.talanta.2009.11.002
- H. W. Darwish, S. A. Hassan, M. Y. Salem and B. A. El-Zeiny, “Three Different Spectrophotometric Methods Manipulating Ratio Spectra for Determination of Binary Mixture of Amlodipine and Atorvastatin,” Spectrochimica Acta Part A: Molecular and Biomolecular Spectroscopy, Vol. 83, No. 1, 2011, pp. 140-148.
- M. G. El-Bardicy, H. M. Lotfy, M. A. El-Sayed and M. F. El-Tarras, “Smart Stability-Indicating Spectrophotometric Methods for Determination of Binary Mixtures without Prior Separation,” Journal of AOAC International, Vol. 91, No. 2, 2008, pp. 299-310.
- N. S. Abdelwahab, “Spectrophotometric Methods for Simultaneous Determination of Carvedilol and Hydrochlorothiazide in Combined Dosage Form,” Arabian Journal of Chemistry, 2011.
- N. K. Ramadan, H. M. Mohamed and A. A. Moustafa, “Simultaneous Determination of Rabeprazole Sodium and Domperidone,” Journal of Applied Pharmaceutical Science, Vol. 1, No. 9, 2011, pp. 73-80.
- S. C. Sweetman, “Martindale: The Complete Drug Reference,” Pharmaceutical Press, London, 2005.
- “British Pharmacopoeia,” The Stationery Office on Behalf of the Medicines and Healthcare Products Regulatory Agency (MHRA)-© Crown Copyright, 2009.
- H. M. Lotfy and M. A. Hagazy, “Comparative Study of Novel Spectrophotometric Methods Manipulating Ratio Spectra: An Application on Pharmaceutical Ternary Mixture of Omeprazole, Tinidazole and Clarithromycin,” Spectrochimica Acta Part A: Molecular and Biomolecular Spectroscopy, Vol. 96, 2012, pp. 259-270. doi:10.1016/j.saa.2012.04.095
- D. Harvey, “Modern Analytical Chemistry,” McGraw-Hill, New York, 2000.
- H. M. Lotfy, “Simultaneous Determnination of Omeprazole, Tinidazole and Clarithromycin in Combination,” Bulletin of Faculty of Pharmacy, Cairo University, Vol. 44, No. 2, 2006. pp. 27-38.
- F. Salinas, J. J. Berzas-Nevado and A. E. Mansilla, “A New Spectrophotometric Method for Quantitative Multicomponent Analysis Resolution of Mixtures of Salicylic and Salicyluric Acids,” Talanta, Vol. 37, Suppl. 3, 1990, pp. 347-351. doi:10.1016/0039-9140(90)80065-N
- Quality Control Department, “Test Method for Determination of Fluca Ear Drops,” National Organization for Drug Control and Research, Egypt.
- International Conference on Harmonization (ICH) Q2B, “Validation of Analytical Procedures: Methodology,” Federal Register, Vol. 62, No. 96, 1997, pp. 27463-27467.
NOTES
*Corresponding author.