Open Journal of Radiology
Vol.2 No.3(2012), Article ID:23314,4 pages DOI:10.4236/ojrad.2012.23017
Air Trapping: A Cause of Heterogeneous Attenuation
Department of Radiology, Faculty of Medicine, Oita University, Yufu, Japan
Email: m08d9032@oita-u.ac.jp
Received June 14, 2012; revised July 15, 2012; accepted July 26, 2012
Keywords: Air Trapping; CT Examination; Lung Attenuation
ABSTRACT
Purpose: To investigate important factors affecting the frequency of air trapping through observation of normal lung attenuation, and propose a cause of heterogeneous attenuation. Materials and Methods: In this ethical committee-approved study, a total of 109 patients (30 males, 79 females; mean age, 58.2 years; range, 27 - 81 years) were included. All patients had undergone inspiratory and expiratory chest thin-section computed tomography (CT) examinations and pulmonary function tests. Air trapping on CT images was graded subjectively. Hounsfield units (HU) lung attenuation value and lung volume were measured on CT images. All variables (age, sex, indices of pulmonary function test results, air trapping score, HU value, and rate of change in lung volume) were compared by diagnoses and air trapping findings cohorts. The correlation between lung function test results and expiratory HU attenuation were analyzed. Results: Interstitial pneumonia showed higher and bronchiolitis obliterans showed lower HU attenuation at normal and air trapping regions. The variables affecting air trapping findings were age, a ratio of forced expiratory volume in 1 second to forced vital capacity (FEV1.0/FVC), maximal expiratory flow at 50% of forced vital capacity (MEF50), HU attenuation at normal regions, and rate of change in lung volume. Compared with expiratory HU attenuation, significant positive correlation was shown to FEV1.0/FVC and negative correlation to single-breath diffusion capacity for carbon monoxide, which was confirmed by a simple regression analysis. Conclusion: It can be suggested that lung attenuation can increase when fibrosis is advanced, and this is exaggerated when lungs are compressed.
1. Introduction
In patients with obstructive airway physiology, highresolution computed tomography (HRCT) scans often display a characteristic finding of mosaic attenuation. This is characterized by heterogeneous lung density, with the lower-density lung being abnormal; this is a common element of air trapping [1,2]. Decreased attenuation of lung parenchyma on expiratory CT scans is a major determinant of airflow obstruction, and expiratory HRCT is an established of imaging technique for assessment of air trapping.
However, in terms of depiction of air trapping, wider variation may be seen in the literature. Many efforts have been made to evaluate air trapping findings with multiple methodologies and patient selections [3-16], and there still appears to be no agreement in the results.
So far, assessment has focused on the regions that demonstrate air trapping, and functional correlation has been analyzed based on the extent of air trapping (objectively or quantitatively). However, abnormal expiratory air trapping may be depicted in patients with normal pulmonary function tests, while end expiratory scans may appear unremarkable with no change in patients with severe and widespread involvement of small airways [17]. The cause of mosaic attenuation has commonly been referred to as decreased perfusion and an element of air trapping [1,18,19]; however, this may not adequately explain the contradictory aspects of mosaic attenuation. To the best of our knowledge, no studies have been published describing a cause of mosaic attenuation.
In this study, we focused on changes in normal lung attenuation; because air trapping, which is characterized by areas of low attenuation, is demonstrated when attenuation of adjacent normal areas increase on expiratory CT images. The purpose of this study, therefore, was to investigate important factors affecting the frequency of air trapping and propose a cause of heterogeneous attenuation.
2. Materials and Methods
2.1. Patients
Our institutional review board approved this study. Informed consent was not applicable because of its retrospective nature.
We retrospectively identified 121 patients who underwent inspiratory and expiratory chest thin-section CT examinations to estimate the presence and extent of air trapping between January 2005 and March 2011 at our institutions. Medical records and CT images were available for review in all patients. Pulmonary function test results, when available, were also reviewed. Because CT images were compared with pulmonary function results, we excluded 12 patients because of unavailability of the pulmonary function test results. Consequently, the final study group comprised 109 patients (30 males, 79 females; mean age, 58.2 years; range, 27 - 81 years).
Diagnoses were based on transbronchial lung biopsy (n = 96), video-assisted thoracoscopic lung biopsy (n = 2), thoracotomy (n = 3), or clinical history and laboratory data (n = 8). Patient characteristics are shown in Table 1.
At the time of examinations, all patients were in a clinically and functionally stable condition, and no patient had acute infection or lung transplantation.
2.2. Pulmonary Function Tests
Pulmonary function test results were adopted when performed within two days of the CT examination. Indices reviewed were vital capacity (VC), forced vital capacity (FVC), forced expiratory volume in 1 second (FEV1.0), FEV1.0/FVC, maximal expiratory flow at 50% of forced vital capacity (MEF50), total lung capacity (TLC), residual volume (RV), and single-breath diffusion capacity for
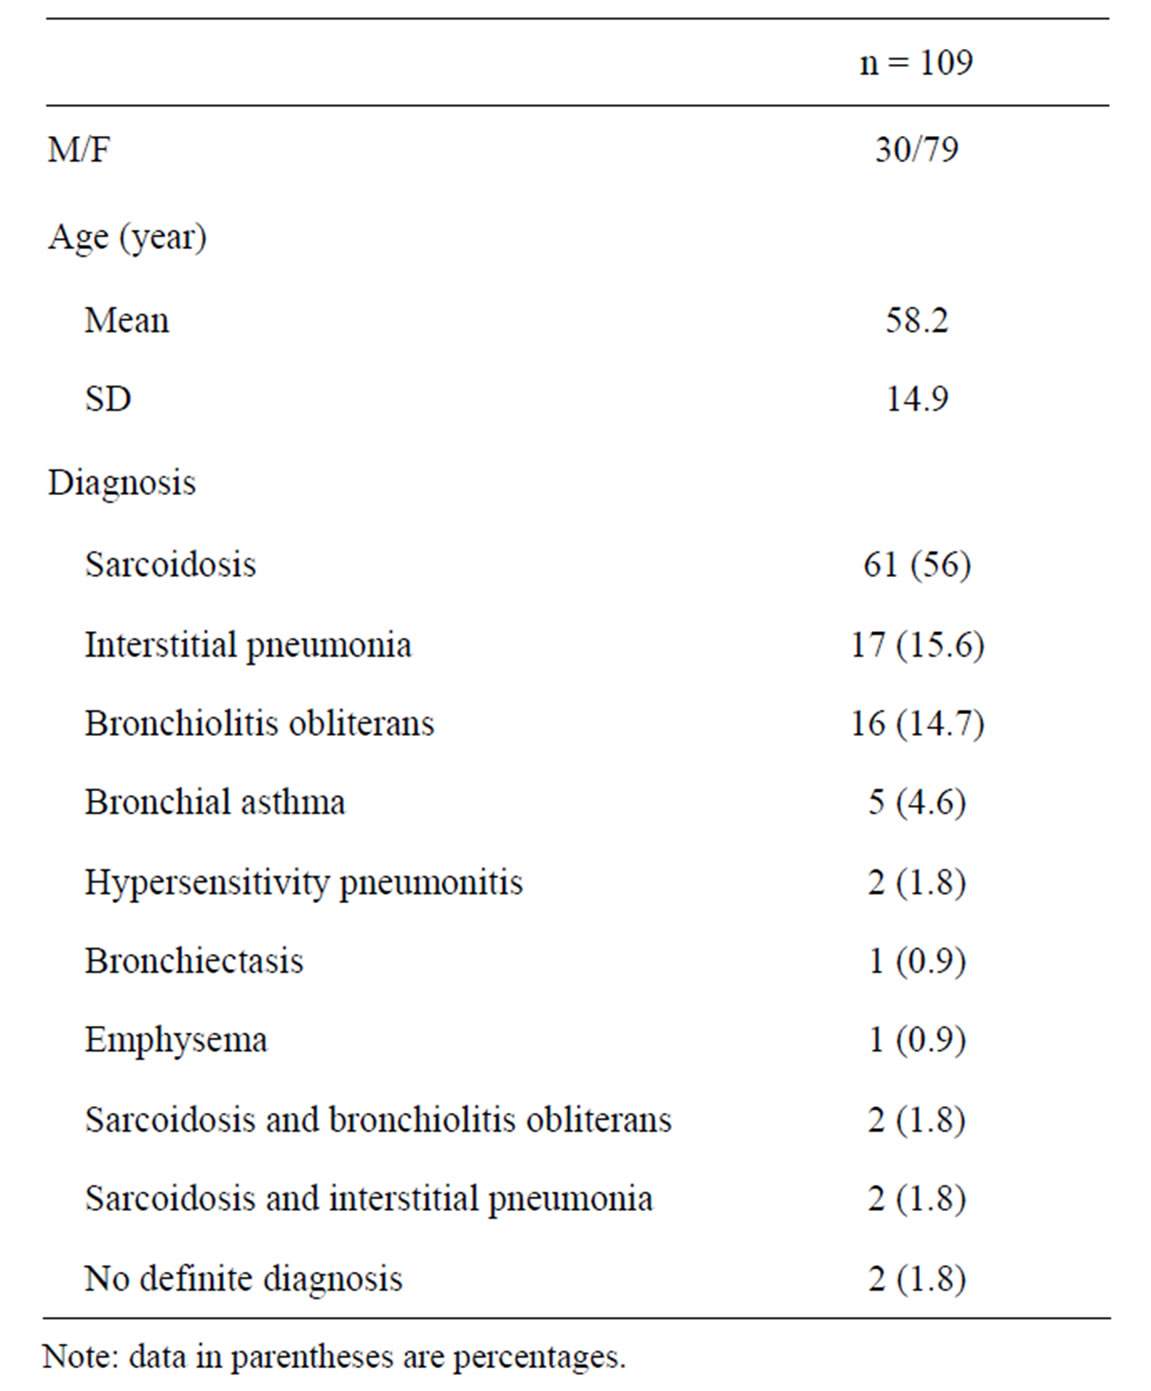
Table 1. Characteristics of the 109 patients.
carbon monoxide (DLco). Each result was obtained as an absolute value and predicted relative value based on the patient’s sex, age, and height [20].
2.3. CT Examinations
Thin-section CT examinations were performed with 1-mm collimation at 10-mm intervals from the lung apex to the diaphragm (n = 28), or volumetrically with a multidetector CT system with 1-mm reconstruction (n = 81). CT images were reconstructed using a high-spatial-frequency algorithm. All CT examinations were performed from the base to the apex of the lungs during a breath hold in the supine position at full suspended inspiration and expiration. The breath-holding technique was rehearsed with each patient before the CT examination. Images were captured at window settings that allowed for viewing of lung parenchyma (window level, –600 to –700 HU; window width, 1200 - 1500 HU), and mediastinum (window level, 20 - 40 HU; window width, 400 HU).
2.4. Evaluation of CT Images
Air trapping was considered to be present on expiratory CT images when lung regions failed to increase in attenuation, compared with corresponding inspiratory images (Figure 1). The scoring system used to assess the extent of air trapping was adapted from earlier studies 3 - 5 using a five-point scale: 0 = no air trapping visible, 1 = 1% - 25% of the cross-sectional area of lung affected, 2 = 26% - 50% affected, 3 = 51% - 75% affected, and 4 = 76% - 100% affected. Two radiologists (23 and 15 years of experience in chest CT image interpretation, respectively) who were unaware of the underlying diagnoses interpreted the CT images independently. The obtained air trapping score was then expressed as a mean value.
The Hounsfield units (HU) value was measured on CT images. A small area of approximately 3 mm2 was used to measure the HU attenuation value in focal regions that showed the most dominant increases on expiratory images and corresponding regions on inspiratory images. When air trapping was present, the HU value was measured in the expiratory and corresponding inspiratory air trapping regions. Each HU value was measured at least five times in a focal region. The highest and lowest values were eliminated to obtain an appropriate average. The obtained HU values were then expressed as a mean value.
To confirm the degree of breath holding, the lung volume was analyzed using volume analyzer. The rate of change in lung volume was expressed by dividing the volume at inspiration into the volume at expiration.
Volume analyses were performed by Fuji work station (Vincent, Tokyo, Japan).
 (a)
(a)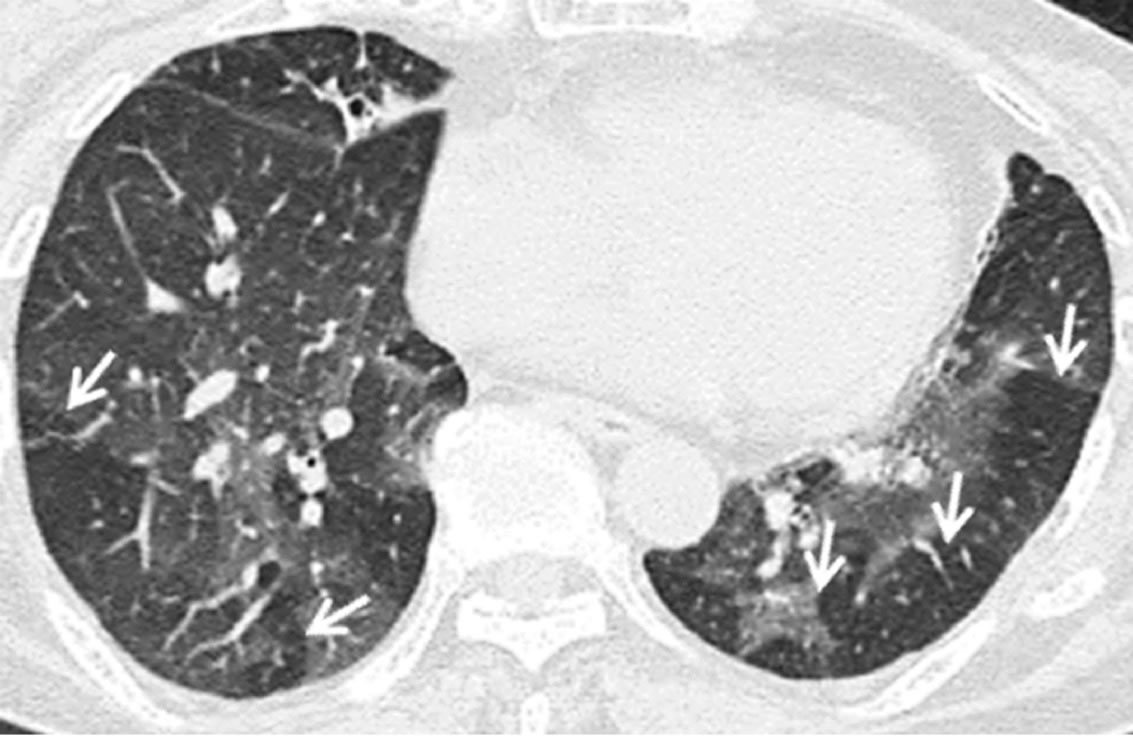 (b)
(b)
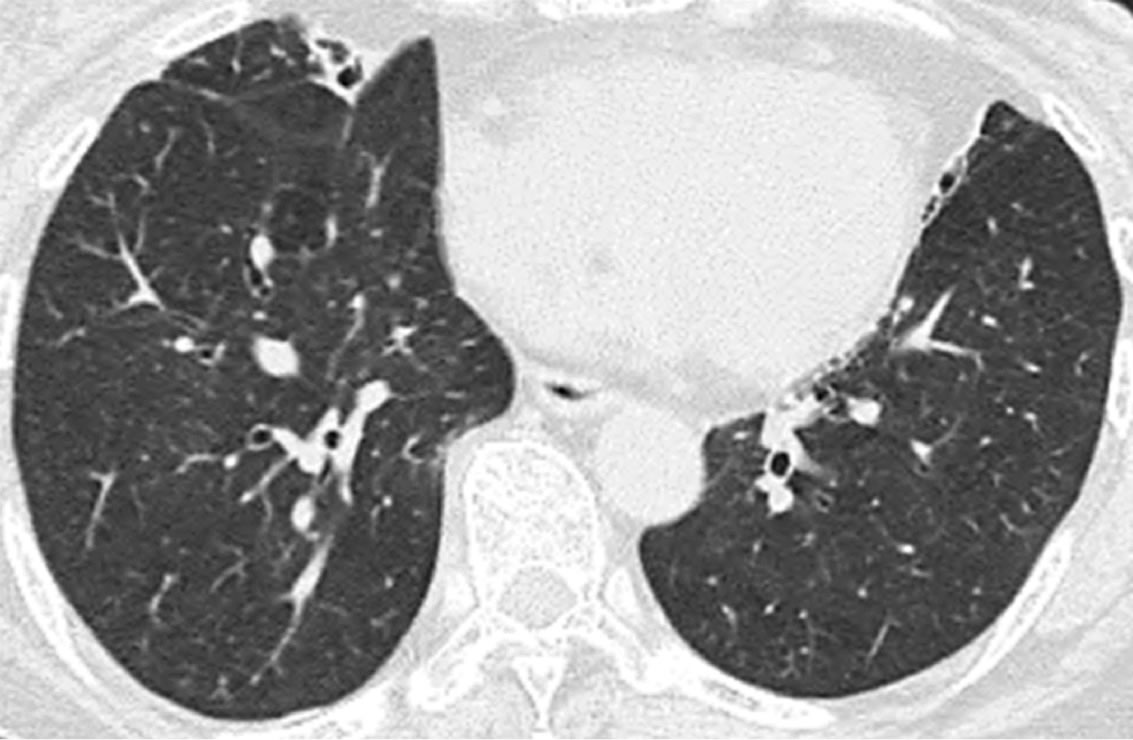
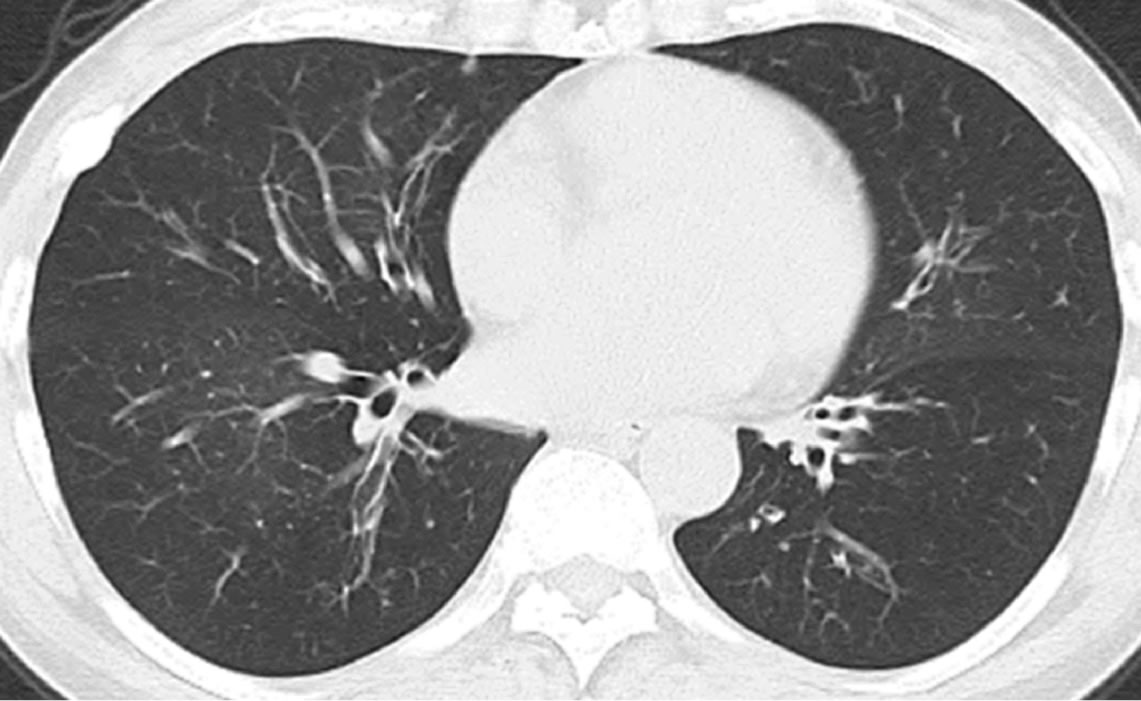
Figure 1. Transverse thin-section CT (1 mm thickness) scans in a 73-year-old woman with bronchiolitis obliterans. (a) Inspiratory scan at the level of the lower lobes shows no particular mosaic perfusion; (b) Expiratory scan at the same level shows multiple lobular areas of air trapping, shown as sharply demarcated lobular low attenuation (arrows).
2.5. Data Analysis
To assess the features of presentation of air trapping, all variables (age, sex, indices of pulmonary function test results, air trapping score, HU value, and rate of change in lung volume) were compared in differed cohorts. One was divided by diagnosis, and the other was divided by air trapping findings. Differences in diagnoses were accepted to ascertain the feature of diagnosis that may overlap the results for affecting factors of air trapping. In the diagnosis cohort, diagnoses with less than five patients were excluded because they were not suitable for statistical analysis. The air trapping cohort was divided according to air trapping score, wherein “absence” included the score 0 and “presence” included scores 1 to 3.
To ascertain the relationship between pulmonary function test results and HU attenuation change, the correlation between pulmonary function test results and expiratory HU values was analyzed. To confirm the degree of breath holding, lung volume was compared with the corresponding index of pulmonary function tests; that is, inspiratory lung volume was compared with TLC, and expiratory lung volume was compared with RV.
Differences in mean value were analyzed with the Z-test, and differences in groups were analyzed with Mann-Whitney’s U test and Student’s t test. Pearson’s correlation coefficient was conducted to analyze the correlation between pulmonary function test results and HU values. Simple regression analysis was conducted when correlation showed significance. A p value of <0.05 was considered statistically significant. Statistical analyses were performed with SPSS (version 19.0; Tokyo, Japan).
3. Results
3.1. Variables by Diagnosis Cohort
In the diagnosis cohort (Table 2), age was youngest for bronchial asthma (p < 0.001), and oldest for interstitial pneumonia (p < 0.01). In the pulmonary function test results, TLC and RV were lowest for interstitial pneumonia (p < 0.001 and p < 0.01, respectively), and FEV1.0, FEV1.0/FVC, and MEF50 were lowest for bronchiolitis obliterans (p < 0.001). DLco was lowest for interstitial pneumonia (p < 0.001) and highest for bronchial asthma (p < 0.01). The air trapping score showed no significant differences in the cohort, although it was highest for interstitial pneumonia (1.18 ± 1.1) and lowest for bronchial asthma (0.6 ± 1). The HU attenuation value was highest for interstitial pneumonia and lowest for bronchiolitis obliterans. The rate of change in lung volume was lowest for bronchiolitis obliterans (p < 0.001).
3.2. Variables by Air Trapping Findings Cohort
In air trapping findings cohort (Table 3), significant differences were shown in age, FEV1.0/FVC, MEF50, HU attenuation at normal regions’ inspiration and expiration, and rate of change in lung volume (p < 0.01, p < 0.001, p = 0.02, p < 0.001, p < 0.001, and (p < 0.001, respectively).
The other variables (sex, diagnoses, and the other induces of pulmonary function test results) showed no significant differences.
3.3. Correlation between Pulmonary Function Tests and Expiratory HU Value
Pearson’s correlation coefficient between pulmonary function test results and expiratory HU value is shown in Table 4. The HU value showed a significant positive correlation with FEV1.0/FVC (r = 0.501, p < 0.0001) and MEF50 (r = 0.421, p < 0.0001) and a negative correlation with DLco (r = −0.499, p < 0.0001). FEV1.0 showed a weak positive correlation (r = 0.303, p < 0.01), but not to the rest (VC, FVC, TLC, and RV). Simple regression
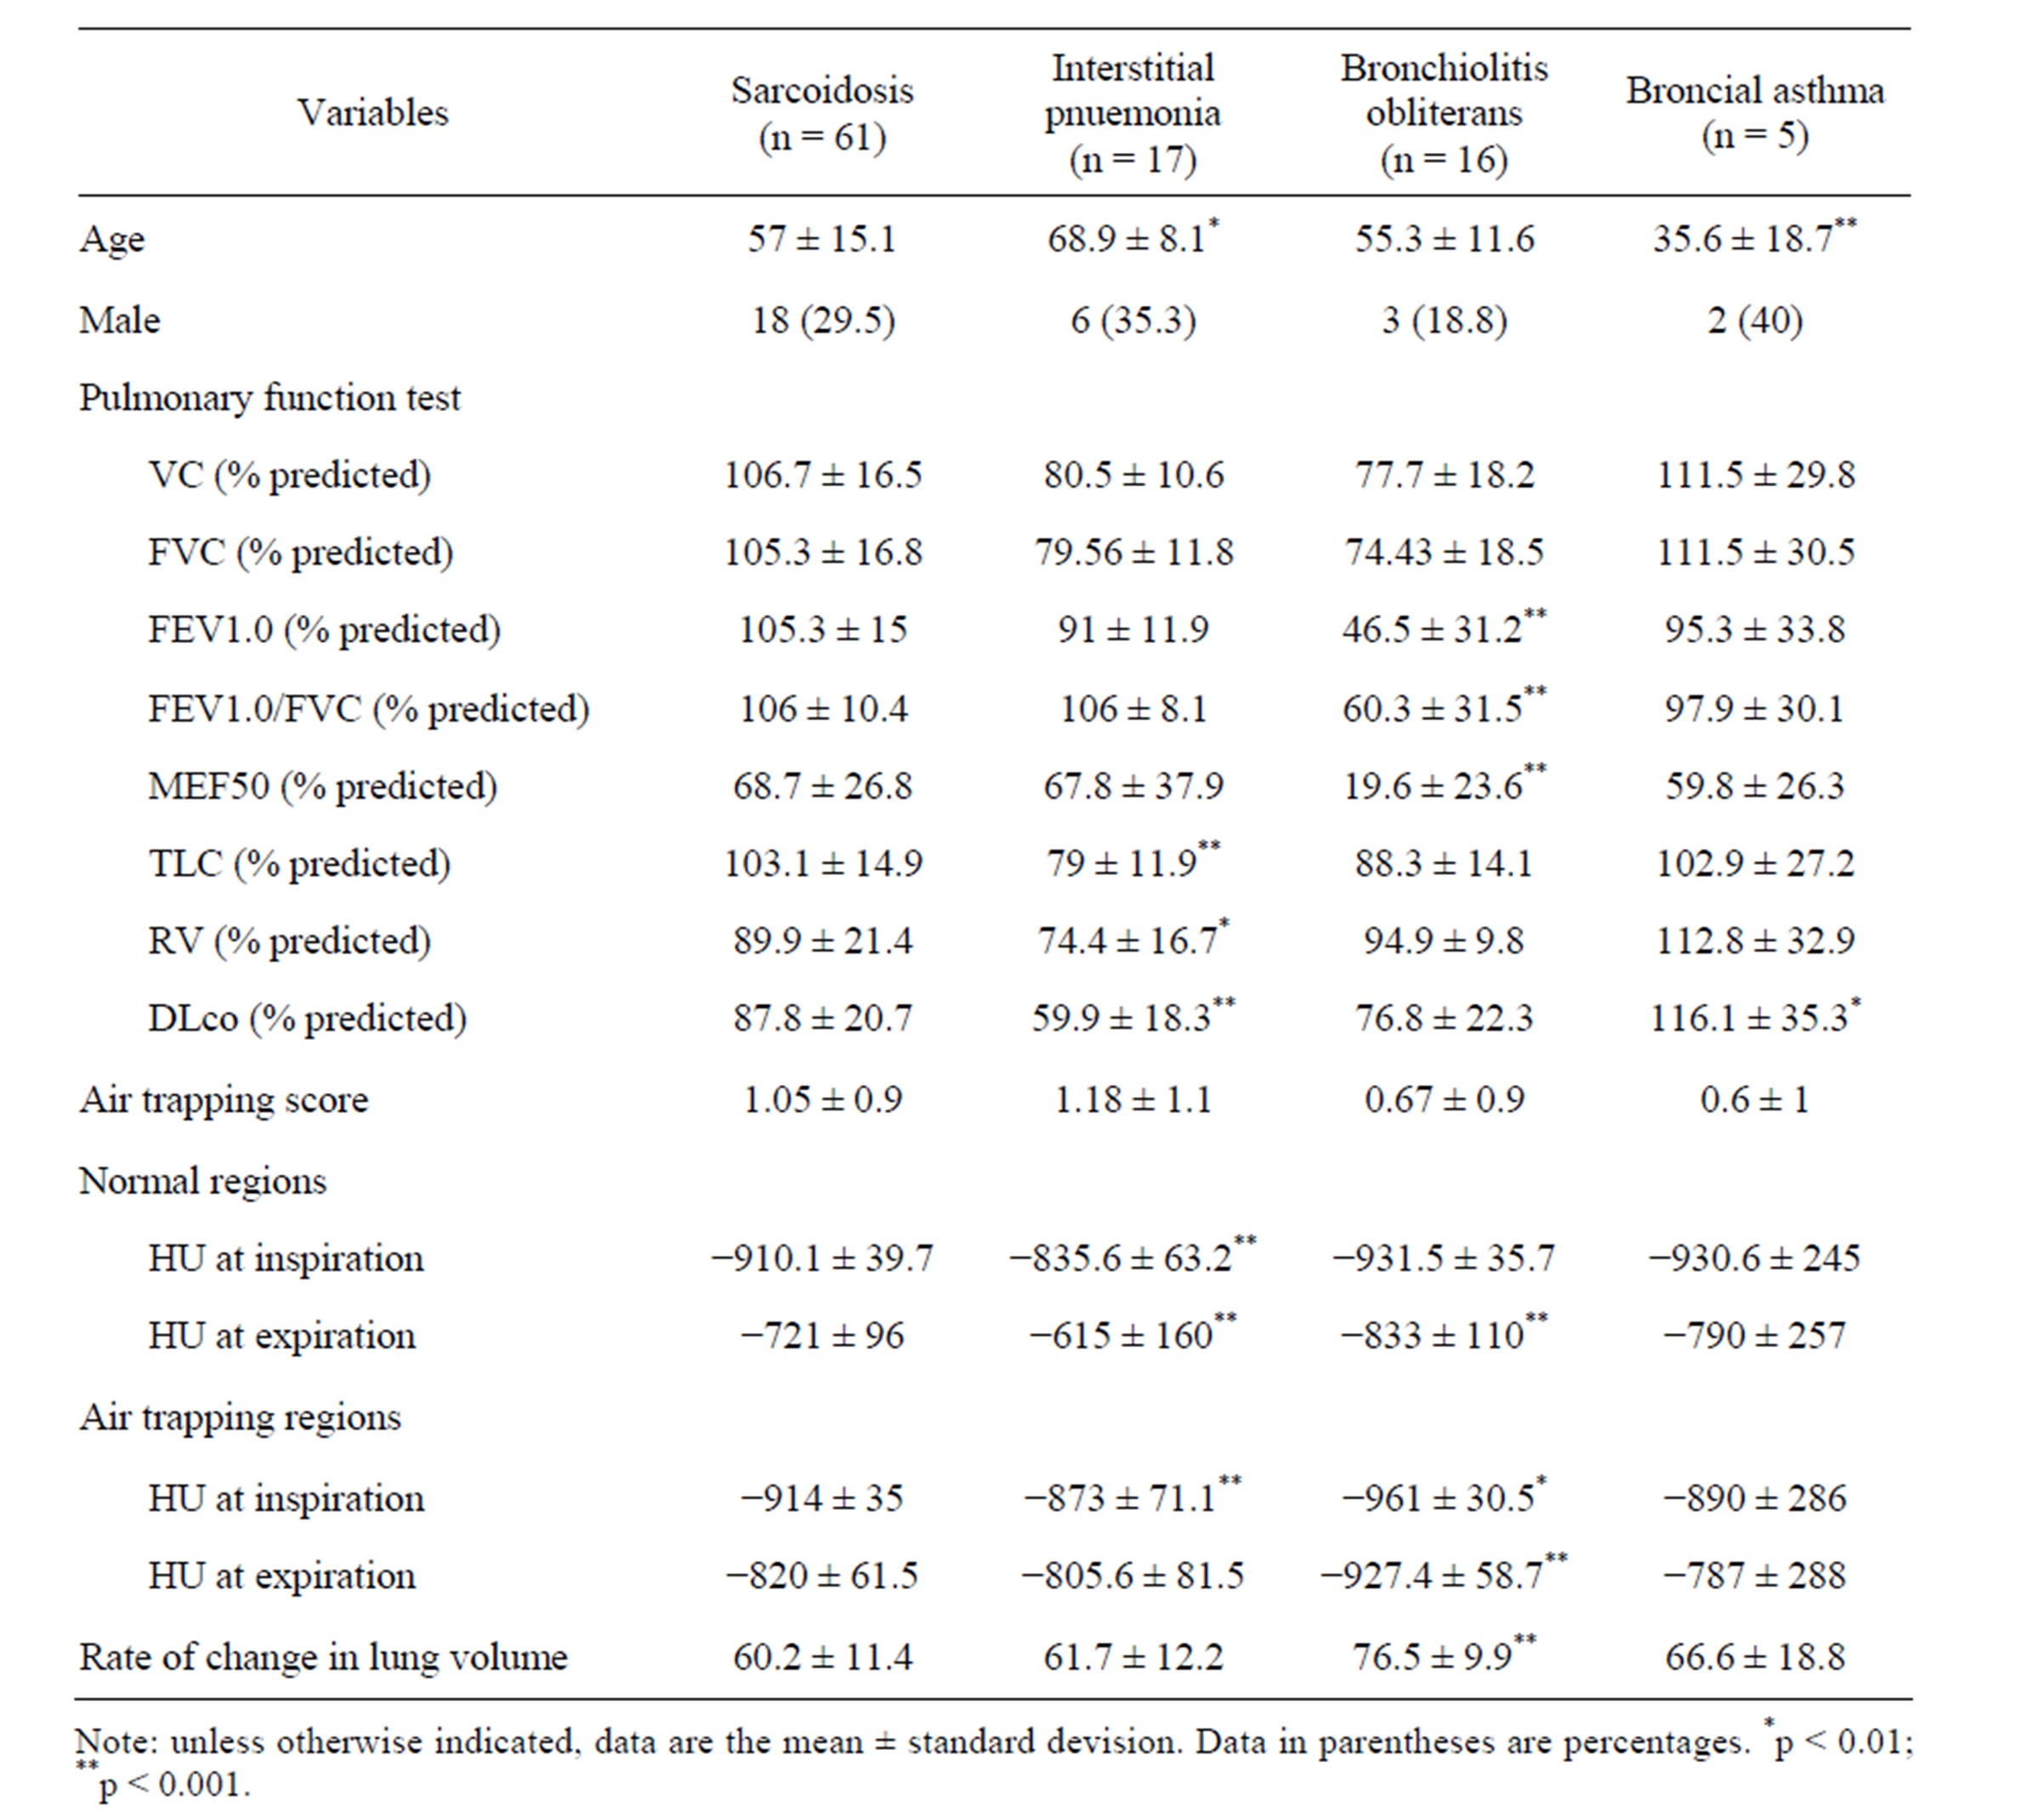
Table 2. Variables by diagnosis cohort.
analysis was conducted for FEV1.0/FVC, MEF50, DLco, and FEV1.0 to confirm the linear relationship. The expiratory HU value showed a linear relationship to FEV1.0/FVC (R2 = 0.251) (Figure 2) and DLco (R2 = 0.249) (Figure 3), but not to MEF (R2 = 0.178) or FEV1.0 (R2 = 0.092).
3.4. Correlation between TLC or RV and Lung Volume
Simple regression analysis showed a significant linear relationship between TLC and inspiratory lung volume (R2 = 0.934) (Figure 4). The correlation was confirmed using Pearson’s correlation coefficient, which showed significance (r = 0.966, p < 0.0001). RV showed a weak linear relationship to expiratory lung volume (R2 = 0.314) (Figure 5). Correlation by Pearson’s correlation coefficient was also weak (r = 0.56, p < 0.001).
4. Discussion
Variables by diagnosis cohort indicated that the features were the lowest TLC, RV, and DLco for interstitial
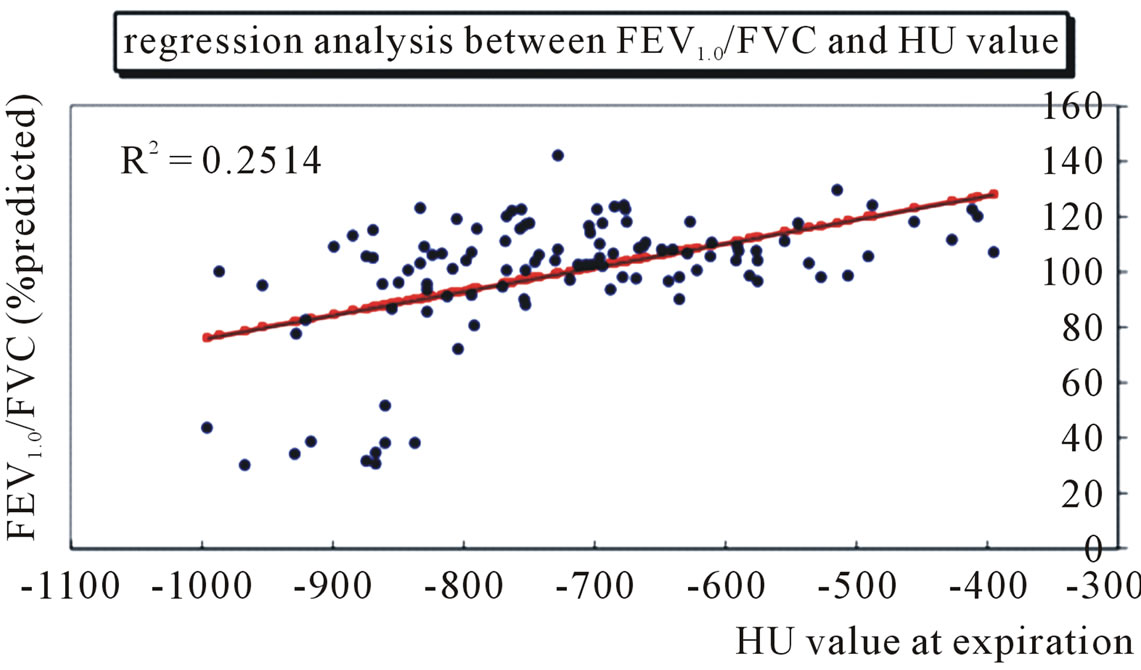
Figure 2. The HU value on expiratory CT images shows a significant relationship to predicted ratio of forced expiratory volume in 1 second to forced vital capacity (%FEV1.0/FVC) in a single regression analysis in 109 patients.
pneumonia and the lowest FEV1.0, FEV1.0/FVC, and MEF50 for bronchiolitis obliterans. Mostly, these features may represent each diagnosis’ characteristics because the former is known as a “restrictive” and the latter as an “obstructive” pattern in pulmonary function [21]. The
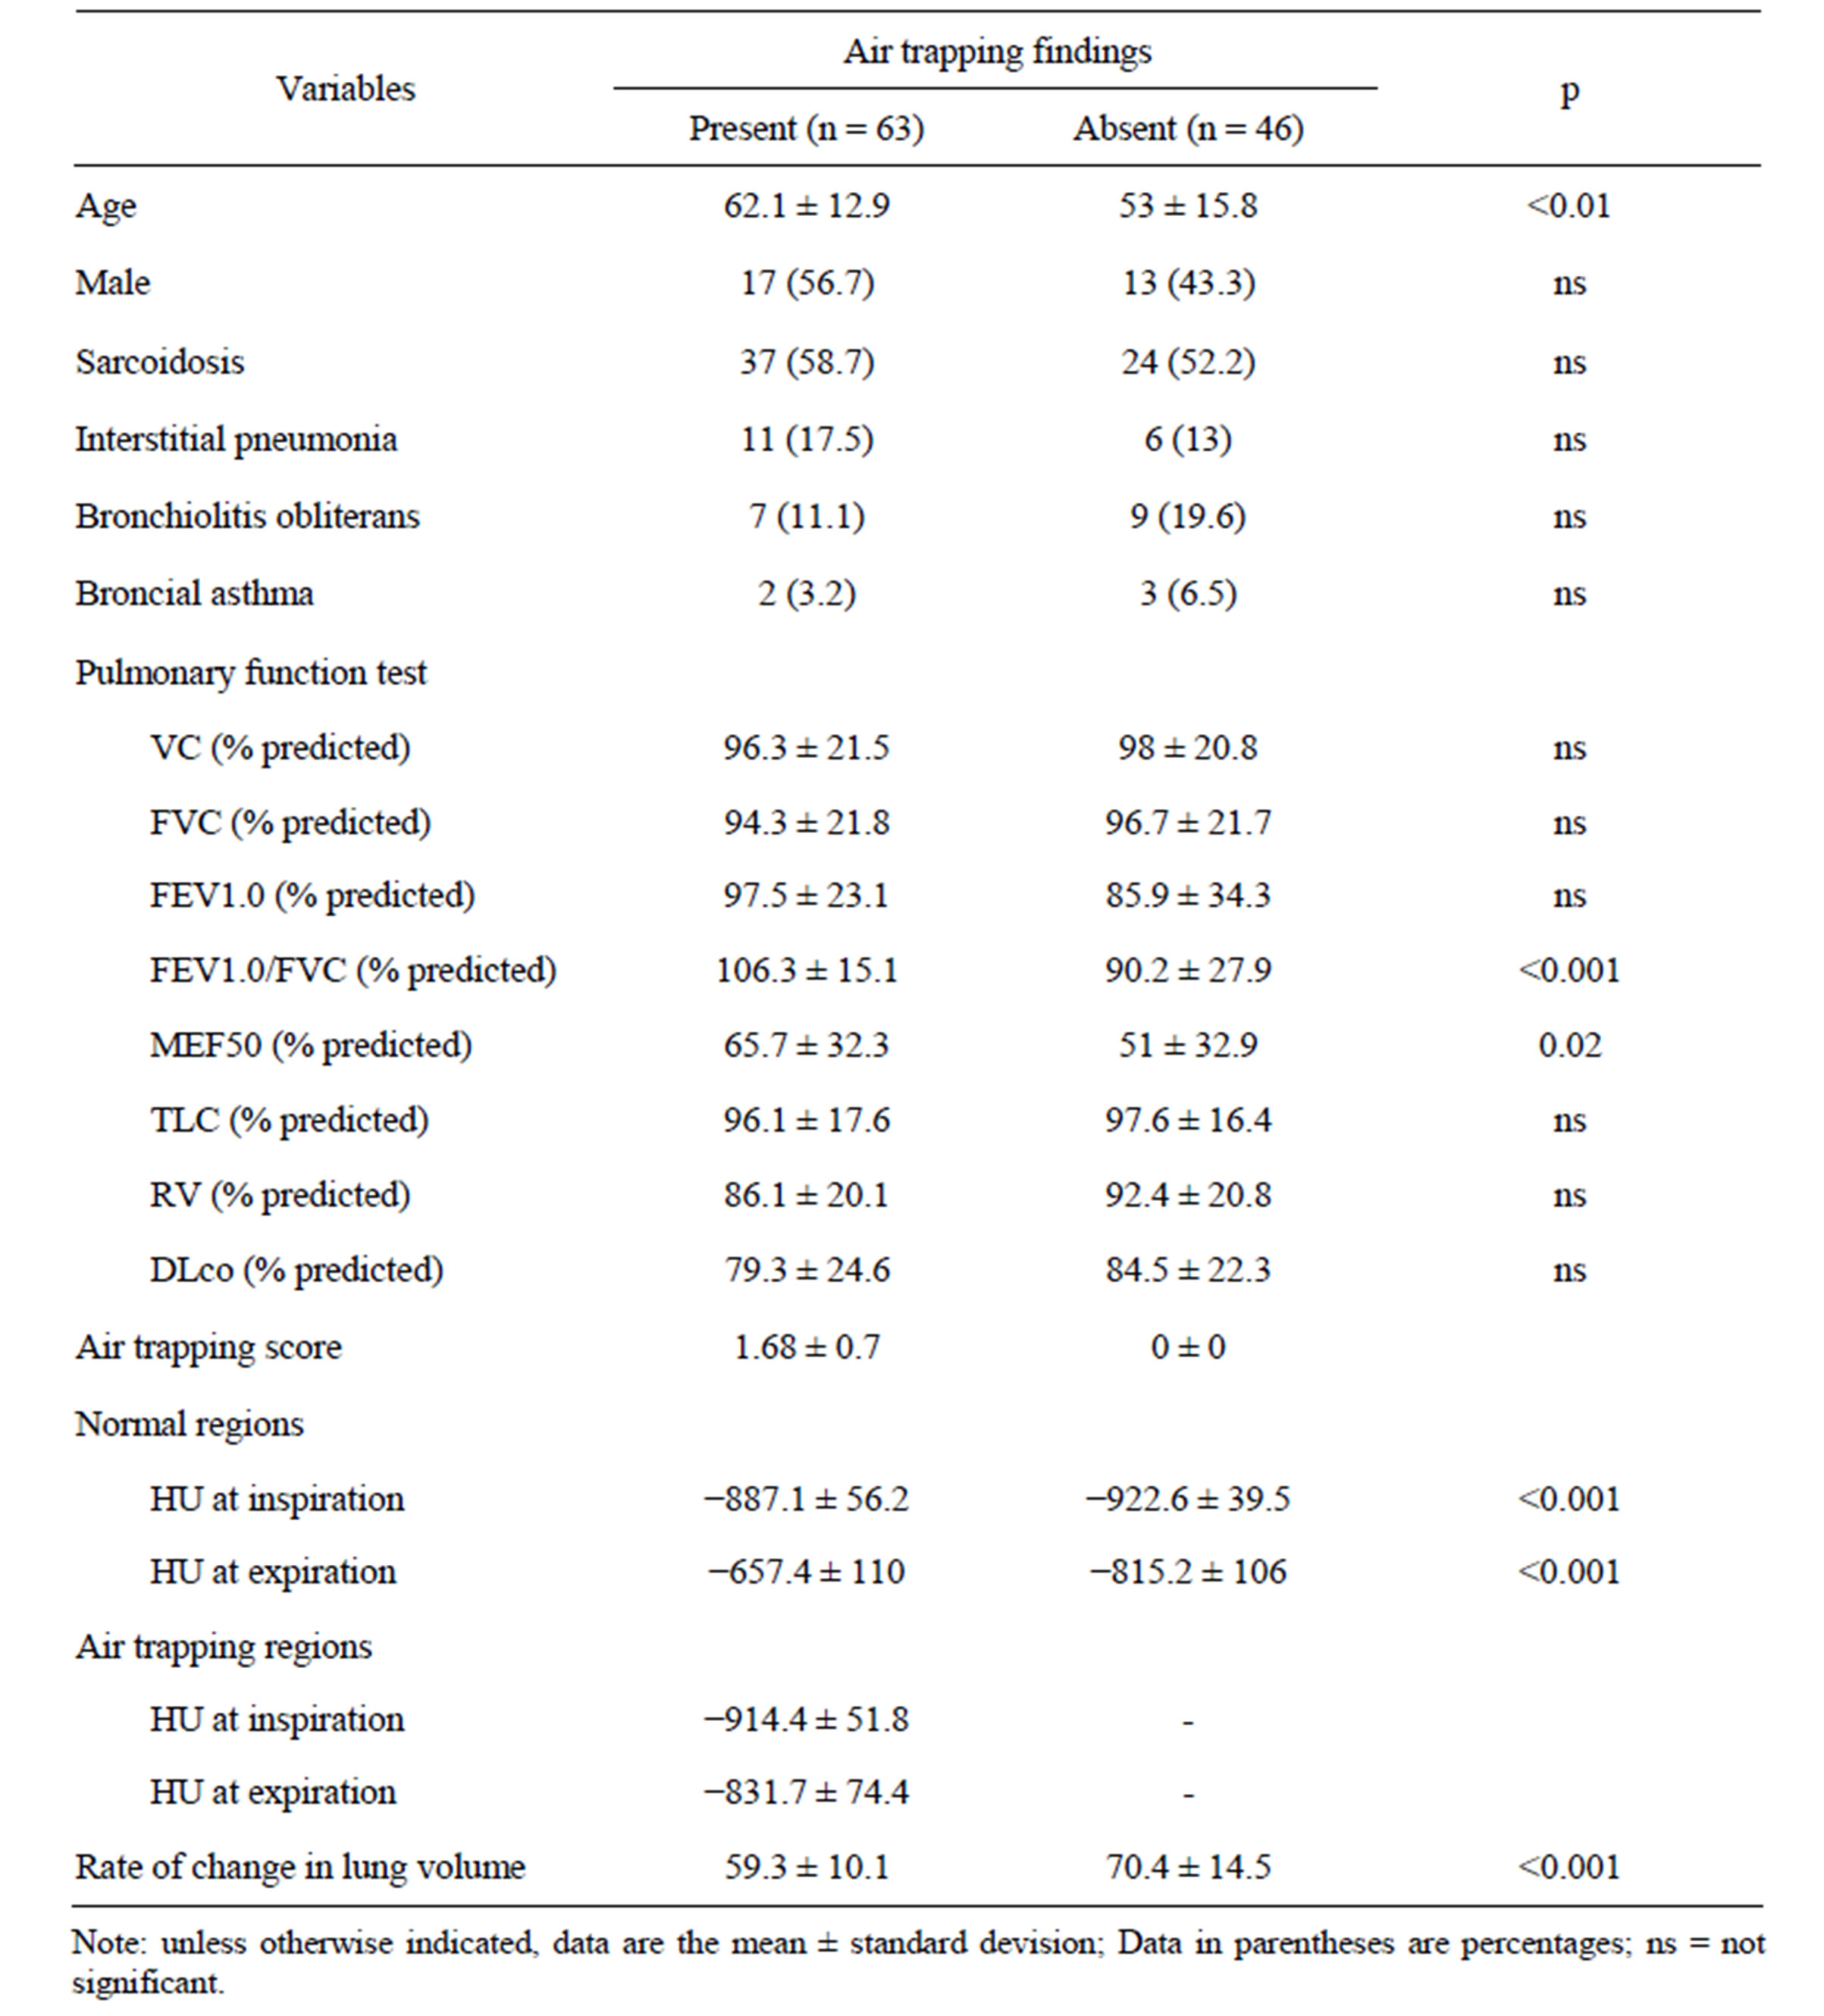
Table 3. Variables by air trapping findings cohort.
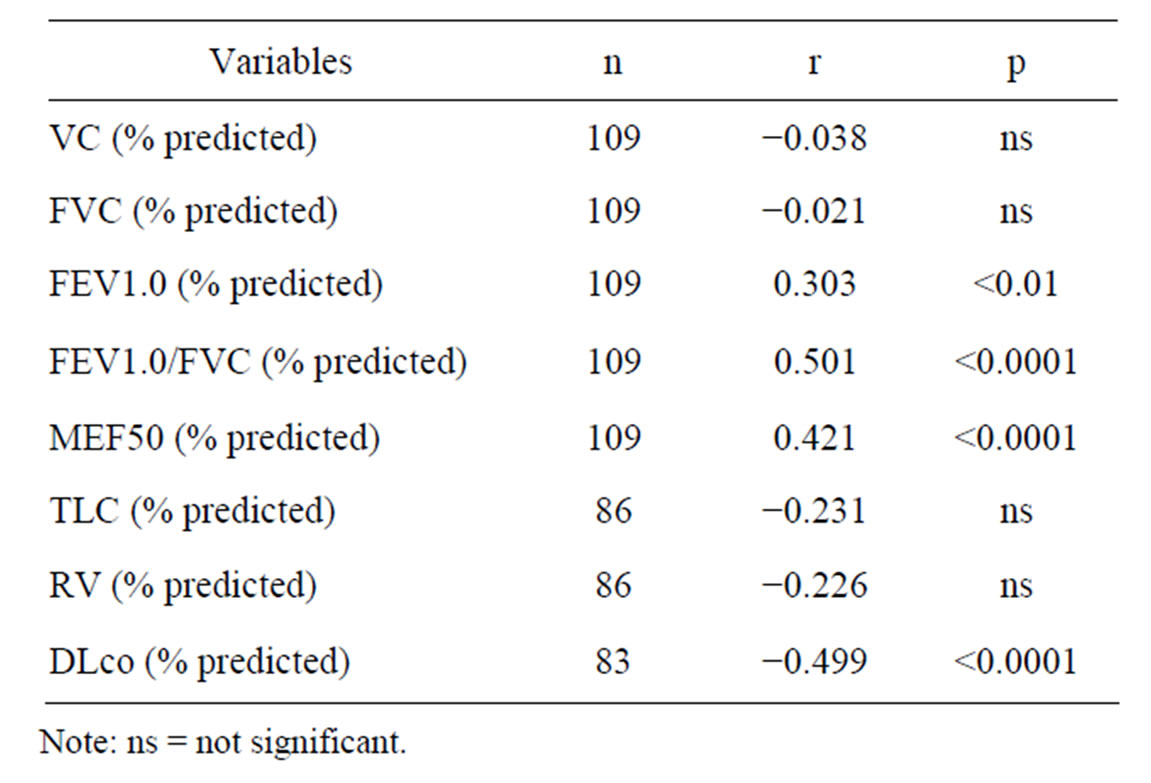
Table 4. Pearson’s correlation coefficient between pulmonary function tests and expiratory HU value.
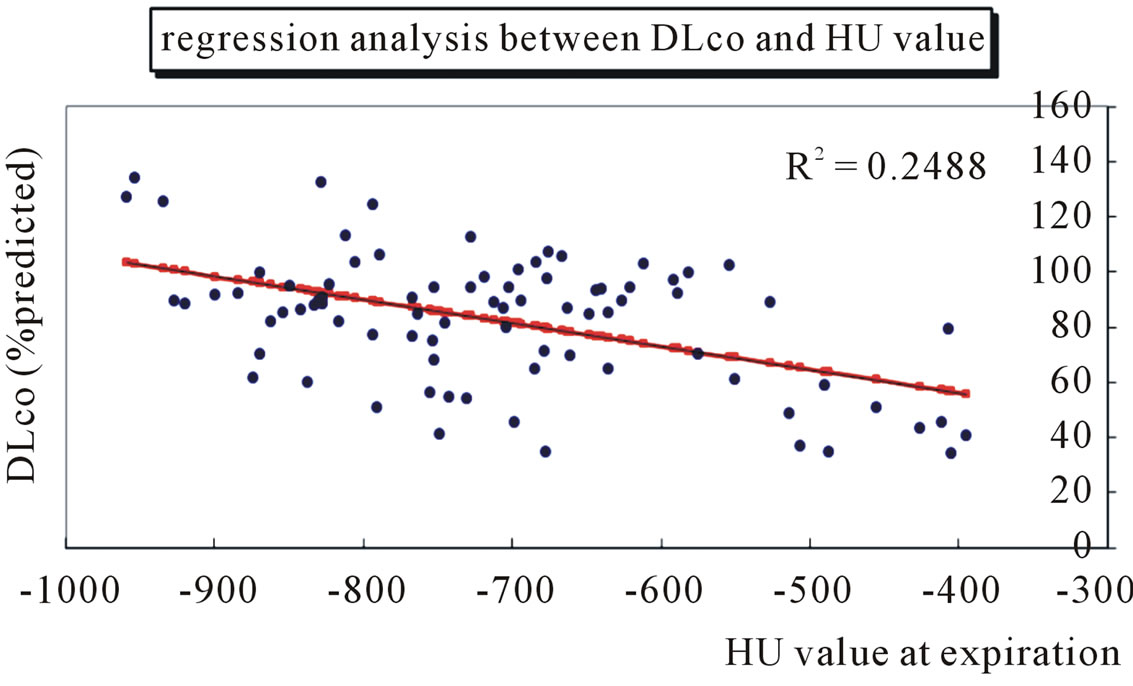
Figure 3. The HU value on expiratory CT images shows a significant relationship to predicted diffusion capacity for carbon monoxide (%DLco) in a single regression analysis in 83 patients.
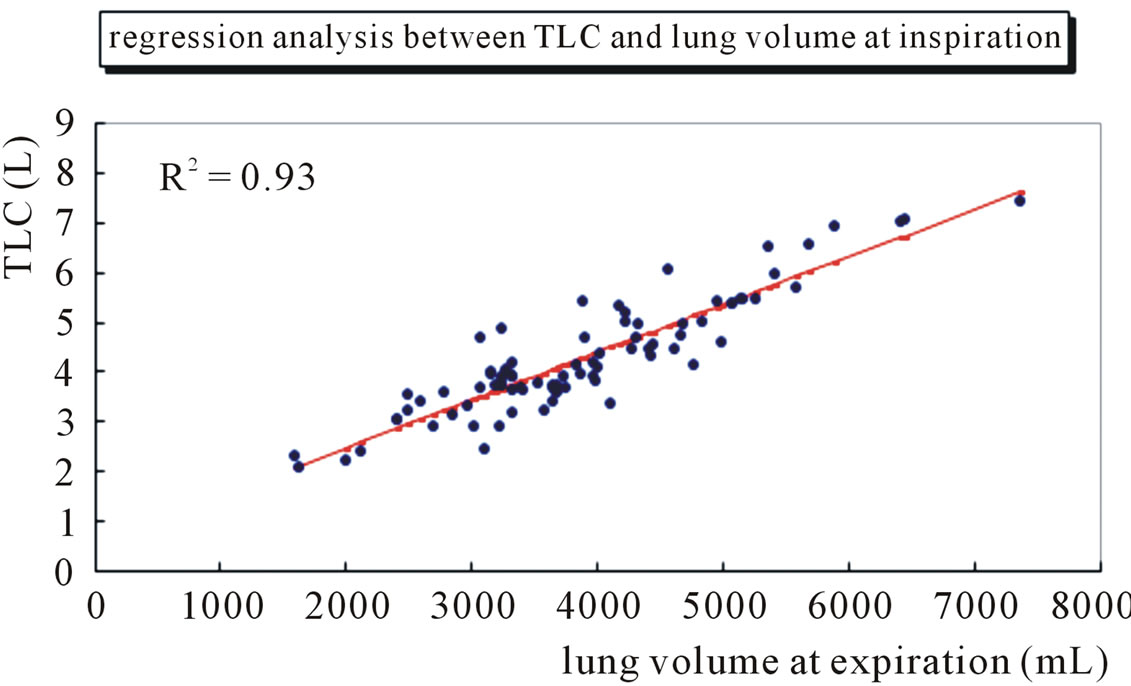
Figure 4. The lung length at inspiration shows a significant relationship to total lung capacity (TLC) in a single regression analysis in 86 patients.
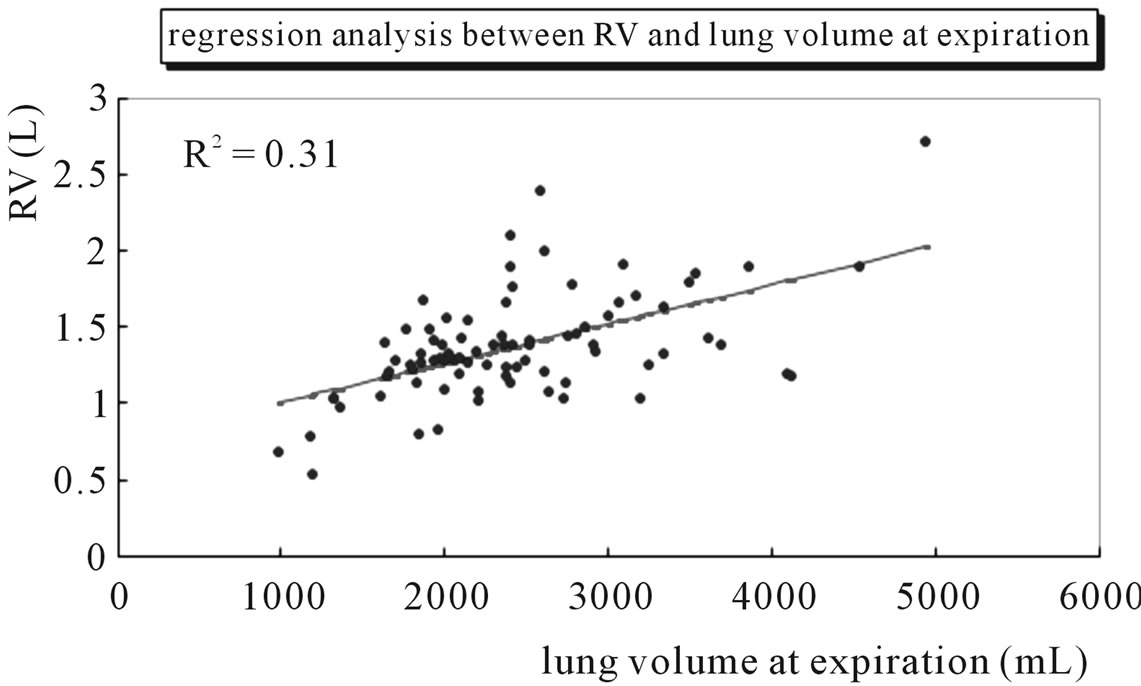
Figure 5. The lung length at expiration shows a significant relationship to residual volume (RV) in a single regression analysis in 86 patients.
noticeable finding in this study was that the HU attenuation value was highest for interstitial pneumonia and lowest for bronchiolitis obliterans.
Variables by air trapping findings cohort indicated that the features for presenting air trapping were FEV1.0/FVC, MEF50, HU attenuation at normal regions, and rate of change in lung volume. Regarding the evaluation of air trapping on CT images, there have been many literature reported about the comparison between CT findings and pulmonary function tests, and there still appears to be no agreement in the results [3-11]. In our study, regression analysis showed a significant linear relationship between TLC and inspiratory lung volume, but a weak relationship between RV and expiratory lung volume. This result showed that inspiratory lung volume reflected the individual’s lung volume, whereas expiratory lung volume did not reflect it well. Because the depiction of air trapping depends on the degree of expiration [22], it does not show any correlation with volumetric variables such as VC, FVC, TLC, and RV.
On contrary, the expiratory HU value showed a significantly positive correlation to FEV1.0/FVC. This was supported in some previous studies that FEV1.0/FVC had a stronger correlation with air trapping findings [6,8]. If a patient exhaled strongly in 1 s, which may be very similar to the situation during expiratory CT scans, the FEV1.0/FVC ratio could approach to 1.0 and the lungs would be adequately compressed. Actually, higher attenuation can be better seen in compressed lungs [15]. Therefore, as a result of the degree of compression, FEV1.0/FVC shows a strong correlation with the expiratory HU value.
Basically, decreased attenuation on CT images is characterized by an altered ratio of three components: air, blood, and tissue [21]. Obstruction of the bronchiolar lumen results in hypoxia of the underventilated lungs, which leads to blood flow reduction to the affected areas and blood flow redistribution to areas of normal lung [18,19]. However, concerning the effect of blood flow distribution, Jung et al. reported no changes in lung attenuation due to obstruction of the pulmonary arteries in their experimental study [23]. Furthermore, in terms of the effect of air space, the cytoplasm of the alveolar wall is only 450 Å to 600 Å thick [24], whereas spatial resolution using the highest-resolution technique was reportedly 0.25 mm for 64-row multi detector CT [25]. This means that it seems to be difficult to confirm changes on CT images even if the 5000 collapsed alveoli were piled on at one time. Therefore, we focused on the tissue, since the interstitial parenchyma is a key factor in attenuation change.
Our study indicated that there were significant positive correlations to FEV1.0/FVC and a negative correlation to DLco compared with expiratory HU attenuation, which was confirmed by simple regression analysis.
The DLco represents the alveolar to vascular diffusion ability and worsens when the thickness of the parenchymal interstitial space increases [26]. Thickness of interstitial parenchyma is commonly referred to as fibrosis, and fibrotic interstitial parenchyma is characterized by difficulty of compression. However, if the effect of fibrosis is only referred to by the difficulty of compression, an expiratory HU value should decrease when the DLco value decreases as higher attenuation can be better seen in compressed lungs [15]. In our study, DLco showed a significant negative correlation to the expiratory HU value, which means that the thicker the interstitial parenchyma (or the lower the DLco value), the higher the expiratory HU value. Indeed, this study showed that the HU attenuation value was highest for interstitial pneumonia even though the rate of change in lung volume was not small in this diagnosis. Therefore, we also propose that DLco, a determinant for the degree of fibrosis, be considered as an affecting factor of air trapping.
Previous studies have reported age [8,18], smoking [18,27], longer duration of asthma [8,18], a clinical history of pneumonia [8], and gravitational gradient [15] as factors influencing the frequency of air trapping. Our study further indicated 4 factors as influencing the frequency of air trapping: FEV1.0/FVC, DLco, HU attenuation, and rate of change in lung volume. The abovementioned factors can be divided according to two elements: pressure and fibrosis. The former consists of gravitational gradient, FEV1.0/FVC, and the rate of change in lung volume; the latter consists of age, smoking, diagnosis of asthma or pneumonia, and DLco because advanced fibrosis occurs as a result of inflammation or age. As seen in the bronchiolitis obliterans shown in this study, lower HU attenuation at normal regions and lower rates of change in lung volume sometimes induce difficulty in perceiving abnormalities (Figure 6). As a cause of heterogeneous attenuation, it can be suggested that lung attenuation increases when fibrosis is advanced, and this is exaggerated when lungs are compressed. Therefore, air trapping could be better depicted when adjacent normal parenchyma achieves higher attenuation by advanced fibrosis and deep expiration.
 (a)
(a)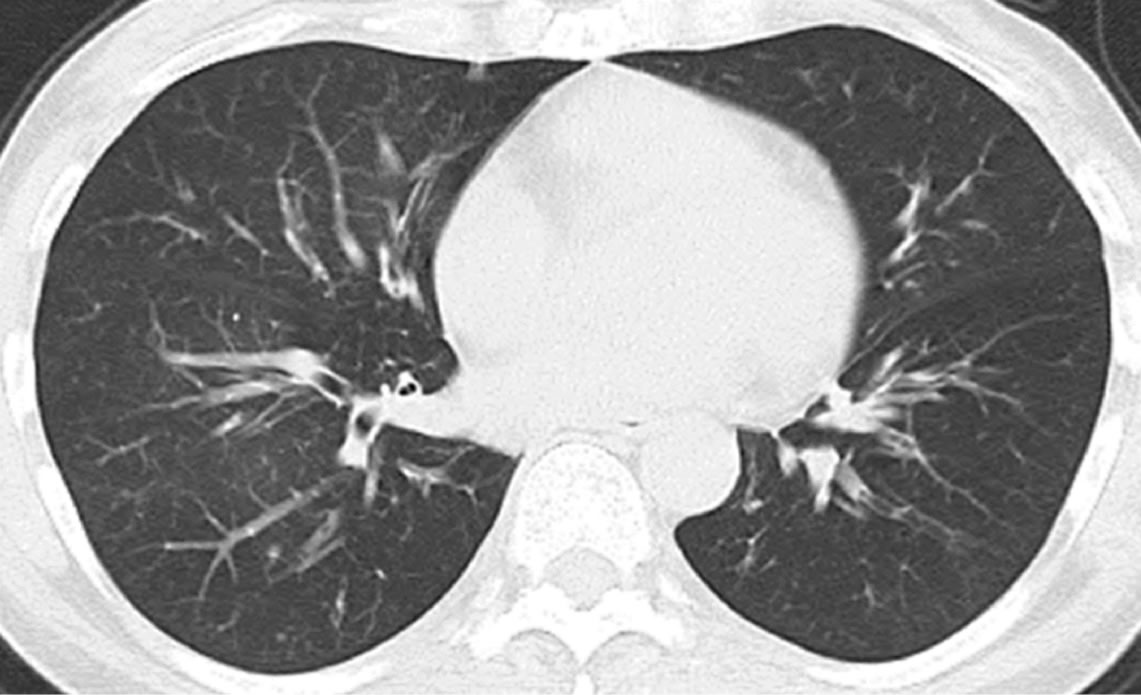 (b)
(b)
Figure 6. Bronchiolitis obliterans in a 54-year-old woman. Transverse thin-section CT (1 mm thickness) of the lower lobes shows no particularly mosaic perfusion on (a) Inspiratory and (b) Expiratory images. The rate of lung changes is 108.3. Predicted forced expiratory volume in one second (FEV1.0) is 38.7%. The values of expiratory flow at 50% and 75% vital capacity (MEF50 and MEF75) show severe airway obstruction (0.18 l/s and 0.1 l/s. respectively).
Our study had limitations. First, our stimulated influential factors were conducted by comparisons of cohorts, which were not stable in number in divided groups. A larger sample size would have provided more confirmatory analysis results.
Second, we measured the HU value of lung attenuation in a small area, which showed most dominant changes during inspiration and expiration. Even though this focal area may not reflect the whole lung, it is meaningful that the results are well matched to the pulmonary function test results. One reason could be suggested that the focal area, as showing a good reflection of changing lung volume, may represent the individual’s lung function. Further comparison with a multivariate analysis as measured by quantitative CT analysis should assist in confirming our results.
In conclusion, expiratory HU attenuation showed a significantly positive correlation to FEV1.0/FVC and negative correlation to DLco, which would have resulted in two elements: pressure and fibrosis. As a cause of heterogeneous attenuation, air trapping could be better depicted when the adjacent normal parenchyma obtains higher attenuation by advanced fibrosis and deep expiration.
5. Acknowledgements
The authors would like to thank Christian C. Mercado for editing this paper.
REFERENCES
- A. Devakonda, S. Raoof, A. Sung, W. D. Travis and D. Naidich, “Bronchiolar Disorders: A Clinical-Radiological Diagnostic Algorithm,” Chest, Vol. 137, No. 4, 2010, pp. 938-951. doi:10.1378/chest.09-0800
- E. J. Stern, N. L. Müller, S. J. Swensen and T. E. Hartman, “CT Mosaic Pattern of Lung Attenuation: Etiologies and Terminology,” Journal of Thoracic Imaging, Vol. 10, No. 4, 1995, pp. 294-297.
- H. Arakawa, P. A. Gevenois, Y. Saito, H. Shida, V. De Maertelaer, H. Morikubo and M. Fujioka, “Silicosis: Expiratory Thin-Section CT Assessment of Airway Obstruction,” Radiology, Vol. 236, No. 3, 2005, pp. 1059-1066. doi:10.1148/radiol.2363041611
- E. S. Lee, M. B. Gotway, G. P. Reddy, J. A. Golden, F. M. Keith and W. R. Webb, “Early Bronchiolitis Obliterans Following Lung Transplantation: Accuracy of Expiratory Thin-Section CT for Diagnosis,” Radiology, Vol. 216, No. 2, 2000, pp. 472-477.
- H. Arakawa and W. R. Webb, “Air Trapping on Expiratory High-Resolution CT Scans in the Absence of Inspiratory Scan Abnormalities: Correlation with Pulmonary Function Tests and Differential Diagnosis,” American Journal of Roentgenology, Vol. 170, No. 5, 1998, pp. 1349-1353.
- C. F. Yang, M. T. Wu, A. A. Chiang, R. S. Lai, C. Chen, W. M. Tiao, T. C. McLoud, J. S. Wang and H. B. Pan, “Correlation of High-Resolution CT and Pulmonary Function in Bronchiolitis Obliterans: A Study Based on 24 Patients Associated with Consumption of Sauropus Androgynous,” American Journal of Roentgenology, Vol. 168, No. 4, 1997, pp. 1045-1050.
- D. M. Hansell, A. U. Wells, M. B. Rubens and P. J. Cole, “Bronchiectasis: Functional Significance of Areas of Decreased Attenuation at Expiratory CT,” Radiology, Vol. 193, No. 2, 1994, pp. 369-374.
- A. Busacker, J. D. Newell, T. Keefe, E. A. Hoffman, J. C. Granroth, M. Castro, S. Fain and S. Wenzel, “A Multivariate Analysis of Risk Factors for the Air-Trapping Asthmatic Phenotype as Measured by Quantitative CT Analysis,” Chest, Vol. 135, No. 1, 2009, pp. 48-56. doi:10.1378/chest.08-0049
- D. M. Hansell, M. B. Rubens, S. P. Padley and A. U. Wells, “Obliterative Bronchiolitis: Individual CT Signs of Small Airways Disease and Functional Correlation,” Radiology, Vol. 203, No. 3, 1997, pp. 721-726.
- H. R. Roberts, A. U. Wells, D. G. Milne, M. B. Rubens, J. Kolbe, P. J. Cole and D. M. Hansell, “Airflow Obstruction in Bronchiectasis: Correlation between Computed Tomography Features and Pulmonary Function Tests,” Thorax, Vol. 55, No. 3, 2000, pp. 198-204. doi:10.1136/thorax.55.3.198
- P. A. Gevenois, P. de Vuyst, M. Sy, P. Scillia, L. Chaminade, V. de Maertelaer, J. Zanen and J. C. Yernault, “Pulmonary Emphysema: Quantitative CT during Expiration,” Radiology, Vol. 199, No. 3, 1996, pp. 825-829.
- A. A. Bankier, C. Schaefer-Prokop, V. de Maertelaer, D. Tack, P. Jaksch, W. Klepetko and P. A. Gevenois, “Air Trapping: Comparison of Standard-Dose and Simulated Low-Dose Thin-Section CT Techniques,” Radiology, Vol. 242, No. 3, 2007, pp. 898-906. doi:10.1148/radiol.2423060196
- O. Lucidarme, P. A. Grenier, M. Cadi, I. Mourey-Gerosa, K. Benali and P. Cluzel, “Evaluation of Air Trapping at CT: Comparison of Continuousversus Suspended-Expiration CT Techniques,” Radiology, Vol. 216, No. 3, 2000, pp. 768-772.
- E. J. Stern, W. R. Webb, M. L. Warnock and C. J. Salmon, “Bronchopulmonary Sequestration: Dynamic, Ultrafast, High-Resolution CT Evidence of Air Trapping,” American Journal of Roentgenology, Vol. 157, No. 5, 1991, pp. 947-949.
- A. A. Bankier, M. Estenne, D. Kienzl, C. Müller-Mang, A. Van Muylem and P. A. Gevenois, “Gravitational Gradients in Expiratory Computed Tomography Examinations of Patients with Small Airways Disease: Effect of Body Position on Extent of Air Trapping,” Journal of Thoracic Imaging, Vol. 25, No. 4, 2010, pp. 311-319.
- S. P. Padley, B. D. Adler, D. M. Hansell and N. L. Müller, “Bronchiolitis Obliterans: High Resolution CT Findings and Correlation with Pulmonary Function Tests,” Clinical Radiology, Vol. 47, No. 4, 1993, pp. 236-240. doi:10.1016/S0009-9260(05)81129-8
- M. C. Sweatman, A. B. Millar, B. Strickland and M. Turner-Warwic, “Computed Tomography in Adult Obliterative Bronchiolitis,” Clinical Radiology, Vol. 42, No. 2, 1990, pp. 116-119. doi:10.1016/S0009-9260(05)80142-4
- P. A. Grenier, A. C. Beigelman, C. Fétita, F. Prêteux, M. W. Brauner and S. Lenoir, “New Frontiers in CT Imaging of Airway Disease,” European Radiology, Vol. 5, No. 12, 2002, pp. 1022-1044. doi:10.1007/s00330-002-1342-1
- S. A. Worthy, N. L. Müller, T. E. Hartman, S. J. Swensen, S. P. Padley and D. M. Hansell, “Mosaic Attenuation Pattern on Thin-Section CT Scans of the Lung: Differentiation among Infiltrative Lung, Airway, and Vascular Diseases as a Cause,” Radiology, Vol. 205, No. 2, 1997, pp. 465-470.
- American Thoracic Society, “Standardization of Spirometry—1994 Update,” American Journal of Respiratory and Critical Care Medicine, Vol. 152, 1995, pp. 1107-1136.
- R. S. Fraser, L. M. Nestor, C. Neil and P. D. Pare, “Deacreased Lung Dencity: Fraser and Pare’s Dianosis of Diseases of the Chest,” 4th Edition, W. B. Saunders Company, Philadelphia, 1999.
- M. L. Goris, H. J. Zhu, F. Blankenberg, F. Chan and T. E. Robinson, “An Automated Approach to Quantitative Air Trapping Measurements in Mild Cystic Fibrosis,” Chest, Vol. 123, No. 5, 2003, pp. 1655-1663. doi:10.1378/chest.123.5.1655
- J. G. Im, Y. W. Choi, H. D. Kim, Y. K. Jeong and M. C. Han, “Thin-Section CT Findings of the Lungs: Experimentally Induced Bronchial and Pulmonary Artery Obstruction in Pigs,” American Journal of Roentgenology, Vol. 167, No. 3, 1996, pp. 631-636.
- P. S. Hasleton and A. Curry, “Anatomu of the Lung: Hasleton PS. Spencer’s Pathology of the Lung,” 5th Edition, McGraw-Hill, New York, 1962.
- T. J. Vrtiska, R. P. Hartman, J. M. Kofler, M. R. Bruesewitz, B. F. King and C. H. McCollough, “Spatial Resolution and Radiation Dose of a 64-MDCT Scanner Compared with Published CT Urography Protocols,” American Journal of Roentgenology, Vol. 192, No. 4, 2009, pp. 941-948. doi:10.2214/AJR.07.2679
- D. M. Michael and J. S. Sally “Cardiopulmonary Function Testing: Jennifer AP, Barbara AW. Phisiotherapy for Respiratory and Cardiac Problems,” 2nd Edition, Churchill Livintstone, London, 1993.
- J. A. Verschakelen, K. Scheinbaum, J. Bogaert, M. Demedts, L. L. Lacquet and A. L. Baert, “Expiratory CT in Cigarette Smokers: Correlation between Areas of Decreased Lung Attenuation, Pulmonary Function Tests and Smoking History,” European Radiology, Vol. 8, No. 8, 1998, pp. 1391-1399. doi:10.1007/s003300050558