World Journal of Engineering and Technology
Vol.04 No.01(2016), Article ID:63371,12 pages
10.4236/wjet.2016.41007
Estimating and Plotting of Groundwater Quality Using WQIUA and GIS in Assiut Governorate, Egypt
Mohamed R. El Tahlawi, Mohamed Abo-El Kassem, Gamal. Y. Baghdadi, Hussein A. Saleem*
Mining and Metallurgical Engineering Department, Faculty of Engineering, Assiut University, Assiut, Egypt

Copyright © 2016 by authors and Scientific Research Publishing Inc.
This work is licensed under the Creative Commons Attribution International License (CC BY).
http://creativecommons.org/licenses/by/4.0/


Received 26 November 2015; accepted 1 February 2016; published 5 February 2016
ABSTRACT
This paper aims to turn complex groundwater data into comprehensible information by indexing the different factors numerically comparative to the standards of World Health Organization (WHO) to produce Water Quality Index (WQI). Water Quality Index (WQI) has been used to assess groundwater quality and Geographic Information Systems (GIS) has been used to create maps representing the spatial distribution of groundwater categories in Assiut governorate, Egypt. Water Quality Index has been computed by Un-weighted Arithmetic Water Quality Index (WQIUA) method and applied on 796 wells over eight years from 2006 to 2013. The results showed that WQIUA values for drinking purposes were high and most of them reached higher or close to 100, which indicated that the groundwater was polluted and unsafe for drinking. On the other hand, the quality index of groundwater for irrigation purposes in most of the study area ranges between 55.78 and 78.38 (poor and very poor category); this means that groundwater is moderately polluted and rather suitable for irrigation.
Keywords:
Un-Weighted Arithmetic Water Quality Index (WQIUA), Groundwater Pollution, Geographic Information Systems (GIS)

1. Introduction
Groundwater quality assessment is considered as a significant topic to make sure possible safe use of this resource. As the population continues to increase, it is necessary to find additional sources of water such as groundwater. Groundwater is deemed one of the major resources for potable water in Assiut governorate especially in rural areas [1] . Methods to incorporate some factors correlated to groundwater quality in a particular index are gradually more desired in local and global scenarios [2] . Using of indicators and indices to monitor the environmental condition can abstract a huge number of characteristics, thus decision makers can be provided by an integrated and more instructive summary [3] . Geographic Information System (GIS) is able to become a strong tool to improve solutions for groundwater resource problems, for assessing groundwater quality, determining groundwater availability, and managing groundwater resources on a national or international range especially when groundwater has a geographical status [4] .
This paper aims to assess groundwater quality using Un-weighted Arithmetic Water Quality Index (WQIUA), and display spatial distribution of groundwater quality using GIS in Assiut governorate. In view of the previous studies conducted to assess the quality of groundwater it has been shown that the few number of such studies was interested with groundwater pollution and have been applied on limited regions in Assiut governorate. In 1988, Sobih et al. [5] talked about the chemical and bacterial pollution of groundwater by assessing 25 water wells established at Assiut city. Schlumberger geoelectrical depth soundings and horizontal geoelectrical profiling was used to determine the distribution of the contaminated and uncontaminated zones of groundwater in (El-Madabegh) area, northwest of Assiut city [6] . Sebaq et al. (2003) [7] used surface geoelectrical methods for delineation of groundwater pollution in Beni Ghalib area, northwest of Assiut city.
Geographic Information System (GIS) has come into view as “a powerful tool for storing, analyzing, and displaying spatial data and using these data for decision making in several areas including engineering and environmental fields” [8] . GIS has been applied to create groundwater quality classification map depending on the relationship between total dissolved solids (TDS) values and some characteristics of aquifer [9] or based on the correlation between TDS and land use [10] . Some studies developed a GIS-based methodology to design a groundwater monitoring system and to estimate distributed groundwater contamination risk [11] - [13] . GIS technology has been assigned to study groundwater nitrate contamination resulted from agrochemical fertilizers [14] [15] .
Ahmed and Ali (2009) [16] , combined between geochemical modeling techniques and GIS to study an incorporated role of three different processes to evolve groundwater composition, and their effect on quality of groundwater in Sohag governorate, Egypt. In 2009, Dawoud and Ewea [17] developed a numerical model using GIS based widespread database to simulate the stable and temporary flow in saturated and unsaturated zones in Wadi Al Assiuti Area. El-Alfy (2010) [18] applied multivariate statistics and GIS to examine the effects on groundwater resources and the possible contamination sources. Latha and Rao (2010) [19] used Water Quality Index (WQI) and GIS to assess and map groundwater quality. Ratnakanth et al. (2011) [20] , Balakrishnan et al. (2011) [21] and Dar et al. (2012) [22] used GIS techniques to get groundwater quality map.
2. Study Area
Study area is considered as a part of the Nile Valley, Egypt. It extends south-north between Sohag and El-Minia Governorates from latitude 27˚37'N to 26˚47'N and extends west-east between New Valley and Red Sea Governorates from longitudes 30˚37' to 31˚34'E, as shown in Figure 1. The total Assiut governorate area is 25,926 km². The extension of the River Nile along study area is about 125 km, and the valley width is between 16 and 60 km [1] . River Nile divides the study area into a western and an eastern part. The Eastern part expands between El-Badary in the South and Manfalut in the North, while the Western part of the study area expands between El-Ghanayim in the South, and Dairut in the North. The sharp declination is the major feature of the fringes of the study area because of the limestone plateau which limits the area from the east and the west, except of the Northwestern part that has a moderate slope [17] . There are some wadies joined with the study area like: Wadi El-Assiuti and Wadi El Ibrahimi in the central east, Wadi Abu Shih in the south east.
3. Methodology
3.1. Computing Water Quality Index (WQI)
Un-weighted Arithmetic Water Quality Index (WQIUA) is calculated to diminish the huge data to one numerical value that expresses the overall water quality [24] . In this research, Un-weighted Arithmetic Water Quality Index (WQIUA) was computed to evaluate suitability of groundwater for drinking and irrigation purposes. To assess the groundwater quality for drinking, twelve parameters were included which are PH, Na+, K+, Ca2+, Mg2+, Cl−,  ,
,  , TDS, TH, Fe and Mn. These parameters were synthesized by indexing the different water

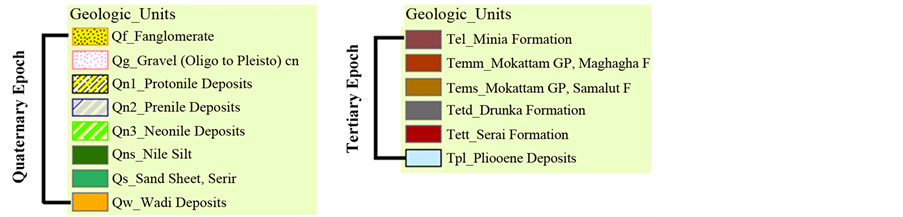
Figure 1. Geology map of Assiut region [23] .
quality parameters numerically comparative to the World Health Organization (WHO) standards (1996) [25] and Egyptian Standards (1995) [26] as shown in Table 1 to produce Un-weighted Arithmetic Water Quality Index (WQIUA).
While SAR, Na%, PI, MR, and TDS were used to calculate Un-weighted Arithmetic Water Quality Index (WQIUA) of groundwater if used for irrigation purposes. Table 2 illustrates groundwater classification according to indexing categories of the five parameter used for assessing suitability of groundwater for irrigation.
The un-weighted arithmetic water quality index (WQIUA) or quality rating (q) of ith parameter apart is defined as given in equation (1) [32] as follows,
 (1)
(1)
where:
qi: the quality rating for the ith parameter;
Vi: the observed value of the ith parameter;
Si: water quality standard value.
Un-weighted Arithmetic Water Quality Index (WQIUA) or the average water quality index (Q) for the studied parameters is

Table 1. WHO guidelines and Egypt standards for drinking water quality [25] [26] .
Table 2. Classification of groundwater to evaluate its suitability for irrigation.
 (2)
(2)
where:
n: number of parameters.
WQIUA or Q classifies groundwater into five categories Based on its value as follows in Table 3 [10] . If the value of WQIUA or Q is approaching 100; it points to that the groundwater contains high percentage of the considered parameters; thus, groundwater is in very poor category. While if WQIUA or Q value ranges between 50
Table 3. Water Quality Index Categories [10] .
and 75, it represents that the groundwater is in the poor category. On the other hand, if the average quality index is more than 100, it means that water falls under the fifth category, where groundwater is polluted and not suitable to use [10] [16] . In each of the previous cases (poor, very poor, and unfit) the groundwater is undesirable to use where the higher the value of water quality index, the lower the suitability of groundwater for use.
3.2. Mapping Spatial Distribution of Groundwater Quality
Interpolation can be defined as “a function used to generate a continuous surface from sampled point values” [33] . Interpolation system is based mainly on the Deriving of cell values from a limited number of data. The essential assumption of this technique is that the wells that are nearby together have similar properties more than those is far from each other. In ArcGIS 9.3 software three techniques of point interpolation were involved in spatial analyst, which are 1) Inverse Distance Weighted (IDW), 2) Spline, and 3) Kriging [34] . This paper is dealing with Inverse Distance Weighted (IDW) for interpolation of data.
The Inverse Distance Weighted (IDW) is used as interpolation method to create the spatial distribution map of groundwater quality, which infers the grid value for each cell by calculating the average of sample points. The calculated value depends on measured values of phenomenon in wells and the distance between wells and the calculated grid cell [35] [36] . The expected value is a weighted average of the neighboring groundwater wells in Inverse Distance Weighted method. Weights are calculated by taking the inverse of the distance from an observation’s location to the location of the point being estimated [37] . This distance term is often raised to a power to manage the importance of locational separation in the estimation [29] . The distance between the points count, so the points of equal distance have equal weights [8] . The weight factor is determined as illustrated in “Equation (3)” [21] :
 (3)
(3)
where:
λi: the weight of point;
Di: the distance between point i and the unknown point;
α: the power ten of weight.
4. Results and Discussion
Firstly, the quality rating (qi) was computed by “Equation (1)” for twelve parameters which used to determine validation of groundwater for drinking and purposes as shown in Table 4. It is worth mentioning that qi isn’t considered representative water quality index of all measured parameters in the year but it is just for individual parameter such as Na, K, and so on. It is clear from Table 4 that all values of Ca and Mg are less than 50 overall the years from 2006 to 2013, this means that the groundwater does not contain dangerous levels of those elements. The quality rating for potassium K was more than 50 in 2006 and 2007 only, but the rest values were less than 50. It is indicated that groundwater does not suffer from increasing of potassium percentage.
The calculated values of qi for such parameters have been plotted as illustrated in Figure 2 during the period 2006-2013.
The sulfate quality rating (qSO4) is similar with (qK), it is also more than 50 in 2006, 2007 and 2008 and then became below 50 during the next period. It is noted that there is an increase above 50 in the quality rating of K,
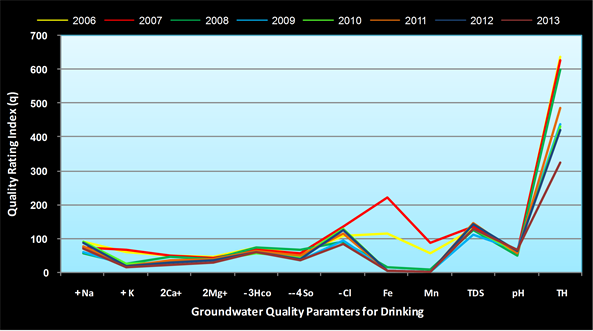
Figure 2. Quality rating index (qi) of groundwater quality paramters for drinking.
Table 4. Calculating water quality rating (qi) for drinking purposes.
So4 and Mn in the years 2006, 2007, and 2008, but the ratios is changed to less than 50 in the period from 2009 until 2013.,
All quality rating indices (q) of Na and Hco3are limited to between 50 and 100, so sodium and bicarbonates ions have negative effect on groundwater quality. The quality rating index (q) for Cl is high throughout the observed years and it reached over 100, which represented that the water is polluted with high levels of Cl. In other case for Fe, the quality rating (q) rate was low in all observed years except 2006 and 2007. PH rate falls within the permissible limits in almost all wells and its quality rating was less than 100 over all years. According to the point that quality rating of TH reached higher than 100, it indicates that groundwater is classified as hard water. Although the quality rating values of Na, K, Ca, Mg, Hco3, and So4 were less than 100 but the quality rating for TDS reached over 100 in all years. This means the groundwater in Nile aquifer system along Assiut governorate is over saturated with total dissolved salts (TDS).
Therefore, quality rating (q) cannot be relied upon alone; all affected variables must be included to get one representative value of groundwater in each year which called the Un-weighted Arithmetic Water Quality Index (WQIAU) or (Q) as demonstrated in Equation (2).
With regard to quality rating index (q) of the five used parameters to assess the suitability of groundwater for irrigation, Table 5 summarizes the calculation of qi, whereas, Figure 3 illustrates quality rating index (qi) of those parameters which are TDS, SAR, Na%, PI, and MR.
It is obvious from Table 5 and Figure 3 that all qi values of TDS and SAR are below 50, this points to the groundwater has small percentage of these two parameters. While all qi values of Na% and PI vary between 50 and 100, it means that those parameters have negative effect on groundwater quality. While most values of quality rating index (qi) of MR exceed 100, it denotes that groundwater is oversaturated with magnesium ratio (MR).

Figure 3. Quality rating index (qi) of groundwater quality paramters for irrigation.
Table 5. Calculating water quality rating (qi) for irrigation purposes.
It is noted that it cannot be judged on the groundwater quality using a single factor alone, thus, it must be combined between five parameters to get one representative value which called Un-weighted Arthmetic Water Quality Index (WQIAU) or (Q).
Data of 796 wells over the eight years have been used to estimate the Un-weighted Arithmetic Water Quality Index (WQIUA) or (Q) yearly during the period from 2006 to 2013. Table 6 shows the summary of data wells distributed over 8 years
The Un-weighted Arithmetic Water Quality Index (WQIUA) or (Q) has been calculated yearly by Equation (2) as shown in Table 7. The Un-weighted Arithmetic Water Quality Index (WQIUA) or (Q) results of groundwater whether it used for drinking or irrigation were plotted in two curves as cleared in Figure 4.
The tabulated results in Table 7 show that WQIUA values of groundwater for drinking purposes are close to 100 or more than 100. In addition to, the curve of drinking water in Figure 4 is located in two zones which are very poor category and unsuitable category. Hence, the groundwater is polluted and unsafe for drinking. On the other hand, the Un-weighted Arithmetic Water Quality Index (WQIUA) or (Q) of groundwater for irrigation ranges between 55.78 and 78.38 (poor and very poor category); this means that groundwater is moderately polluted and hardly valid for irrigation.
Secondly, GIS has been used to plot the Un-weighted Arithmetic Water Quality Index (WQIUA) results to create the spatial distribution map of WQIUA for drinking water and irrigation water as shown in Figure 5 and Figure 6 respectively.
The results revealed that the suitability of groundwater for drinking varies from location to another. Generally, the groundwater quality index for drinking around river Nile is less than the new reclaimed lands at the fringes of study area. The groundwater in most of the study area belongs to unsuitable and very poor categories, however good and poor categories occupy small areas. Accordingly, the majority of groundwater wells in study area
Table 6. Summary of data wells over eight years.
Table 7. Summary of (WQIUA) or (Q) of the groundwater.

Figure 4. Average water quality index of the groundwater to evaluate its suitability for drinking and irrigation.

Figure 5. Spatial distribution map of the WQIAU for the for drinking purposes.
are unsuitable for drinking.
Figure 6 shows the Un-weighted Arithmetic Water Quality Index (WQIUA) results of groundwater for irrigation purposes. It is noted that the yellow color covers the most of study area which expresses the poor category. For the very poor category, it occupies small areas on the fringes of Assiut governorate, Wadi El-Asyuti and Abnub from the east side, Bani Adi and Al-Ghanaium on the west side district. The isolated areas in Wadi El-Asyuti and Abnub on the eastern side which have red color are unsuitable category. Consequently, the largest part of the study area varies between poor category and very poor category; this means that groundwater is moderately polluted and hardly suitable for irrigation.
5. Conclusion
The objective of calculating WQIUA is to find out quality assessment of water by synthesizing different available groundwater data. Samples of 796 groundwater wells have been used to determine the Un-weighted Arithmetic Water Quality Index (WQIUA) during the period from 2006 to 2013. The quality indices are worked out for PH, Na, K, Ca, Mg, HCO3, SO4, Cl, TDS, TH, Fe and Mn to evaluate the suitability of groundwater for drinking. While, SAR, Na%, PI, MR, and TDS were used to calculate WQIUA for assessing the suitability of groundwater for irrigation. It is concluded that the groundwater of this study area is not suitable for drinking water but can be

Figure 6. Spatial distribution map of the WQIAU for irrigation purposes.
hardly used for irrigation purposes. The results are also supported by the spatial distribution of the WQIUA map which was generated by ArcGIS 9.3. In case of using groundwater for drinking, the most study area belongs to unsuitable and very poor categories, whereas if groundwater is used for irrigation, the most study area belongs to poor and very poor categories.
Cite this paper
Mohamed R. ElTahlawi,Mohamed Abo-ElKassem,Gamal. Y.Baghdadi,Hussein A.Saleem, (2016) Estimating and Plotting of Groundwater Quality Using WQI UA and GIS in Assiut Governorate, Egypt. World Journal of Engineering and Technology,04,59-70. doi: 10.4236/wjet.2016.41007
References
- 1. ALDAR, CH2M Hill, Spain (2011) Study of Environmental and Social Impact Assessment Framework (ESIAF) of Assiut & Sohag Governorates. Executive Summary, Egypt, 82 p.
- 2. Lermontov, A., Yokoyama, L., Lermontov, M. and Machado, M.A.S. (2009) River Quality Analysis Using Fuzzy Water Quality Index: Ribeira do Iguape River Watershed, Brazil. Ecological Indicators, 9, 1188-1197.
http://dx.doi.org/10.1016/j.ecolind.2009.02.006 - 3. Smajgla, A., Larsona, S., Huga, B. and De Freitasb, D.M. (2010) Water Use Benefit Index as a Tool for Community-Based Monitoring of Water Related Trends in the Great Barrier Reef Region. Journal of Hydrology, 395, 1-9.
http://dx.doi.org/10.1016/j.jhydrol.2010.09.007 - 4. Tjandra, F.L., Kondhoh, A. and Mohammed, M.A. (2003) A Conceptual Database Design For Hydrology Using GIS. Proceedings of Asia Pacific Association of Hydrology and Water Resources, Kyoto, March 2003, 13-15.
- 5. Sobih, M.A., Reem, D., Kamel, Y.Y. and El-Gharably, G.A. (1988) Chemical and Bacteriological Evaluation of Drinking Ground Supplies in Assiut City. Assiut Veterinary Medical Journal, 38, 99-104.
- 6. Ebrahim, M.O. (1997) Application of Surface Geoelecrtical Methods for the Detection of Groundwater Contamination in the Area Northwest of Assiut City (El Madabegh). Msc Thesis, Assiut University, Assiut.
- 7. Sebaq, A.S., El-Hussaini, A.H. and Ibrahim, H.A. (2003) Application of Electrical Resistivity and Self-Potential for Groundwater Exploration and Contamination Study in the Area Northwest of Assiut City, Egypt. Journal of King Saud University, 16, 31-61.
- 8. Burrough, P.A. and McDonnell, R.A. (1998) Principles of Geographical Information Systems. Oxford University Press, New York, 333 p.
- 9. Butler, M., Wallace, J. and Lowe, M. (2002) Ground-Water Quality Classification Using GIS Contouring Methods for Cedar Valley, Iron County, Utah. Digital Mapping Techniques, Workshop Proceedings, US Geological Survey Open-File Report 02-370.
- 10. Asadi, S.S., Vuppala, P. and Reddy, M.A. (2007) Remote Sensing and GIS Techniques for Evaluation of Groundwater Quality in Municipal Corporation of Hyderabad (Zone-V), India. International Journal of Environmental Research and Public Health, 4, 45-52.
http://dx.doi.org/10.3390/ijerph2007010008 - 11. Dutta, D., Gupta, A.D. and Ramnarong, V. (1998) Design and Optimization of a Groundwater Monitoring System Using GIS and Multicriteria Decision Analysis. Groundwater Monitoring & Remediation, 18, 139-147.
http://dx.doi.org/10.1111/j.1745-6592.1998.tb00610.x - 12. Giupponi, C. and Vladimirova, I. (2006) Ag-PIE: A GIS-Based Screening Model for Assessing Agricultural Pressures and Impacts on Water Quality on a European Scale. Science of the Total Environment, 359, 57-75.
http://dx.doi.org/10.1016/j.scitotenv.2005.07.013 - 13. Sinkevich, M.G., Walter, M.T., Lembo, A.G. and Richards, B.K. (2005) A GIS-Based Ground Water Contamination Risk Assessment Tool for Pesticides. Ground Water Monitoring and Remediation, 25, 82-91.
http://dx.doi.org/10.1111/j.1745-6592.2005.00055.x - 14. Babiker, I.S., Mohamed, A.A., Terao, H., Kato, K. and Ohta, K. (2004) Assessment of Groundwater Contamination by Nitrate Leaching from Intensive Vegetable Cultivation Using Geographical Information System. Environment International, 29, 1009-1017.
http://dx.doi.org/10.1016/s0160-4120(03)00095-3 - 15. Nas, B. and Berktay, A. (2006) Groundwater Contamination by Nitrates in the City of Konya, (Turkey): A GIS Perspective. Journal of Environmental Management, 79, 30-37.
http://dx.doi.org/10.1016/j.jenvman.2005.05.010 - 16. Ahmed, A.A. and Ali, M.H. (2009) Hydrochemical Evolution and Variation of Groundwater and Its Environmental Impact at Sohag, Egypt. Arabian Journal of Geosciences, 4, 339-352.
http://dx.doi.org/10.1007/s12517-009-0055-z - 17. Dawoud, M.A. and Ewea, H.A.R. (2009) Sustainable Development via Optimal Integration of Surface and Groundwater in Arid Environment: Nile River Quaternary Aquifer Case Study. The International Conference on Water Conversation in Arid Regions, Jeddah, 12-14 October 2009.
- 18. El Alfy, M. (2010) Integrated Geostatistics and GIS Techniques for Assessing Groundwater Contamination in Al-Arish Area, Sinai, Egypt. Arabian Journal of Geosciences, 5, 197-215.
http://www.springerlink.com/content/p7444736q3281k66/fulltext.pdf - 19. Latha, S.P. and Rao, N.K. (2010) Assessment and Spatial Distribution of Quality of Groundwater in Zoneii and III, Greater Visakhapatnam, India using Water Quality Index (WQI) and GIS. International Journal of Environmental Sciences, 1, 198-212.
- 20. Ratnakanth, M.J., Das, I.C., Jaisankar, G., Rao, E.N.D. and Kumar, P.A. (2011) Assessment of Groundwater Pollution in Parts of Guntur District using Remote Sensing & GIS. International Journal of Earth Sciences and Engineering, 4, 1024-1030.
- 21. Balakrishnan, P., Saleem, A. and Mallikarjun, N.D. (2011) Groundwater Quality Mapping Using Geographic Information System (GIS): A Case Study of Gulbarga City, Karnataka, India. African Journal of Environmental Science and Technology, 5, 1069-1084.
http://dx.doi.org/10.5897/AJEST11.134 - 22. Dar, I.A., Sankar, K. and Dar, M.A. (2012) Groundwater Quality Evaluation of Mamundiyar River Basin, India Using ARCGIS 9.2 PLATFORM. Wilolud Journals, 1, 1-24.
- 23. Conoco (1987) Geologic Map of Egypt. Egyptian General Authority for Petroleum (UNESCO Joint Map Project), 20 Sheets, Scale 1:500 000. Cairo.
- 24. Kolli, K. and Seshadri, R. (2013) Ground Water Quality Assessment Using Data Mining Techniques. International Journal of Computer Applications, 76, 39-45.
http://dx.doi.org/10.5120/13324-0885 - 25. World Health Organization (WHO) (1996) Guidelines for Drinking Water Quality. Vol. 2. Health Criteria and Other Supporting Information. WHO, Geneva, 940-949.
- 26. Egyptian Higher Committee for Water (EHCW) (1995) Egyptian Standards for Drinking and Domestic Uses. EHCW, Cairo.
- 27. Davis, S.N. and De Wiest, R.J.M. (1966) Hydrogeology. Vol. 463, Wiley, New York.
- 28. Wilcox, L.V. (1955) Classification and Use of Irrigation Water. Agric Circular 969, USDA, Washington DC, 19 p.
- 29. Richard, L.A. (1954) Diagnosis and Improvement of Saline and Alkali Soils. Agric Handbook 60, USDA, Washington DC, 160 p.
- 30. Doneen, L.D. (1964) Water Quality for Agriculture. Department of Irrigation. University of Calfornia, Davis, 48 p.
- 31. Szaboles, I. and Darab, C. (1964) The Influence of Irrigation Water of High Sodium Carbonate Content on Soils. In: Szabolics, I., Ed., Proc 8th International Congress Soil Science Sodics Soils, Research Institute for Soil Science and Agricultural Chemistry of the Hungarian Academy of Sciences, ISSS Trans II, 802-812.
- 32. Farrag, A.A. (2005) The Hydraulic and Hydrogeological Impacts of the Nile System on the Groundwater in Upper Egypt. Assiut University Bulletin for Environmental Researches, 8, 87-102.
- 33. McCoy, J. and Johnston, K. (2001) Using Arcgis Spatial Analyst. Environmental Systems Research Institute, Inc., Redlands, 230 p.
- 34. DeMers, M.N. (2000) Fundamentals of Geographic Information Systems. 2nd Edition, John Wiley & Sons, Inc., New York, 498 p.
- 35. Buchanan, S. and Triantafilis, J. (2009) Mapping Water Table Depth Using Geophysical and Environmental Variables. Ground Water, 47, 80-96.
http://dx.doi.org/10.1111/j.1745-6584.2008.00490.x - 36. Arsalan, M.H. (2004) A GIS Appraisal of Heavy Metals Concentration in Soil. Technical Report for American Society of Civil Engineers, New York.
- 37. Guan, W., Chamberlain, R.H., Sabol, B.M. and Doering, P.H. (1999) Mapping Submerged Aquatic Vegetation in the Caloosahatchee Estuary: Evaluation of Different Interpolation Methods. Marine Geodesy, 22, 69-91.
http://dx.doi.org/10.1080/014904199273506
NOTES

*Corresponding author.