Open Journal of Preventive Medicine
Vol.4 No.6(2014), Article
ID:46797,8
pages
DOI:10.4236/ojpm.2014.46052
Association between Weight Change during Treatment and Treatment Outcome in Patients with Smear Positive Pulmonary Tuberculosis
Mohammad Khajedaluee, Maliheh Dadgarmoghaddam*, Davoud Attaran, Amirhossein Zabihi, Seyedhassan Ashrafi
School of Medicine, Mashhad University of Medical Science, Mashhad, Iran
Email: *maliheh_dadgar@yahoo.com
Copyright © 2014 by authors and Scientific Research Publishing Inc.
This work is licensed under the Creative Commons Attribution International License (CC BY).
http://creativecommons.org/licenses/by/4.0/


Received 30 April 2014; revised 30 May 2014; accepted 10 June 2014
ABSTRACT
Tuberculosis (TB) is known as a disease of poverty and declared as a global public health emergency by World Health Organization (WHO). Pulmonary tuberculosis is the most common type of TB and is a wasting disease. It is expected that the patients who lost weight during the course of disease, will gain weight during successful treatment. So the aim of this study was to assess the body weight changes through the treatment and its possible association with treatment outcome in TB patients in Nishapur, an ancient city in Razavi Khorasan province in Iran. This is an observational analytical study. Patients were selected according to inclusion and exclusion criteria and available information. Treatment Protocol for all patients was Directly Observed Treatment, short Course Strategy (at least 6 months). All patients were weighed at the beginning of treatment, after two months and at the end of treatment. Outcome of treatment was classified into: cured, completed treatment, treatment failure and death. Then the impact of weight changes during treatment was compared in subgroups. From 874 patients, 819 patients (93.9%) were new cases, 48 (5.3%) relapse, 5 patients (0.6%) patients who did not complete their treatment and 2 (0.2%) had failed prior therapy. The most common symptoms in all patients were: cough, sputum, weight loss, fever, sweats, and hemoptysis. 8.1% of patients had radiologic signs and the most common signs were cavity (2.9%). The weight change during treatment was 2.91 ± 5.59 kg in cured group, 3.3 ± 3.29 kg in completed treatment group, 2.95 ± 5.59 kg in treatment failure group and 1.02 ± 3.27 in dead group respectively. These differences were statistically significant between the four groups (p < 0.03). We can conclude that body weight change can be used as a predictor for the treatment outcome.
Keywords:Pulmonary Tuberculosis, Body Weight Change, Treatment Outcome

1. Introduction
In some regions tuberculosis named “The Mother of Diseases”. Tuberculosis (TB) is known as a disease of poverty and spreads in crowded places with poor ventilation and among patients with malnutrition. TB was declared as a global public health emergency by World Health Organization (WHO) and Global progress in TB care and control have been done since 2000 to 2012 and treatment success rate increased from 69% up to 87% [1] . According to Millennium Development Goals, the world must stop growing of TB incidence till 2015 and since then reduce TB incidence, prevalence and mortality and then eliminate TB incidence of less than 1 per million people till 2050. TB is already one of the most serious concerns and threatens the health of human society, and because the incidence of new stuff in this case, the control and prevention should be the focus of global health leadership of nations and communities.
TB becomes an important and serious disease in Iran because the two neighboring countries of Iran, Afghanistan and Pakistan are among 22 high burden nations around the world as well as Iraqi (with crisis in the last few years) and the newly independent countries at the north border of Iran with a high prevalence of multidrugresistant tuberculosis [2] . Pulmonary tuberculosis is the most common type of TB and smear-positive pulmonary tuberculosis constitutes 53% of all TB cases in Iran. TB is a wasting disease and it is claimed that body weight is a predictor of response to treatment and it is expected that the patients who lost weight during the course of disease, will gain weight during successful treatment. Possible association between weight changes during treatment and treatment outcome has been investigated in some studies [3] -[11] . The aim of this study was to assess the body weight changes through the treatment and its possible association with treatment outcome in TB patients in Nishapur, an ancient city in Razavi Khorasan province in Iran.
2. Methods
This is an observational analytical study. This study have been doing in 2011 that investigate cases of smear positive pulmonary TB in Nishapur (A north city in Razavi Khorasan with an estimated population of 239,185 as of 2011 and its county 433,105 with high incidence rate of TB approximately 10 per 100,000 population) between the year 1993-2009. These patients were treated in Health center by Directly Observed Treatment, Short-Course strategy (DOTS) at least for 6 months.
In Iran, all the TB diagnosed cases are treated in health care centers, so the cases diagnosed annually in this city during the years of study is approximately equal to the total cases diagnosed annually.
To access to all the information about patients, all health care centers (36 centers) were investigated and after studying all the patients’ records, cases were selected according to inclusion and exclusion criteria. Selection of patients is shown in Diagram 1.
Pulmonary smear positive TB were defined as patients with at least two sputum smears positive for Acid FAST Bacillus (AFB), or a positive sputum smear and radiological signs indicating TB, or a positive sputum smear for AFB and a positive culture.
Inclusion criteria included: Pulmonary smear positive TB, clarifying the patient’s weight at the beginning, end of the second month and the end of treatment, being treated for TB during 1993-2009.
Exclusion criteria included: TB patients with malignancy or diabetes, patients are not using the standard treatment regimen (DOTS), patients who have a special diet during treatment, and the patient that was pregnant.
For a list of all eligible patients a checklist was completed that including information like demographic, clinical signs and symptoms, weight changes during treatment and outcome of treatment.
For precision and accuracy of information all completed checklist in the Health center, are re-examined by the experts and if there are any records ambiguity or defects, it was resolved. Treatment Protocol for all patients was DOTS (at least 6 months). All patients were weighed at the beginning of treatment, after two months and at the end of treatment. Outcome of treatment was classified into: cured, completed treatment, treatment failure and death. All the outcomes defined separately as: cured, smear becomes negative at the end of treatment (or a month
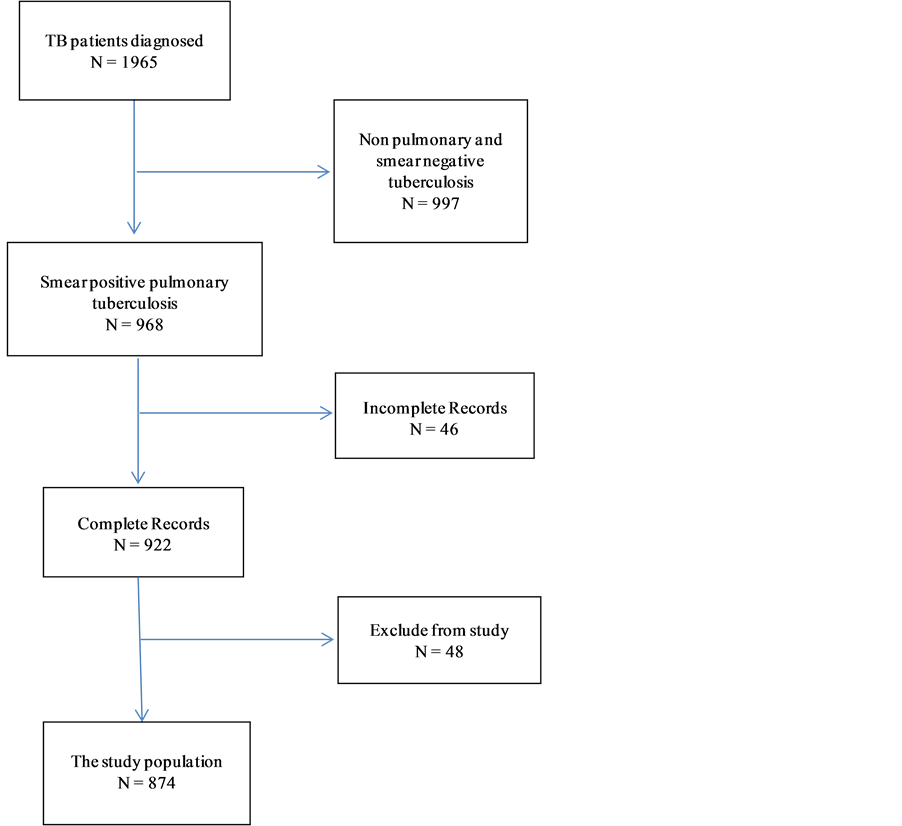
Diagram 1. Stages of patient selection.
earlier), full treatment as patients who have completed the whole program DOTS standard treatment course (but they’re not any further information about their smear test), treatment failure as smear of patients still remained positive despite of 5 months treatment or become positive again and death as patients who have died during TB treatment.
Then the impact of weight change during treatment was compared in subgroups. Data analyzed by SPSS version 11.5 software. Frequency distribution and central and dispersion measures were used to describe patient characteristics, and Chi-square test, Mann Whitney, T test and Kruskallwallis for comparison qualitative and quantitative variables and Repeated Measurement test was used to study the weight changes during the treatment course. In all calculations, p < 0.05 was considered as statistically significant level.
This study was approved by the Mashhad Medical University Research Ethics Committee, all patient information is kept confidential and the overall results are presented anonymously.
3. Results
From 1965 patients, 874 patients had Inclusion criteria and the demographic characteristics of the patients are presented in Table 1. As can be seen, 48.2% of patients are from rural areas and 51.8% are from urban areas. From 874 patients, 819 patients (93.9%) were new cases, 48 (5.3%) relapses, 5 (0.6%) who did not complete their treatment and 2 (0.2%) had failed prior therapy.
Delay of diagnosis was 124.17 ± 68.23 days, and delay in the start of treatment (after the diagnosis) was 5.11 ± 10.73 days that was statistically significant in different treatment groups (p < 0.001, Table 1).
Frequency distribution of patients is presented in Table 2. The most common symptom in all patients were: cough, sputum, weight loss, fever, sweats, and hemoptysis. 8.1% of patients had radiologic signs and the most common sign was cavity (2.9%).
The average weight of patients at the beginning of treatment, was in the range of 45 to 51 kg. The body weight change during treatment is presented in Table 3.
The weight changes during treatment were statistically significant between the four groups (p < 0.03).

Table 1. Demographic characteristics of patients.
*N(%).
Table 2. Clinical sign and symptoms based on treatment outcome groups.
Table 3. Body weight change during treatment in patients.
The mean weight changes during follow-up period are presented in Figure 1, and Figure 2. As can be seen, weight change is continually increasing from baseline in both groups (completed treatment and cured group) but in the treatment failure group, the body weight decrease till second month and then increase until 6th month. In death group, the body weight is increased slightly (mean, 660 g) until 2th month and then is reducing, this changes were statistically significant (p < 0.001).
4. Discussion
Now in Iran, like many other countries, DOTS strategy is considered as an approach to the treatment and control of tuberculosis. However, cases of treatment failure, death or relapses have been seen. Health system tries to increase success in treatment by implementation DOTS strategy. Physician need to have measures to assess the success of treatment, so a meaningful relationship between weight changes during treatment with outcome of treatment can be an appropriate measure.
Weighting patients during treatment is measure with such suitable characteristics:
a) Can be measured in all patients.
b) It is easy to measure, and equipment is available in all health centers and health houses.
c) It takes very little time.
d) People also cooperate easily.
e) Weight measurement does not require special experiences and all health care workers can do it.
f) It is not a high cost procedure.
In this study, there is a significant association between weight gain and outcome of treatment. In a similar study which was done in Vietnam, results showed that “New sputum smear-positive TB patients with a successful treatment outcome gained an average of 2.6 kg during treatment. Patients with weight loss during the first 2 months of treatment were more likely to have an unsuccessful outcome than patients without (OR 4.9, 95%CI 3.0 - 7.9). Patients weighing <40 kg at treatment start who gained more than 5% of their bodyweight after 2 months of treatment had a significantly smaller risk of an unsuccessful treatment outcome than patients who did not (OR 0.2, 95%CI 0.05 - 0.96)” [3] .
The results of another study were the same. It was showed that there is a strong association between Body Mass Index (BMI) change during the first month of TB treatment and treatment outcome [12] .
The result of Bernabe et al. study showed that patients who gained weight during the treatment, had a good outcome in comparison with poor outcome group that lost weight [5] .
An another study results confirm the other study results and revealed that in patients who are underweight at diagnosis and weight gain less than 5% during the first 2 months, the risk of relapse have been increased [11] .
In many studies weight gain is claimed as a prognostic factor [13] -[16] for better interventions in TB patients, many studies have been done to investigate the body composition and nutritional interventions [17] -[22] .
According to results of this study and other studies, it seems that weight is a significant factor in TB disease. If further studies confirm that weight can be considered as a factor in monitoring the treatment of TB, we can manage our intervention according to body weight change.
One of our interventions can be the nutritional supplements and micronutrients. Monitoring weight can be one of the pillars of the DOTS strategy and we should emphasis on weight control more.
Health policy men have to allocate part of the treatment funds to provide food baskets and taking the necessary supplements to all patients that really need it.
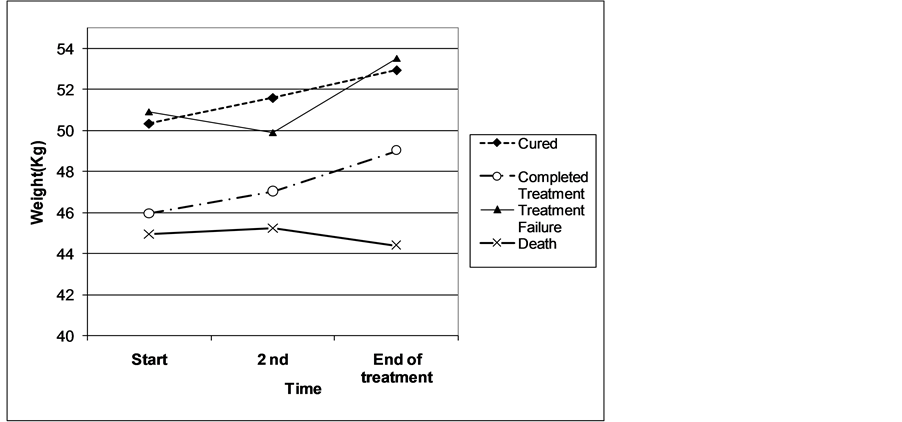
Figure 1. Body weight change during treatment course in time sections.
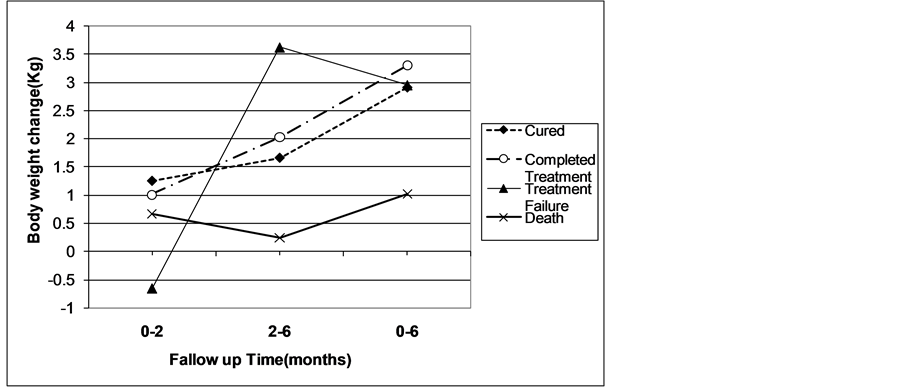
Figure 2. Weight changes during treatment at monthly intervals.
We had some limitations in our study. There are many missing data in recorded cases, sometimes due to the unavailability of data for some of patients and sometimes because of lack of information relating to the missing file uploaded more than a decade ago. Because of small sample size in treatment failure and death group in comparison with cured group, comparison between these groups was impossible. We weighted patients with different instrument by different experts in all health centers, so the instrument and observer bias is possible. In this study there wasn’t any information about the height of patients, so in this reason the use of BMI as a more accurate indicator of body mass changes during treatment was not possible.
5. Conclusion
Nowadays, social determinant of health is becoming more important, and further research in health system (HSR) on factors that influence the disease, such as poverty, malnutrition, addiction, AIDS, education, housing, unemployment, migration, and social beliefs is strongly recommended.
Conflict of Interest Statement
The authors declare that there are no conflicts of interests.
- [2] World Health Organization (2013) Global Tuberculosis Report. www.who.int/tb/publications/global_report
- [3] Arsang S.H., Kazemnejad, A. and Amani, F. (2011) Epidemiology of Tuberculosis in Iran (2001-08). Journal of Gorgan University Medical Science, 13, 78-86.
- [4] Hoa N.B., Lauritsen, J.M. and Rieder, H.L. (2012) Changes in Body Weight and Tuberculosis Treatment Outcome in Vietnam. The International Journal of Tuberculosis and Lung Disease, 17, 61-66. http://dx.doi.org/10.5588/ijtld.12.0369
- [5] Kennedy, N., Ramsay, A., Uiso, L., Gutmann, J., Ngowi, F.I. and Gillespie, S.H. (1996) Nutritional Status and Weight Gain in Patients with Pulmonary Tuberculosis in Tanzania. Transactions of the Royal Society of Tropical Medicine and Hygiene, 90, 162-166. http://dx.doi.org/10.1016/S0035-9203(96)90123-6
- [6] Bernabe-Ortiz A., Carcamo, C.P., Sanchez, J.F. and Rios, J. (2011) Weight Variation over Time and Its Association with Tuberculosis Treatment Outcome: A Longitudinal Analysis. PLoS ONE, 6, Article ID: e18474. http://dx.doi.org/10.1371/journal.pone.0018474
- [7] Vasantha, M., Gopi, P.G. and Subramani, R. (2009) Weight Gain in Patients with Tuberculosis Treated under Directly Observed Treatment Short-Course (DOTS). The Indian Journal of Tuberculosis, 56, 5-9.
- [8] Krapp, F., Véliz, J.C., Cornejo, E., Gotuzzo, E. and Seas, C. (2008) Bodyweight Gain to Predict Treatment Outcome in Patients with Pulmonary Tuberculosis in Peru. The International Journal of Tuberculosis and Lung Disease, 12, 1153- 1159.
- [9] Kennedy, N., Ramsay, A., Uiso, L., Gutmann, J., Ngowi, F.I. and Gillespie, S.H. (1996) Nutritional Status and Weight Gain in Patients with Pulmonary Tuberculosis in Tanzania. Transactions of the Royal Society of Tropical Medicine and Hygiene, 90, 162-166. http://dx.doi.org/10.1016/S0035-9203(96)90123-6
- [10] Schwenk, A., Hodgson, L., Wright, A., Ward, L.C., Rayner, C.F., Grubnic, S., Griffin, G.E. and Macallan, D.C. (2004) Nutrient Partitioning during Treatment of Tuberculosis: Gain in Body Fat Mass but Not in Protein Mass. American Journal of Clinical Nutrition, 79, 1006-1012.
- [11] Martins, N., Morris, P. and Kelly, P. (2009) Food Incentives to Improve Completion of Tuberculosis Treatment: Randomised Controlled Trial in Dili, Timor-Leste. British Medical Journal, 339, b4248. http://dx.doi.org/10.1136/bmj.b4248
- [12] Khan A., Timothy, R., Sterling, T.R., Reves, R., et al. (2006) Lack of Weight Gain and Relapse Risk in a Large Tuberculosis Treatment Trial. American Journal of Respiratory and Critical Care Medicine, 174, 344-348. http://dx.doi.org/10.1164/rccm.200511-1834OC
- [13] Benova L., Fielding, K., Greig, J., Nyang’wa, B.-T., Casas, E.C., et al. (2012) Association of BMI Category Change with TB Treatment Mortality in HIV-Positive Smear-Negative and Extrapulmonary TB Patients in Myanmar and Zimbabwe. PLoS ONE, 7, Article ID: e35948. http://dx.doi.org/10.1371/journal.pone.0035948
- [14] Rohini K., Surekha, B., Srikumar, P.S., Jyoti, S. and Mahesh, K.A. (2013) Body Weight Gain in Pulmonary Tuberculosis during Chemotherapy. IJCRIMPH, 5, 247-254.
- [15] Shears, P. (1991) Epidemiology and Infection in Famine and Disasters. Epidemiology and Infection, 107, 241-251. http://dx.doi.org/10.1017/S0950268800048895
- [16] Onwubalili, J.K. (1988) Malnutrition among Tuberculosis Patients in Harrow, England. European Journal of Clinical Nutrition, 42, 363-366.
- [17] Harries A.D., Nkhoma, W.A., Thompson, P.J., Nyangulu, D.S. and Wirima, J.J. (1988) Nutritional Status in Malawian Patients with Pulmonary Tuberculosis and Response to Chemotherapy. European Journal of Clinical Nutrition, 42, 445-450.
- [18] Paton N.I., Ng, Y.M., Chee, C.B., Persaud, C. and Jackson, A.A. (2003) Effects of Tuberculosis and HIV Infection on Whole-Body Protein Metabolism during Feeding, Measured by the [15N] Glycine Method. American Journal of Clinical Nutrition, 78, 319-325.
- [19] Macallan, D.C., Mc Nurlan, M.A., Kurpad, A.V., de Souza, G., Shetty, P.S., Calder, A.G. and Griffin, G.E. (1998) Whole Body Protein Metabolism in Human Pulmonary Tuberculosis and Undernutrition: Evidence for Anabolic Block in Tuberculosis. Clinical Science, 94, 321-331.
- [20] Mupere, E., Zalwango, S., Chiunda, A., Okwera, A., Mugerwa, R. and Whalen, C. (2010) Body Composition among HIV-Seropositive and HIV-Seronegative Adult Patients with Pulmonary Tuberculosis in Uganda. Annals of Epidemiology, 20, 210-216. http://dx.doi.org/10.1016/j.annepidem.2009.11.001
- [21] Praygod, G., Range, N., Faurholt-Jepsen, D., Jeremiah, K., Faurholt-Jepsen, M., Aabye, M.G., et al. (2011) Weight, Body Composition and Handgrip Strength among Pulmonary Tuberculosis Patients: A Matched Cross-Sectional Study in Mwanza, Tanzania. Transactions of the Royal Society of Tropical Medicine and Hygiene, 105, 140-147. http://dx.doi.org/10.1016/j.trstmh.2010.11.009
- [22] Melchior, J.C., Gelas, P., Carbonnel, F., et al. (1998) Improved Survival by Home Total Parenteral Nutrition in AIDS Patients: Follow up of a Controlled Randomized Prospective trial. AIDS, 12, 336-337.
NOTES

*Corresponding author.