Open Journal of Preventive Medicine
Vol.2 No.2(2012), Article ID:19499,9 pages DOI:10.4236/ojpm.2012.22024
Patient safety practices and medical errors: Perception of health care providers at Jimma University Specialized Hospital, Southwest Ethiopia*
![]()
1Department of Health Education and Behavioral Sciences, Jimma University, Jimma, Ethiopia; #Corresponding Author: tsionassefa21@yahoo.com
2Department of Health Services Management, Jimma University, Jimma, Ethiopia
3Department of Epidemiology, Jimma University, Jimma, Ethiopia
Received 14 January 2012; revised 24 February 2012; accepted 12 March 2012
Keywords: Patient Safety; Patient Safety Grade; Perceived Prevalence of Medical Errors
ABSTRACT
Background: Even though evidences are limited in developing countries, the probability of patients being harmed in hospitals when receiving care might be much greater than that of the industrialized nations. Thus, aim of this study was to assess patient safety practice and the perceived prevalence of medical errors at Jimma University Specialized Hospital, Southwest Ethiopia. Methods: A facility based cross-sectional study was conducted during June, July and August 2010 in Jimma University Specialized Hospital. Patient safety grade and the perceived prevalence of medical errors were computed descriptively. Then, the effect of various independent variables on patient safety grade was assessed using multiple linear regressions analysis. Result: The overall patient safety grade as rated by the participants was excellent (7.2%), very good (20.7%), acceptable (36.0%), poor (30.0%) and failing (6.4%). Complications related to anesthesia occurred sometimes, rarely and never according to 30.8%, 43% and 15.8% of the respondents, respectively. Death in low mortality patients was reported to occur most of the time by 10.4% of the respondents. In addition, failure to rescue, infection due to medical care, postoperative hemorrhage, postoperative sepsis, birth injury to the neonate, obstetric trauma to the mother were reported to happened. Supervisor expectation and actions promoting patient safety (p < 0.001), and communication openness and feedback about errors (p = 0.002) had positive correlation with patient safety grade. Conclusion: this study indicated that poor patient safety practice and potentially preventable medical errors in the hospital.
1. INTRODUCTION
Patient safety is a serious global public health issue [1]. Estimates show that in developed countries as many as one in 10 patients is harmed while receiving hospital care [2]. Even though evidences are limited in developing countries, the probability of patients being harmed in hospitals when receiving care might be much greater than that of the industrialized nations due to a number of complex reasons [3]. For instance, a report claimed that the risk of health care-associated infection in developing countries is up to 20 times higher than in developed countries [4].
Occasionally when people receive health care, errors associated with care may result in a serious harm such as death, disability or additional prolonged treatment. In addition, it may also cause indirect health care costs and productivity losses [5-7]. It also affects the customer perception, attitude and trust [8]. On the other side, it may also affect providers’ confidence and integrity [9].
Patient safety is defined as, “freedom from accidental injury due to medical care, or medical errors”. And medical error is defined as the failure of a planned action to be completed as intended or the use of a wrong plan to achieve an aim. Errors can include problems in practice, products, procedures and systems [5].
The root causes of medical errors are mainly embedded in: first, human factors; problems associated with health care providers include variations in training and experience, fatigue, depression and burnout, diverse patients, unfamiliar settings, time pressures, communication errors, and failure to acknowledge the prevalence and seriousness of medical error [4]. Second, system failures in health care delivery include poor communication, unclear lines of authority of physicians, nurses, and other care providers, complications increase as increased patient to nurse ratio, disconnected reporting systems within a hospital, inadequate systems to share information about errors and so on [5].
Even though the sources of medical errors are broadly categorized into human and system factors, the existing evidence shows “the majority of medical errors do not result from individual recklessness or the actions of a particular group. More commonly, errors are caused by faulty systems, processes, and conditions that lead people to make mistakes or fail to prevent them.” Individual vigilance and responsibility are of course necessary [5].
A report of the World Health Organization (WHO) regional director stated, “In the African Region, most countries lack national policies on safe health-care practices. Inappropriate funding and unavailability of critical support systems including strategies, guidelines, tools and patient safety standards remain major concerns in the region.” Furthermore, the report implied that understanding of the problems associated with patient safety is hampered by inadequate data [10].
Ethiopia is not an exception to this state of the problem. There exists little empirical evidence about patient safety culture and medical errors in the study area in particular and the health system of Ethiopia in general. But circumstantial evidences show that almost all medical errors have been treated traditionally through blaming, shaming and punishment. Moreover, most medical errors are not reported and/or hidden. Consequently, health professionals and managers are not in a position to learn from mistakes committed in the health institutions. Therefore, the main aim of this study was to assess patient safety practice and the perceived prevalence of medical errors from the perspective of the health care providers at Jimma University Specialized Hospital (JUSH), Southwest Ethiopia.
2. METHOD AND PARTICIPANTS
2.1. Study Design and Period
A facility based cross-sectional study was conducted during June, July and August 2010.
2.1.1. Setting
Study setting is Jimma University Specialized Hospital; it is a public health institution owned by Jimma University, found in Jimma Town, 356 Kms Southwest of Addis Ababa, the capital of Ethiopia. Currently the hospital has an annual government allocated budget of 15.5 million Birr (US $1.6 million) with bed capacity of 450 and a total of more than 550 employees (both technical and support workers). It provides services for approximately 9000 inpatient, 5000 accident and emergency cases and 85,000 outpatient attendances each year. The population being served by the hospital exceeds five million including people from southern part of Sudan. The hospital delivers health services in many specialty areas. These include gynecology and obstetrics, surgery, pediatrics and child health, internal medicine, ophthalmology, psychiatry, and dentistry. During the last two years the management body of the hospital is intensely occupied with efforts of change management towards improvement of patient flow problems and other quality parameters.
2.1.2. Study Participants
All health care professionals who have been involved in patient treatment and care in the different units of the hospital during data collection (pediatricians, gynecologists and obstetricians, surgeons, internists, general practitioners (GP), residents, registered nurses and medical interns) and who have worked at least for six months prior to the conduct of the data collection were included in this study.
2.1.3. Sample size and Sampling Techniques
Since the number of the health care providers was manageable all the health care providers fulfilling the inclusion criteria were included in the study.
2.1.4. Study Tool and Data Collection
Survey instruments were adapted from Patient Safety Indicators (PSIs) survey tools for provider and area-level indicators, and patient safety culture survey instrument of Agency of Healthcare Research and Quality (AHRQ) [11]. Before the actual use of the survey tool we held discussion with different professionals on the survey tool to contextualize the content and verify language simplicity and sequence. Then we pre-tested the survey tool and participants of the pre-test were contacted to give their general feeling, comments and problems encountered while responding the questions. Finally, relevant modifications of the tools were made before the start of data collection.
Data were collected through interviewer administered data collection technique. Trained individuals facilitated the data collection from the different units of the hospital. The completed data were submitted immediately to the research team members who checked its completeness and consistency.
2.2. Measurements
The dependent variables of the survey were patient safety grade and perceived prevalence of medical errors. Independent variables: teamwork across hospital units, hospital handoffs & transitions, communication openness, and feedback about errors, and socio-demographic characters and work experiences of the participants. Detail description of the study measurement is given below.
2.2.1. Patient Safety Grade
Patient safety grade: was assessed using a single-item Likert’s scale. The response categories ranged from lowest (failing) through highest (excellent); (Failing = 1, Poor = 2, Acceptable = 3, Very good = 4 and Excellent = 5).
2.2.2. Provider-Level Patient Safety Indicators
In the absence of clear reporting system it is impossible to apply the Patient Safety Indicators (PSIs) tool as it is. Hence, in this study we applied the Patient Safety Indicators (PSIs) tool indirectly where we used it to assess how health care providers perceived the frequency of specific events that happened in their working units in the past 12 months. Twenty indicators of events with six response categories (always, most of the time, sometimes, rarely, never happened and not applied) were used to assess patient safety culture and medical errors in the hospital. Throughout this paper we will call these “provider-level patient safety indicators”.
2.2.3. Frequency of Event Reporting
Frequency of event reporting was measured using three items considering three different scenarios. The first considered a condition where a medical mistake is made but is caught and corrected before affecting the patient while the second considered a situation where a mistake is made but has no potential to harm the patient. Finally, a situation where a mistake is made that could harm the patient but does not, was considered. Respondents were requested to rate the frequency of reporting of such events in their particular units. Each item had five categories of responses (1 = never, 2 = rarely, 3 = sometimes, 4 = most of the time and 5 = always). The reliability coefficient (Cronbach’s alpha) of the scale is 0.70. The items in the scale were subjected to factor analysis and one item with Eigen value greater than one was identified and was used in further analysis. This item state, “When a mistake is made, but is caught and corrected before affecting the patient, how often is it reported?” It accounted for 62.7% of the variance in the frequency of event reporting.
2.2.4. Supervisor Expectations & Actions Promoting Safety
Supervisor expectations & actions promoting safety was measured using a scale of three item. These are: my supervisor says a good word when he/she sees a job done according to established patient safety procedures; my supervisor seriously considers staff suggestions for improving patient safety and whenever pressure builds up, my supervisor/manager wants us to work faster, even if it means taking shortcuts. Each item had five response categories ranging from strongly disagree (1) to strongly agree (5). The scale had a reliability coefficient of 0.71 which increased to 0.80 when the third item was deleted. The items were subjected to factor analysis and the first item (“my supervisor says a good word when he/she sees a job done according to established patient safety procedures”) was extracted to represent the scale. This factor explained 62% of the variance in supervisor expectations and actions promoting patient safety among the respondents.
2.2.5. Teamwork within Hospital Units
Teamwork within hospital units was measured using four items (people support one another in this unit, when a lot of work needs to be done quickly, we work together as a team to get the work done, people treat each other with respect and when one area in this unit gets really busy, others help out). The response categories of the items were strongly disagree (1) through strongly agree (5). The items were internally consistent with Cronbach’s alpha value of 0.70. The scale was subjected to factor analysis and the item “people support one another in this unit” had Eigenvalue greater than one and accounted for 52.6% of the variance in perception of the health professionals about teamwork within the hospital units.
2.2.6. Communication Openness and Feedback about Error
Communication openness and feedback about error was measured using a Likert scale of five items. The items were 1) staff will freely speak up if they see something that may negatively affect patient care; 2) staffs feel free to question the decisions or actions of those with more authority; 3) we are given feedback about changes put into place based on event reports; 4) we are informed about errors that happen in this unit; and 5) in this unit, we discuss ways to prevent errors from happening again. Response categories run from never (1) through always (5). The reliability co-efficient of 0.73 showed that the scale is internally consistent. After factor analysis, the item “staff will freely speak up if they see something that may negatively affect patient care” having Eigen value greater than one was extracted and it accounted for 48.6% of the variance in communication openness and feedback about error within the hospital units.
2.2.7. Teamwork across the Hospital Units
Teamwork across the hospital units was measured using a scale of two items. respondents were to forward their level of agreement to The items “There is good cooperation among hospital units that need to work together” and “Hospital units work well together to provide the best care for patients”. The response categories of the items were strongly disagree (1) through strongly agree (5). The Cronbach’s alpha value of the items was 0.67. The item “there is good cooperation among hospital units that need to work together” was extracted after factor analysis and it accounted for 61% of the variance in the perception of the respondents about teamwork across the hospital units.
2.2.8. Hospital Handoffs & Transitions
Hospital Handoffs & Transitions was measured using a scale having three items. These were 1) Things “fall between the cracks” when transferring patients from one unit to another; 2) Important patient care information is often lost during shift changes; and 3) Shift changes are problematic for patients in this hospital. Each item had five response categories ranging from strongly disagree (1) to strongly agree (5). Cronbach’s alpha value of the scale was 0.65. The item extracted to represent the scale after factor analysis was “Things ‘fall between the cracks’ when transferring patients from one unit to another” and it accounted for 58.5% of the variance in the perception of the respondents about hospital handoff and transitions.
2.3. Statistical Analysis
The data were analyzed by SPSS statistical software version 16.0. Patient safety grade and the perceived prevalence of medical errors were computed descriptively. Then, the effect of various independent variables on patient safety grade was assessed by three different models using multiple linear regression analysis. In the first model, the effects of socio-demographic characters and work experience variables were assessed while in the second model we considered the effects of different dimensions of patient safety culture items. Factors (items) having Egne value greater than one after the scale was treated by factor analysis were considered for the correlation tests. Finally, the third model included the composite variables of different dimensions of patient safety culture. In all cases, P < 0.05 and 95% confidence interval was used to check statistical associations.
Items with low reliability coefficients: staffing, nonpunitive response to error, and overall perceptions of safety were excluded from the analysis and the response for the number of events reported was also excluded since there exists no reporting system for events in the hospital. In addition, questionnaires most of the items not answered and every item which has the same answer were also excluded from the analysis. Besides, the reverse scoring was used for negatively worded items.
2.4. Ethical Considerations
Ethical approval was obtained from Jimma University Ethical Review Committee to conduct the study. Permission was obtained from Jimma University Specialized Hospital and a written consent was obtained from each study participant. No personal identification or name was used and individual’s information was not disclosed to other person or party. Participants had full right to participate or refuse participation in this study.
3. RESULTS
Of the total 215 survey questionnaires distributed to different units in the hospital 171 were returned, of these 11 incomplete questionnaires were excluded. Finally, 160 completed survey questioners were considered for the analysis which gives a response rate of 74.4%.
3.1. Study Participants
From the total participants around 60% were males while the remaining 40% were female health care providers. The mean age of the participants was 27.3 (± 6.76 years). Nearly 66% of the participants were permanent employees of the hospital where as 44% of them working in contract. Regarding their staff position, senior doctors (pediatricians, gynecologists and obstetricians, surgeons, internists and ophthalmologists, and psychiatrist) accounted for 12.5% of the participants, residents and medical interns 42%, and 28.1% were registered nurses. Participants also had 7.2 (± 6.6) years of working experiences in the hospital. In addition they have a mean working hours of 53 (± 21) per week (Table 1).
3.2. Over All Patient Safety Grade
Patient safety grade is one of the variables of interest in the study. The study participants were asked to rate the overall patient safety grade in their respective work units. Accordingly, 7.2% and 20.7% of the respondents rated the patient safety as excellent and very good, respectively. About 36% of the respondents rated it as acceptable and nearly one third (30%) rated it to be poor and the remaining 6.4% of the respondents as failing (Figure 1).
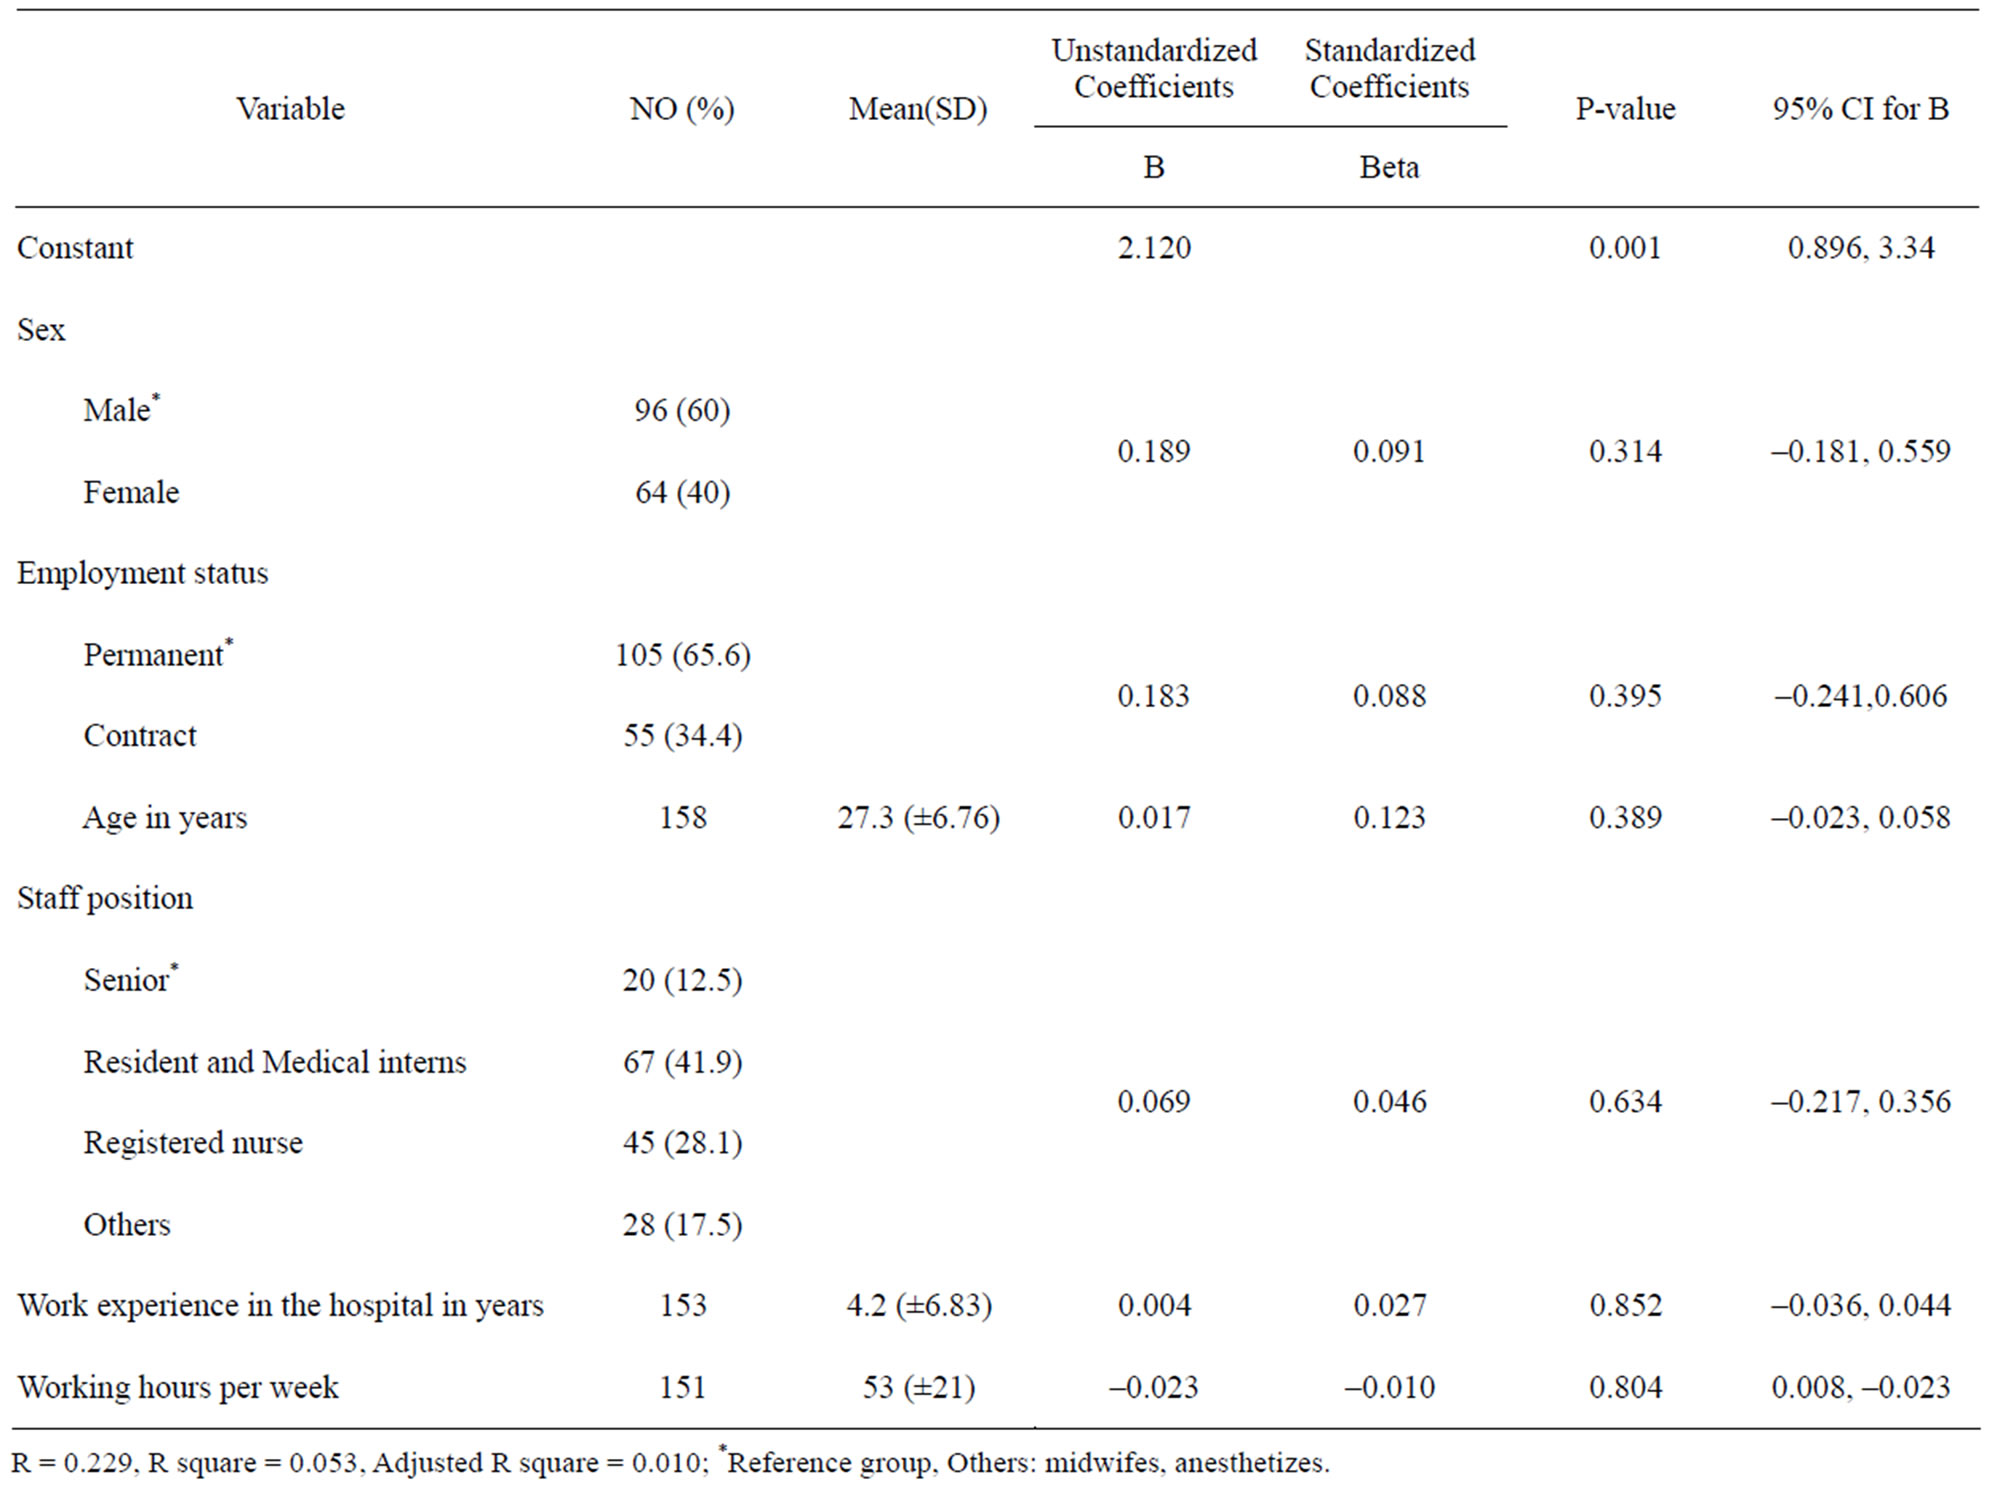
Table 1. Socio-demographic predictors of patient safety grade at Jimma University Specialized Hospital, Southwest Ethiopia, JuneAugust 2010.

Figure 1. Patient safety grade at Jimma University Specialized Hospital as given by the health care providers, June-August 2010.
3.3. The Prevalence Medical Errors in the Past 12 Months
The provider-level safety indicators, as perceived by the health care providers were used to provide information on the prevalence of potentially preventable complications for patients who received care in the different units during the past 12 months. Table 2 below shows the magnitude of twenty events that have occurred in the hospital during the past 12 months prior to the study.
Complications related to anesthesia occurred sometimes, rarely and never according to 30.8%, 43% and 15.8% of the respondents, respectively. Death in low mortality patients was reported to occur most of the time by 10.4% of the respondents; while 28.5%, 36.8% and 20.8% reported sometimes, rarely and never happened, respectively. Although 38.4% and 25.9% of the respondents claimed that decubitus rarely and never happen in admitted patients, respectively, about one in ten of the care providers felt that patients develop decubitus ulcer most of the time while 2.1% of the respondents claimed that this occurs always. Likewise, the occurrence of failure to rescue was reported as it happened sometimes and rarely by 35.2% and 33.8% of the respondents, respectively. On the other hand, infection due to medical care occurs sometimes as rated by 37.5% of the respondents while16% of the care providers claimed that it never happens in their patients (Table 2).
In regard to surgical and obstetric procedures, postoperative hemorrhage was reported to occur sometimes by 32.4% of the care providers. An equivalent proportion of the care providers (33.8%) claimed that it rarely happens in their patients, and almost one fifth of them said it never happens. Postoperative sepsis occurs sometimes according to 43.8% of the care providers and only less than one in five said it never happens in their patients. Although birth injury to the neonate also reported to never occurs as reported by 27.7% of the health professionals, it is said to occur sometimes by a bit higher proportion of the professionals (31.1%). Similarly, obstetric trauma to the mother happened rarely to always as reported by the majority of the care providers. In addition to this, postoperative physiologic and metabolic problems, postoperative respiratory failure, postoperative pulmonary embolism/deep vain thrombosis, and postoperative hip fracture reported that to be occurred in various rate from always to never happen in the hospital (Table 2).
3.4. Socio-Demographic Predictors of Patient Safety
The first model consisting the socio-demographic variables such as age, sex, staff position, employment status, working experience and length of working hours per week explained 5% of the variance in the patient safety grade given by the participants (R square = 0.053, P = 0.001), however none of the socio demographic variables showed statistical significant difference in the patient safety grade given (Table 1).
3.5. Safety Culture Dimension Predictors of Patient Safety Grade
In this model patient safety culture items which accounted for major variability from each six dimensions were used. These are (People support each other in this unit, My supervisor say good when work is done according to patient safety procedure, Staff will freely speak up if they see something that may affect negatively patient care, When a mistake is made, but caught and corrected before..., Things forgotten when patient transferring form one unit to another, and There is good cooperation among units that need work together). This model explained about 32% (R square = 0.319) of the variance in the patient safety grade among the respondents. “My supervisor says good when work is done according to patient safety procedure” (p < 0.001), and “staff freedom to speak up on some thing that may affect patient care” (P < 0.05) have positive significant correlation with patient safety grade. However, “things are forgotten when a patient is transferred from one unit to another” has negative correlation with patient safety grade though it is not statistically significant (P > 0.05). The remaining variables have no statistical significant correlation with patient safety grade (Table 3).
3.6. Over All Patient Safety Culture Predictors of Patient Safety Grade
From each safety culture dimensions one composite variable was identified during factor analysis. And in this model the effect of each composite safety culture dimensions (Frequency of event reporting, Supervisor expectation and actions promoting patient safety, Team work with in the hospital units, Communication openness and feedback about errors, Teamwork across the hospital units, and Hospital handoffs and transitions) were examined on patient safety grade. And this model better explained the variance in the patient safety grade than above model, about 42% of the variance in the patient safety grade is explained by this model (R square = 0.422). Supervisor expectation and actions promoting patient safety (p < 0.001), and communication openness and feedback about errors (p = 0.002) had positive correlation with patient safety grade. On the other hand, hospital handoffs and transitions have negative correlation with patient safety grade. The remaining patient safety culture dimensions variables have no statistical significant correlation (Table 4).
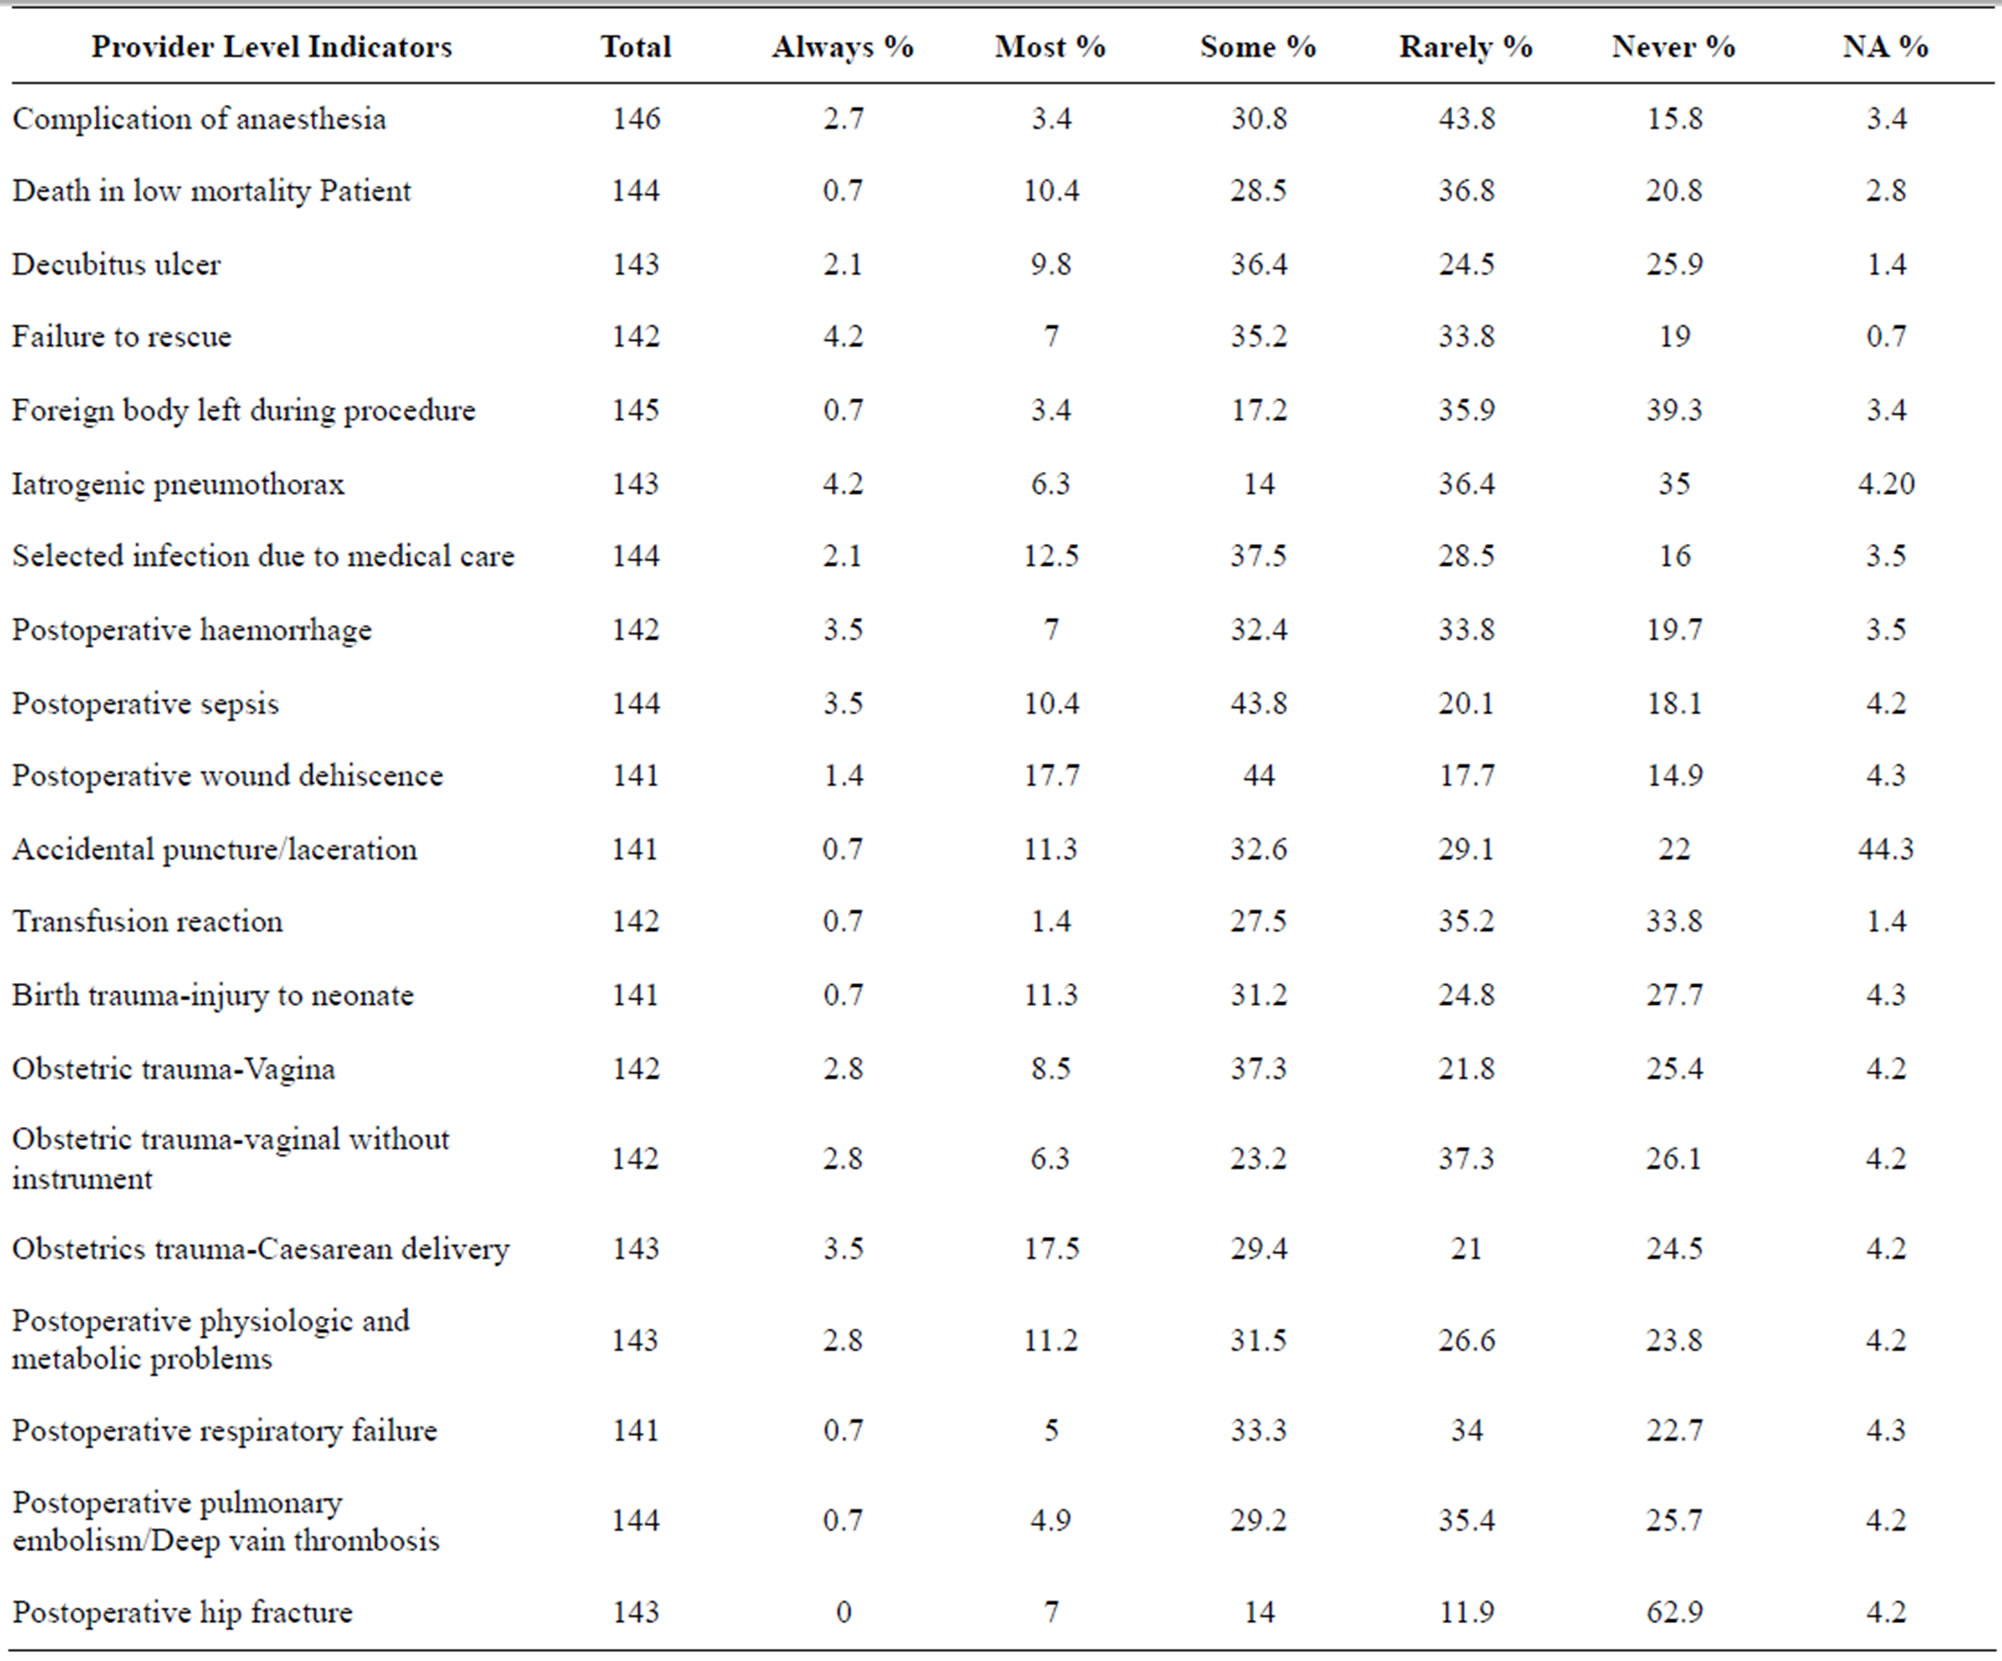
Table 2. The perceived prevalence of medical errors at Jimma University Specialized Hospital, Southwest Ethiopia, June-August 2010.
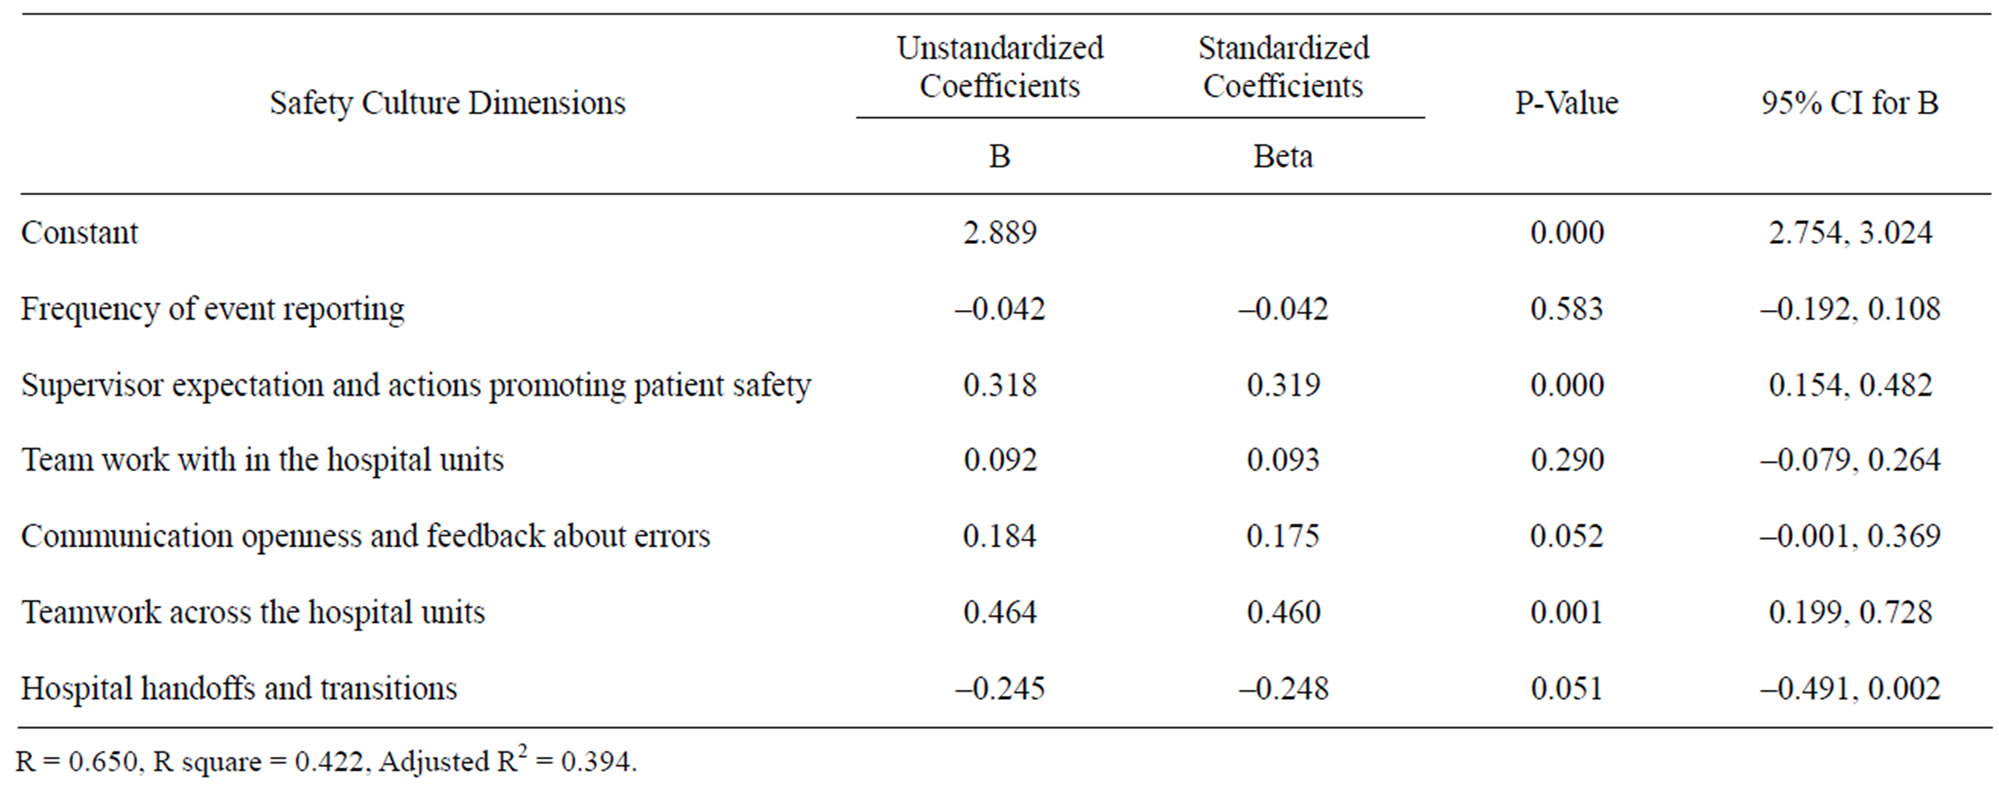
Table 3. Patient safety items predicting patient safety grade at Jimma University Specialized Hospital, Southwest Ethiopia, JuneAugust 2010.
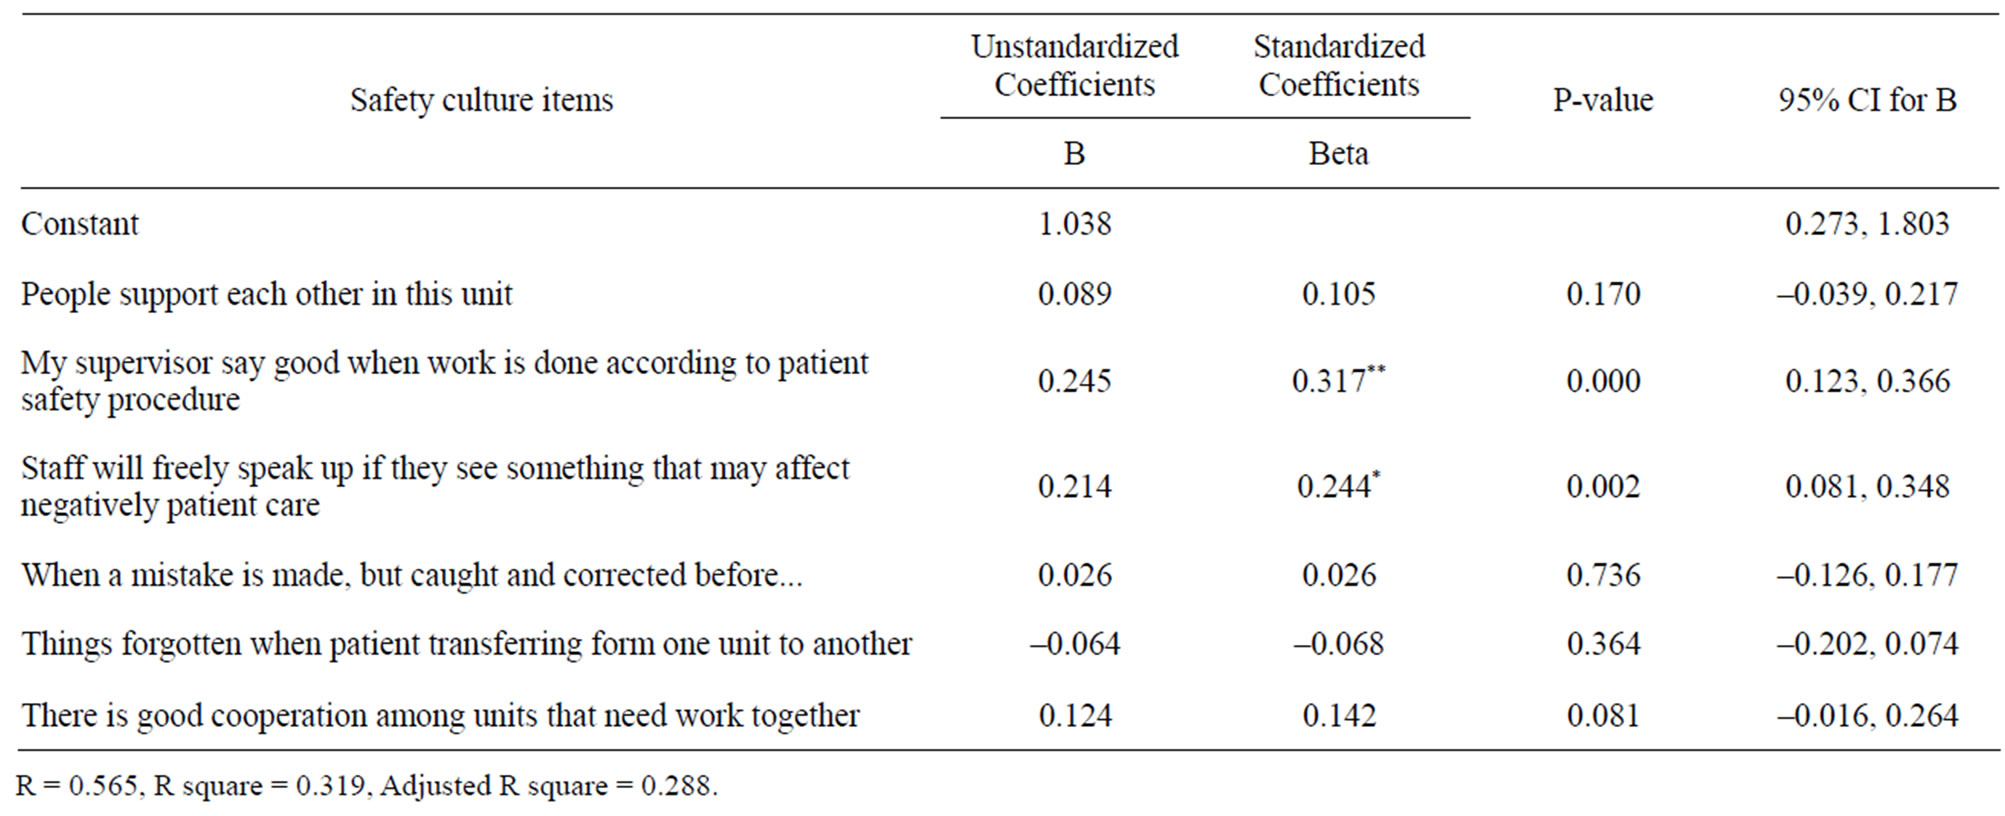
Table 4. Overall predictors of patient safety grade at Jimma University Specialized Hospital, Southwest Ethiopia, June-August 2010.
4. DISCUSSION
Patient safety is a well recognized global public health issue [1]. Even in developed countries as many as one in 10 patients is harmed while receiving hospital care [2]. Similarly, in this study the patient safety problem is well understood by health care providers. This is clearly explained by the patient safety grade given: more than one third of the participants rated the patient safety grade as it is poor and failing and the perceived problem of medical errors; nearly two-third of the rating falls between most of the time and rare, never happened is reported only by few respondents. It implied that potentially preventable medical errors are common. System related patient safety culture dimensions were found to be the most important predictors of patient safety grade.
Patient safety is said to imply freedom from accidental injury during medical care [5]. However, our findings show that most individuals who receive care at the JUSH are not free from different types of medical errors including obstetric trauma and injury, postoperative sepsis, complication of anesthesia and transfusion, and failure to rescue. Hospital acquired infections were also perceived to be common problem. Similarly, WHO reported that 7% of the countries in the African Region did not test all donated blood for HIV; 22% did not test for hepatitis B and 51% did not test for hepatitis C during the year 2004 [12]. Moreover, the proportion of infections caused by syringes or needles reused without sterilization in this region ranges from 1.5% to 69.4% [13]. The risk of healthcare-associated infection is reported to be up to 20 times higher for patients in developing countries than for patients in developed countries [4].
There are several complex explanations for the high medical care associated errors in developing countries. The report of the WHO regional director for Africa region and other evidences pointed out: inadequate human resources for health, poor management capacity and under-equipped health facilities, lack of adequate working conditions in hospitals, lack of training of health care professionals, commitment to infection control procedures and standards, knowledge about medical error and their consequences, poor infrastructures/buildings make up the major underlying problems in the health systems [10,14,15]. In addition overemphasizing on quantity and access also mentioned as a reason to the less attention paid for medical errors in developing countries [14].
Through this study we understood the absence of clear documentation and reporting system for medical errors and events throughout the hospital. Other studies also observed that in many developing countries there is no reliable documentation and reporting system for medical errors [14,15]. However, it has been argued that having good documentation and reporting system will help to establish a system that protect both providers and patients from medical errors and its adverse consequences and to learn from events [3].
In this study the system related factors: supervisor expectation and actions promoting patient safety, communication openness and feedback about errors, teamwork across the hospital units, and hospital handoffs and transitions explained 42% of the variance in patient safety grade among providers where as the socio-demographic and working experiences related factors: age, sex, work experiences and working hours per week explained the variance in patient safety grade 5% only.
The finding implies the system factors are the most important factors in patient safety culture and causes of medical errors in the hospital. Similarly, as empirical evidences have revealed the root causes of medical errors are primarily the system factors include poor communication, unclear lines of authority between care providers, staffing, disconnected reporting systems within a hospital, and inadequate systems to share information about errors. And human factors are also important next to the system related factors [4,5].
The Institute of Medicine (IOM) reported that most of the medical errors are systems related and not attributable to individual negligence or misconduct [16,17]. In addition, it is also recommended that improving the systems of delivering care and not to blame individuals is the key to reducing medical errors [17,18]. System improvements can also reduce the error rates and improve the quality of health care 17. On the contrary, the personal approach will not solve the problem [3,17,18].
In conclusion, the study indicates the presence of low patient safety practice and potentially preventable medical events in the hospital are common. As the correlates of patient safety grade shows the system factors are the most important predictors of patient safety grade in the hospital than the human factors, which have low patient safety grade predictive value variation among the participants. As a result, due attention should be given for system factors to improve patient safety and to reduce medical errors in Jimma University Specialized Hospital and further investigation on human related factors is recommended.
This study came up with findings which highlight the nature of patient safety practice and the magnitude of potentially preventable medical errors including those related to system factors. However, the study did not address the perception of patients and customers about patient safety and medical errors. The effect of some safety culture dimensions items were not examined since we excluded items with low Cronbach’s alpha value from the analysis. Other non-medical and medical staffs from laboratory, X-ray, and pharmacy units were not included.
6. ACKNOWLEDGEMENTS
The researchers would like to extend thanks to all study subjects who took their time to respond to the survey questions. The research was financed by Jimma University.
REFERENCES
- Euro Med. (2008) Patient safety: A global public health issue and a concern for Europe. Lunch Debate, MedTech Forum.
- Richard, E.A. and Joseph, A.B. (2004) A community survey of medical errors in New York. International Journal for Quality in Health Care, 16, 353-362. doi:10.1093/intqhc/mzh063
- WHO (2002). Health professionals call for priority on patient safety. World Health Professions Alliance Fact Sheet.
- The Medical News (2007) Hand hygiene initiative aims to decrease healthcare associated infection in developing countries. The Medical News, 21, 35. http://www.journals.uchicago.edu/
- Institute of Medicine (1999). To err is human: Building a safer health system. National Academy Press, Washington DC.
- Manasse, H.R. Jr. Turnbull J.E. and Diamond, L.H. (2002) Patient safety: Review of the contemporary American experience. Singapore Medical Journal, 43, 254-262.
- National Audit Office (2005), A safer place for patients: Learning to improve patient safety. The Controller and Auditor General, London.
- Charlton Research Company for Research America (2005) Health care and health services research. National Survey.
- Waterman, A.D., Garbutt, J., Hazel, E., Dunagan, W.C., Levinson, W., Fraser, V.J. and Gallagher, T.H. (2007) The emotional impact of medical errors on practicing physiccians in the United States and Canada. The Joint Commission Journal on Quality and Patient Safety, 33, 467- 476.
- Regional Committee for Africa of WHO (2008) Patient safety in African health services: Issues and solutions. Yaounde, Republic of Cameroon.
- Westat, R., Joann, S. and Veronica, N. (2004) Hospital survey on patient safety culture; Agency for healthcare research and quality US Department of Health and Human Services AHRQ. http://www.ahrq.gov
- Tapko, J.B., Sam, O. and Diarra-Nama, A.J. (2004) Status of blood safety in the WHO African region: Report of the 2004 survey, World Health Organization, Regional Office for Africa, Brazzaville.
- Kermode, M. (2004) Unsafe injections in low-income country health settings. Need for injection safety promotion to prevent the spread of blood-borne viruses. Health Promotion International, 19, 95-103. doi:10.1093/heapro/dah110
- Lori, D.B., Lynne, M.F., Nadwa, R. and Theresa, H. (1998) Quality assurance of health care in developing countries; Quality Assurance Methodology Refinement Series. Quality Assurance Project, USA.
- Ietje, H.R. and Rainer, S. (1996) Quality of primary health care in developing countries: Recent experiences and future directions. International Journal for Quality in Health Care, 8, 131-139.
- Rockville (2000) Medical errors: The scope of the problem. Agency for Healthcare Research and Quality. http://www.ahrq.gov/qual/errback.htm
- Dankelman, J. and Grimbergen, C.A. (2005) Systems approach to reduce errors in surgery. Surgical Endoscopy, 19, 1017-1021. doi:10.1007/s00464-005-8109-0
- Mikkelsen, J.M. and Holm, H.A. (2007) Contextual learning to improve health care and patient safety. Education for Health, 20, 3. http://www.educationforhealth.net
NOTES
*Competing Interests: We declared that we do not have any competing interests throughout this research work. Authors’ Contributions: TA and MW were involved in the design, analysis and interpretation of the data, and manuscript writing. SO and KW were involved in the design of the study and manuscript writing.