Open Journal of Physical Chemistry
Vol.2 No.4(2012), Article ID:24967,12 pages DOI:10.4236/ojpc.2012.24032
Investigation of Chiral Molecular Micelles by NMR Spectroscopy and Molecular Dynamics Simulation
1Department of Chemistry, Carthage College, Kenosha, USA
2Department of Physical and Environmental Sciences, Texas A & M University, Corpus Christi, USA
3Office of Naval Research, Arlington, USA
4Department of Biochemistry and Molecular Biology, Howard University College of Medicine, Howard University, Washington DC, USA
Email: *yfang@howard.edu
Received July 10, 2012; revised August 12, 2012; accepted September 15, 2012
Keywords: NOESY; Chiral Recognition; Polymeric Surfactant; Molecular Modeling
ABSTRACT
NMR spectroscopy and Molecular Dynamics (MD) simulation analyses of the chiral molecular micelles poly-(Sodium Undecyl-(L,L)-Leucine-Valine) (poly-SULV) and poly-(Sodium Undecyl-(L,L)-Valine-Leucine) (poly-(SUVL)) are reported. Both molecular micelles are used as chiral selectors in electrokinetic chromatography and each consists of covalently linked surfactant chains with chiral dipeptide headgroups. To provide experimental support for the structures from MD simulations, NOESY spectra were used to identify protons in close spatial proximity. Results from the NOESY analyses were then compared to radial distribution functions from MD simulations. In addition, the hydrodynamic radii of both molecular micelles were calculated from NMR-derived diffusion coefficients. Corresponding radii from the MD simulations were found to be in agreement with these experimental results. NMR diffusion experiments were also used to measure association constants for polar and non-polar binaphthyl analytes binding to both molecular micelles. Poly (SUVL) was found to bind the non-polar analyte enantiomers more strongly, while the more polar analyte enantiomers interacted more strongly with poly(SULV). MD simulations in turn showed that poly(SULV) had a more open structure that gave greater access for water molecules to the dipeptide headgroup region.
1. Introduction
The specificity and efficacy of many biologically important reactions are based on chiral interactions, a fundamental phenomenon that is observed in all biological systems. More often than not, the pharmaceutical properties and toxicities of enantiomers are quite different. Therefore, an understanding of the factors governing chiral recognition is extremely important. While significant progress has been made, from both a fundamental and application-oriented perspective, a complete understanding of chiral recognition has yet to materialize.
Since the Federal Food and Drug Administration mandated in 1992 that producers of pharmaceuticals evaluate the effects of individual enantiomers separately and verify the enantiomeric purity of chiral drugs, the number of publications focused on chiral separations has skyrocketed. This research has lead to the development of many chiral separation media for the enantiomeric resolution of chiral compounds including chiral cyclodextrins, surfactants, and polymers [1]. The focus of this investigation is two chiral polymers formed by covalently linking amino acid based surfactant monomers. These materials are known as Molecular Micelles (MM) because they contain a hydrophobic hydrocarbon core and hydrophillic amino acid headgroups. However, unlike conventional micelles covalent linkages attach the surfactant chains into a single macromolecular structure. Here MD simulations and NMR spectroscopy were used to investigate the structures of MM with headgroups containing the amino acids leucine and valine.
The use of amino acid based MM as pseudostationary phases for the enantiomeric separation of chiral compounds in capillary electrokinetic chromatography (EKC) was initially introduced by Wang and Warner in 1994 [2]. In EKC, analyte enantiomers are separated based upon their differential interactions with the chiral MM amino acid headgroups as they are both pulled through a capillary under the influence of an electric field. Since this initial report of chiral EKC separations with amino acid based MM, subsequent studies have shown that MM have several advantages over conventional micelles as chiral separation media [3-15]. First, the covalent linkages between the monomer units of the MM provides a rigid structure which improves the mass-transfer rate between the MM and the solute, thereby reducing peak broadening in EKC. In addition, the covalent linkages eliminate the dynamic equilibrium between micelles and monomers and since MM have no critical micelle concentration, they can be used as pseudostationary phases over a wider range of concentrations than unpolymerized surfactants. Finally, MM are more stable than conventional micelles in separations utilizing high concentrations of organic modifiers [16].
In order to characterize more fully the structures of these chiral selectors in aqueous solution, we have studied the properties of two MM with dipeptide headgroups containing the same amino acids, but differing in order in which the amino acids are connected. The rationale for this choice is as follows. It has been observed experimentally that dipeptide based MM are, in general, better chiral selectors than comparable polymers with a single amino acid headgroup [4]. Also, experimental results have shown that differences in amino acid order and thus the position of the chiral centers in the dipeptide headgroup have a dramatic effect on chiral selectivity and the physical properties of the MM [6]. It was hypothesized that these differences were due in part to the steric and hydrophobic forces governing the orientation of the R-groups of the amino acids. From these results, a structural model of the dipeptide surfactants was proposed [9]. Part of the purpose of this investigation was to examine the validity of this model and to develop a more detailed picture of the effect that amino acid order has on the dipeptide MM structure.
The specific MM examined in this study are poly-(sodium undecyl-(L,L)-leucine-valine) (poly-SULV) and poly-(sodium undecyl-(L,L)-valine-leucine) (polySUVL)). Figure 1 shows the chemical structures of these MM along with the proton labels used in the NMR analyses. These two compounds were chosen because previous experimental work has shown that poly(SULV) is a relatively versatile chiral selector as compared to poly (SUVL). For example, in a study done by Shamsi, et al. to examine the versatility of poly(SULV) as a chiral selector, successful enantioseparation of 58 out of 75 different racemic compounds was reported using poly(SULV) as the chiral selector [17]. In contrast, chiral selectivity with poly(SUVL) is generally relatively poor [9]. Thus comparison of the structures of these two MM would be expected to highlight MM structural features that correlate with chiral selectivity. This project is also part of a
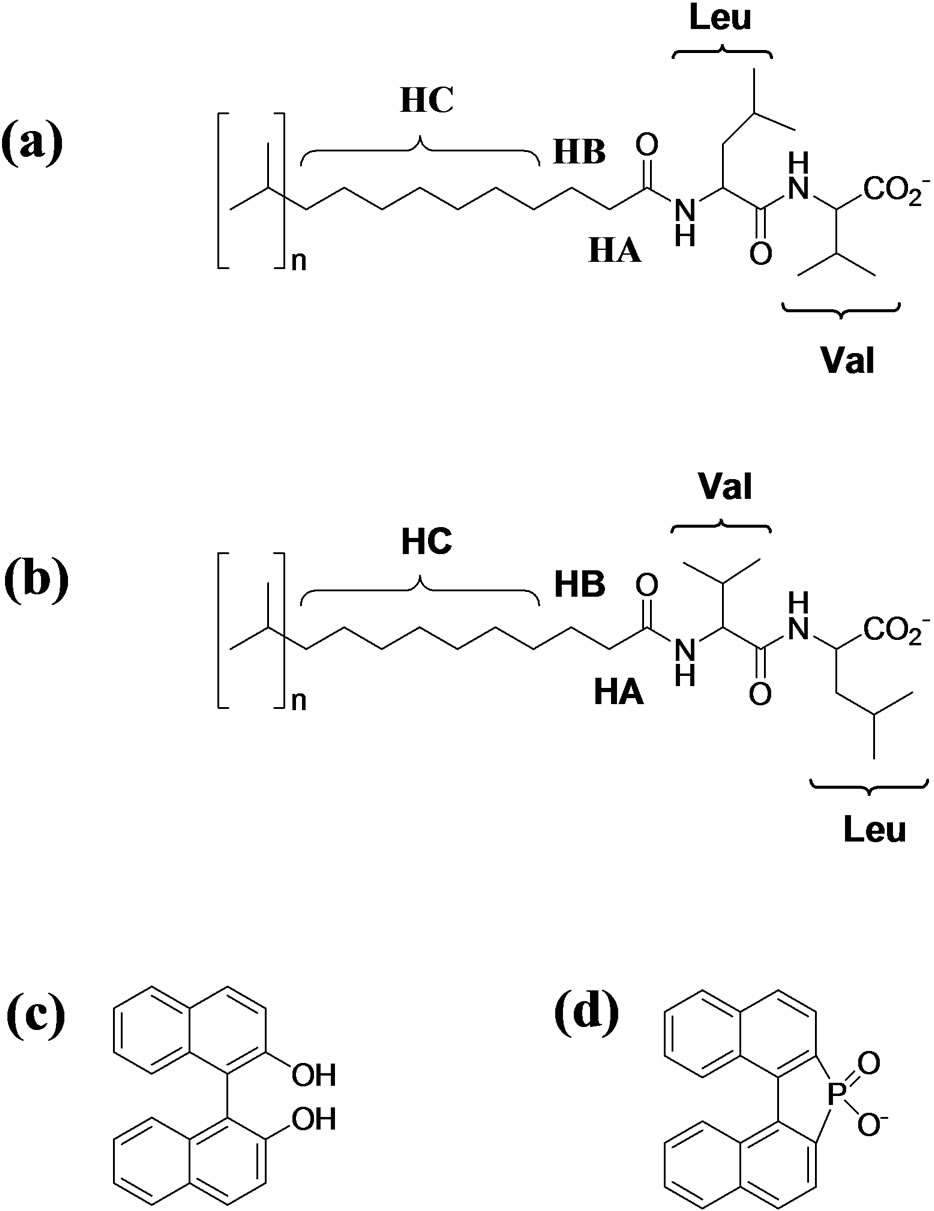
Figure 1. Molecular structures of (a) poly(SULV); (b) poly(SUVL); (c) BOH; and (d) BNP. The proton labels in the molecular micelle structures are used in the NMR analyses.
broader effort to use MD simulations to investigate chiral recognition by MM. Here we present the first stage of this effort. The goal of this study was to establish MD simulations as a viable method for investigating MM structures by comparing poly(SULV) and poly(SUVL) MD simulation results to experiment. Subsequent MD simulation analyses will then be used to probe MM structures in greater detail and to investigate the structural and dynamic properties of chiral analyte: MM intermolecular complexes.
While, many studies have employed MD and Monte Carlo simulations to examine the structural and dynamic properties of micelles [18-22], micelle formation [23-28], and the behavior of water in micellar solutions [29], few simulation studies have investigated MM. The MM investigated here were synthesized by gamma-irradiating amino acid based surfactant solutions at a concentrations ~5 - 20 times the critical micelle concentration. The gamma radiation causes free radical polymerization of the vinyl group at the end of the hydrophobic tail. Subsequent fluorescence quenching studies of the MM showed that the average aggregation number (number of repeat units for the polymers) was ~18 - 23 at room temperature [30]. While the exact nature of the connectivity of the surfactant monomers is not known, here we assumed that the hydrophobic tails are covalently linked one to another in the core of the micelle.
The computational results obtained for poly(SULV) and poly(SUVL) were compared to experimental results from NMR spectroscopy. NMR was first applied to the study of amino acid based surfactants by Ruggart, et al. [31]. This study showed that the dipeptide headgroup of poly(SULV) adopted a folded conformation containing a chiral groove or pocket into which chiral analytes inserted. NMR spectroscopy has also been used to measure the free energies of binding of chiral analytes to MM and to identify the primary chiral recognition site on the dipeptide headgroup [32-34]. Here two-dimensional NOESY spectra were used to identify MM headgroup atoms that were in close spatial proximity. The separation of corresponding atoms predicted by the MD simulations were then compared to these experimental results. In addition, the MM radii from the MD simulations were compared to hydrodynamic radii calculated from NMR-derived diffusion coefficients. Finally, association constants for the binding of both polar and non-polar chiral compounds to the MM were measured with NMR. These results were then used to rationalize the number of water molecules occupying the MM hydrocarbon core and dipeptide headgroup regions in the MD simulations.
Both NMR and MD simulation methods were utilized to obtain complimentary information about the molecular micelle systems. NMR techniques, especially the NOESY methods utilized here, are able to probe interactions between nuclei that are within approximately 5 Å [32]. However, in the macromolecular poly(SULV) and poly (SUVL) spectra some of the NMR resonances are broad and overlapping and NMR analyses alone cannot be used to extract definitive MM structures. MD simulation analyses in contrast provide unambiguous atomic scale information about the structures of the MM. Combining both experimental and computational methods, therefore, provided a clearer picture of MM structure than could be obtained by either method alone. In addition, since to our knowledge this is the first application of MD simulation methods to the study of dipeptide terminated MM, the results from the NOESY spectra also provided important experimental validation of the MD simulation structures.
2. Experimental Details
2.1. Materials
Poly-( sodium undecyl-(L, L)-leucine-valine ) and (polySULV) and poly-(sodium undecyl-(L, L)-valine-leucine) (poly-SUVL)] were synthesized by the method of Wang and Warner [2]. Deuterium oxide (99.9 at % D), boric acid (ACS reagent grade), and (R) and (S)-1,1’bi-2-naphthol (BOH) were purchased from the Sigma-Aldrich, Inc. and used as received.
The MM solutions for the NMR analyses were prepared gravimetrically in a 0.100 M boric acid buffer solution at pH 10.0. The solvent was either D2O or a 90% H2O-10% D2O mixture. The pH of the solutions was adjusted by adding small aliquots of NaOD. Solutions were sonicated and allowed to equilibrate for at least an hour before NMR experiments were performed. The MM equivalent monomer concentration of each sample was 25.0 mM. In the NMR diffusion experiments with (R) or (S)-BOH, the analyte concentration was 2.00 mM.
2.2. NMR Experiments
NMR experiments were performed on a Bruker DPX 300 MHz spectrometer with a 5 mm quad (1H, 13C, 19F, 31P) probe and a shielded z-gradient coil. All spectra were collected at 298 K. The NOESY spectra of poly(SULV) and poly(SUVL) were collected in phase sensitive mode. The mixing time was 400 ms and the WATERGATE method was used to remove the solvent signal but retain the resonances from the NH protons in the 90% H2O- 10% D2O solutions [35]. Each two-dimensional spectrum contained 256 increments and 2 k data points in the f1 and f2 dimensions, respectively. After acquisition, the data sets were zero filled to a 1 K × 2 K matrix, apodized with a π/2-shifted sine-bell-squared function and then Fourier transformed and baseline corrected in both dimensions. The NH region of the poly(SULV) NOESY spectrum is shown in Figure 2.
NMR diffusion measurements were performed with mixtures containing either (R) or (S)-BOH and poly (SUVL). The other diffusion coefficients and association constants reported are from the literature. The spectrometer’s probe was found to produce a gradient of 50.3 G·cm–1 at 100% gradient strength by carrying out a pulsed gradient diffusion experiment with a β-cyclodextrin sample in D2O. The known D value for β-cyclodextrin was used to calculate the coil constant [36]. The Bipolar Pulse Pair Longitude Encode-Decode (BPPLED) pulse sequence was used in the diffusion coefficient experiments [37]. Each measurement was done by collecting
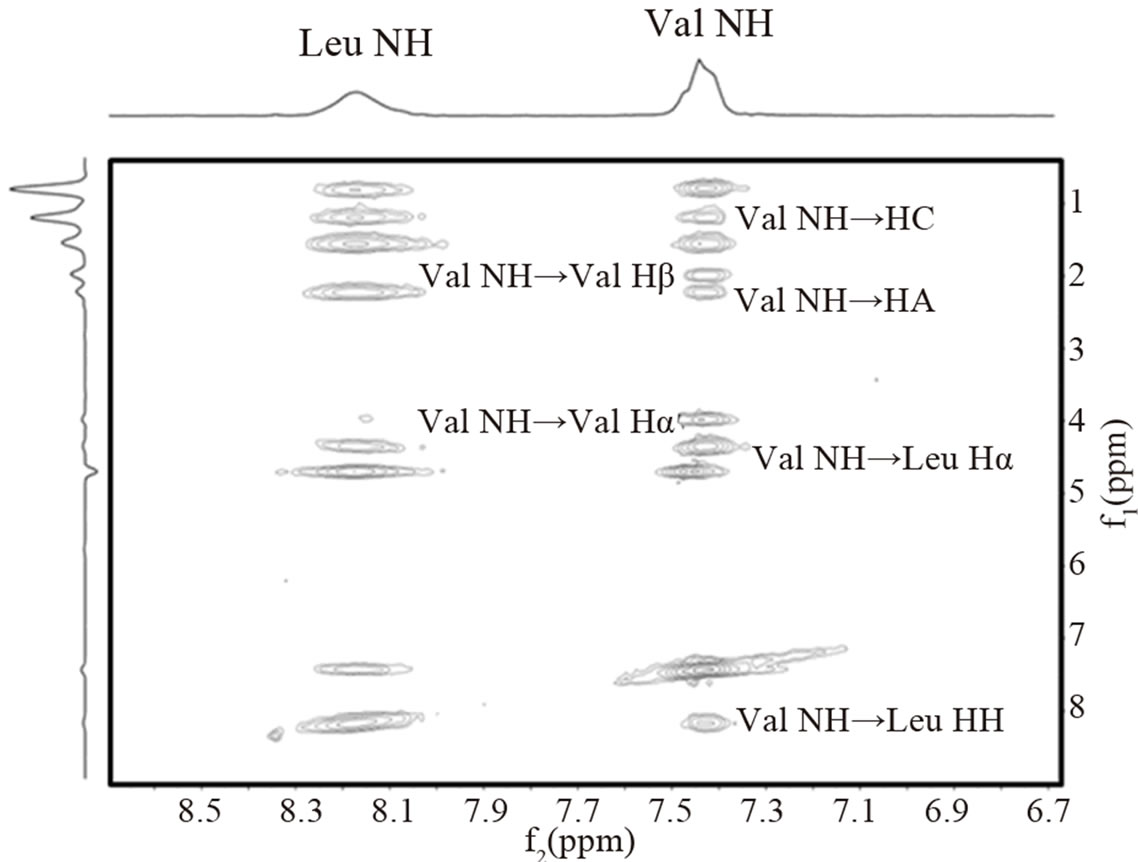
Figure 2. NH region of the poly(SULV) NOESY spectrum.
18 spectra with gradient amplitudes ranging from 5.2 to 35.2 G·cm–1. Three replicate trials were performed in each measurement. FID’s contained 16 k data points and had a spectral width of 6172.8 Hz.
In the BPPLED experiment the intensity, I, of each resonance in the spectrum changes with increasing gradient amplitude, G, according to Equation (1) [37].
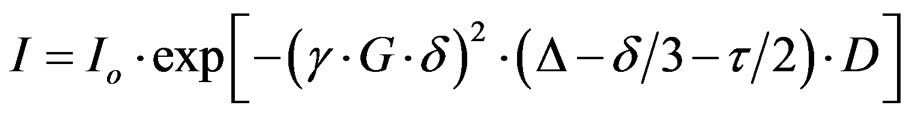 (1)
(1)
Io is the resonance intensity at zero gradient amplitude, γ is the magnetogyric ratio, δ and Δ are respectively the duration of the gradient pulse and the diffusion time, τ is a delay between the bipolar gradient pulses, and D is the diffusion coefficient. The values of δ, Δ, and τ were 4.0, 250, and 0.2 ms, respectively. The echo storage delay at the end of the pulse sequence was 10.0 ms.
Each free induction decay collected in the diffusion experiments was apodized with 1.0 Hz line broadening, Fourier transformed, phased, and baseline corrected. The BOH aromatic and polymer hydrocarbon chain resonances were integrated and the natural log of the integrals was plotted versus the quantity
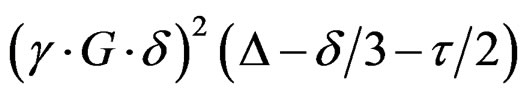
resulting in a line with slope –D. Linear regression analyses were performed to determine the diffusion coefficient. R2 values for the regression analyses exceeded 0.99. A representative NMR diffusion plot for a mixture containing (R)-BOH and poly(SUVL) is shown in Figure 3.
In the BOH:MM mixtures, it was assumed that the BOH molecules experience fast exchange between the bound (Db) and free (Dfree) states and that when bound to the polymer, the BOH and MM have the same diffusion coefficient. Under this fast exchange approximation, the BOH diffusion coefficient in the presence of the MM
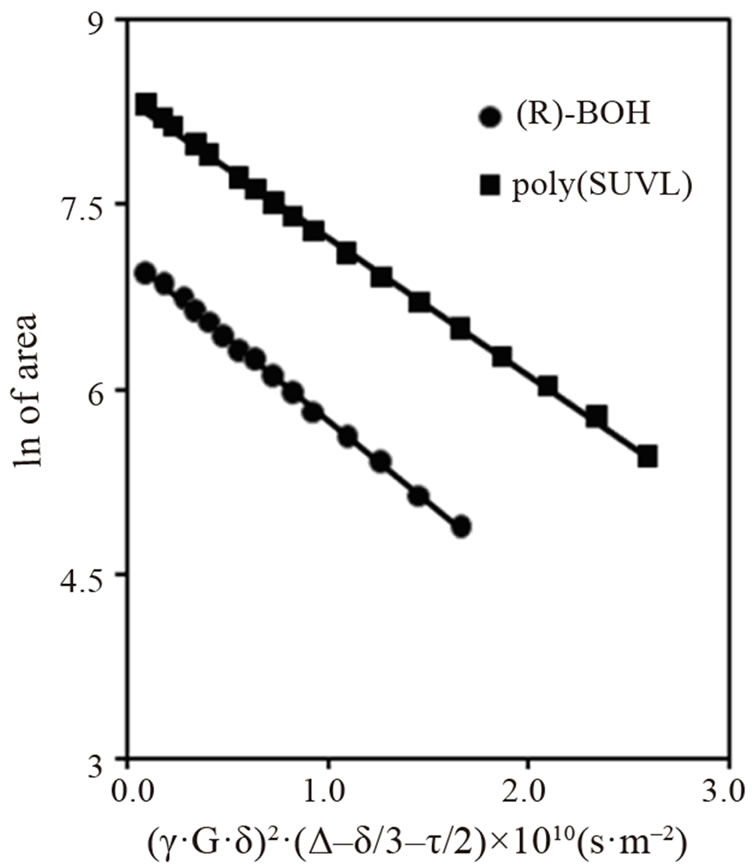
Figure 3. ln of peak area versus (γ·G·δ)·(Δ-δ/3-τ/2) diffusion plot for (R)-BOH: poly(SUVL) mixture.
(Dobs) is given by Equation (2):
 (2)
(2)
where fb is the mole fraction of bound BOH molecules [38]. Dfree was taken as the free solution analyte diffusion coefficient ((5.40 ± 0.05) ´ 10–10 m2·s–1) and Db was the diffusion coefficient of the MM [32]. Therefore, measurements of Dobs and Db in experiments with the BOH: poly(SUVL) mixture along with the literature Dfree value allowed fb to be calculated via Equation (2). Once fb was established, the BOH: MM association constant, K, was calculated with Equation (3):
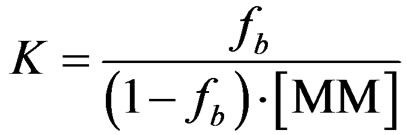 (3)
(3)
[MM] is the equivalent monomer concentration of the molecular micelles [32].
2.3. Computational Methods
The MM systems poly(SULV) and poly(SUVL) were selected for the MD simulations. Since the connectivity of the monomers in the MM has not been fully characterized, in the MD simulations we limited ourselves to the “simplest” way to make the covalent linkages. In this model, the monomers of both SULV and SUVL were connected by covalent bonds at the end of each monomer’s hydrocarbon chain in an end-to-end fashion, making each initial structure resemble an extended, linear polymer. The average aggregation number for these dipeptide surfactants has been reported as ~18 - 23 at room temperature, so in the MD simulation experiments, both poly(SULV) and poly(SUVL) were built with 20 monomer units per MM [30]. Next 20 sodium conterions were added near each carboxylate group. The TIP3P water model was used in MD simulations with both molecular micelles. The poly(SULV) and poly(SUVL) MD simulations contained 8360 and 8689 water residues, respectively providing a 10 Å buffer region between the edge of micelle and the edge of the periodic box.
MD simulations were performed using AMBER 10 [39] and the parm 99 [40] force field. In the calculations, a truncated octahedral periodic boundary condition was used. Non-bonded cutoffs were fixed at 12.0 Å and the long-range electrostatic interactions were calculated by the Particle Mesh Ewarld technique [41]. During the MD simulations, the SHAKE algorithm was utilized to constrain the bonds lengths containing the hydrogen atoms. Both systems were optimized before MD simulations were carried out. Then 20 ps MD simulations were done to heat the systems from 0 K to 300 K with weak restraints on the position of the micelle. Later 1 ns MD simulations were performed to allow the system to reach equilibration (P = 1 atm, T = 300 K). Finally, a 10.0 ns production run was used to collect the statistical data, resulting in a total simulation time of 11.0 ns. The time step was 2 fs and the structures were saved every 0.2 ps. MD simulation results were analyzed using the PTRAJ utility in AMBER 10 [39].
3. Results and Discussion
Two representative structures from the MD simulations of poly(SULV) and poly(SUVL) are shown in Figures 4(a) and (b), respectively. These were chosen by first calculating the average structure over all the structures collected during the MD simulations. The Root Mean Squared Deviation (RMSD) of each MD simulation structure with respect to the average was then calculated. Representative structures were selected as those with the lowest RMSD with respect to the average.
The two representative structures in Figures 4(a) and (b) suggest that both MM adopt a slightly elongated or oval shape. Figures 4(c) and (d) show surfactant chains extracted from the center of the respective poly(SULV) and poly(SUVL) micelles. These representative chains illustrate differences between the two MM structures. For example, as shown in Figure 4(d), most of the dipeptide headgroups in poly(SUVL) are rotated toward the core of the micelle, leading to a relatively closed, compact micelle structure. However in poly(SULV), significantly more of the dipeptide headgroups are rotated away from the core giving the MM an overall more open shape (see Figure 4(c)). As mentioned above, a model of the poly (SULV) headgroup structure has been developed based upon EKC and NMR results [9,31]. In this model, the dipeptide headgroups were hypothesized to adopt a conformation with the two R-groups rotated in opposite directions. The conformation shown in Figure 4(c) has the R-groups oriented in this fashion and is thus consistent
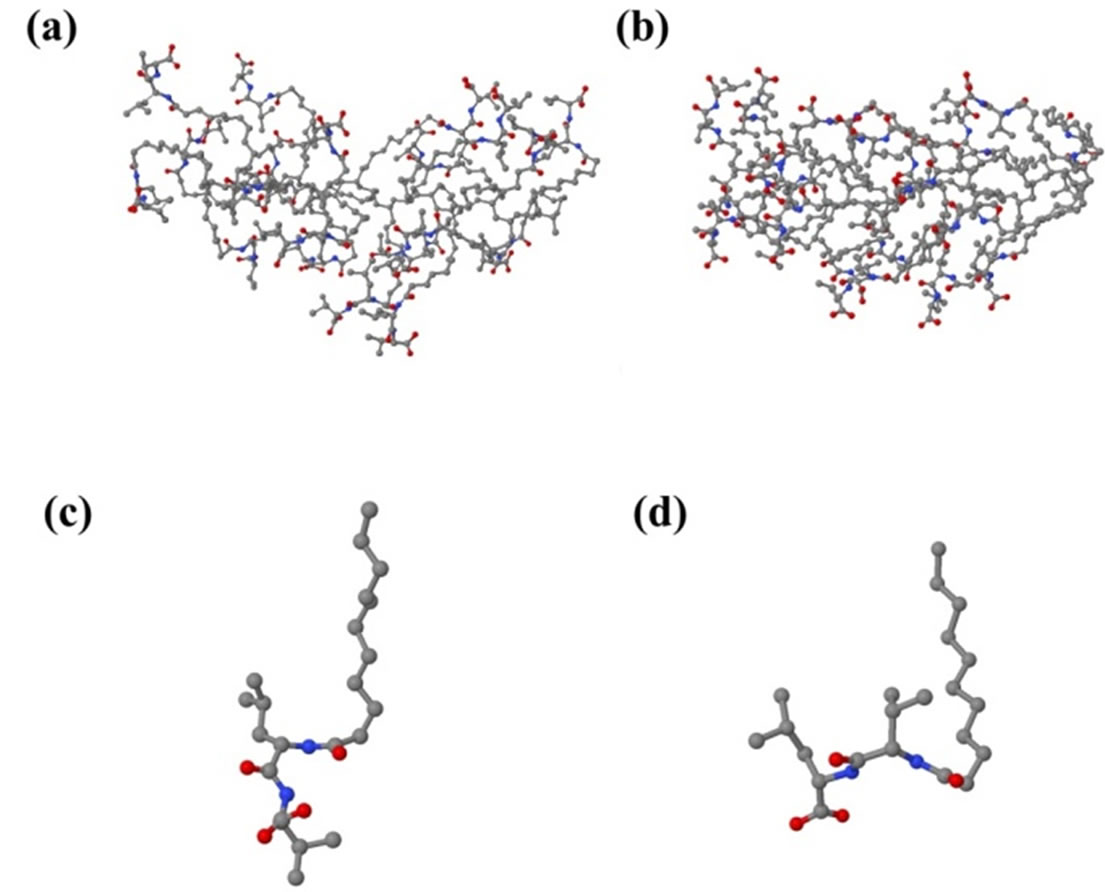
Figure 4. Representative MD simulation structures for (a) poly(SULV) and (b) poly(SUVL). Representative chains from the center of the (c) poly(SULV) and (d) poly(SUVL) molecular micelles.
with the proposed model. In order to further assess the validity of these structures, MD simulation results were compared to experimental NOESY and diffusion coefficient analyses from NMR spectroscopy.
3.1. NOESY Spectra and Radial Distribution Functions
Figures 1(a) and (b) show the structures of poly(SULV) and poly(SUVL) and denote proton labels for the hydrocarbon chain protons (HA, HB, and HC) used in the NOESY analyses. In NOESY spectra, cross peaks are detected between resonances corresponding to protons that are within approximately 5 Å [42]. Table 1 presents the NOESY cross peaks observed in spectra of both molecular micelles. The NH region of the poly(SULV) NOESY spectrum is shown in Figure 2. All NOESY cross peaks were negative, as expected for the macromolecules investigated here. Negative NOESY cross peaks were also previously reported in an NMR study of analyte binding to poly(SULV) [32]. Only MM intramolecular NOESY interactions are presented in Table 1 because the goal of the analyses was to validate the MD simulations. NOESY investigations of intermolecular MM: chiral analyte association have been reported previously [32-34].
The NOESY spectrum in Figure 2 shows Val NH and Leu NH diagonal resonances with chemical shifts of, respectively, 7.43 ppm and 8.16 ppm in both dimensions. The cross peaks to the Val NH resonance are assigned on the spectrum. For example, resonances at (7.43 ppm, 8.16 ppm), (7.43 ppm, 4.36 ppm), and (7.43 ppm, 3.98 ppm) are assigned as NOE interactions between the ValNH and the Leu NH, Leu Hα, and Val Hα protons, respectively. The remaining peaks in the NOESY spec-
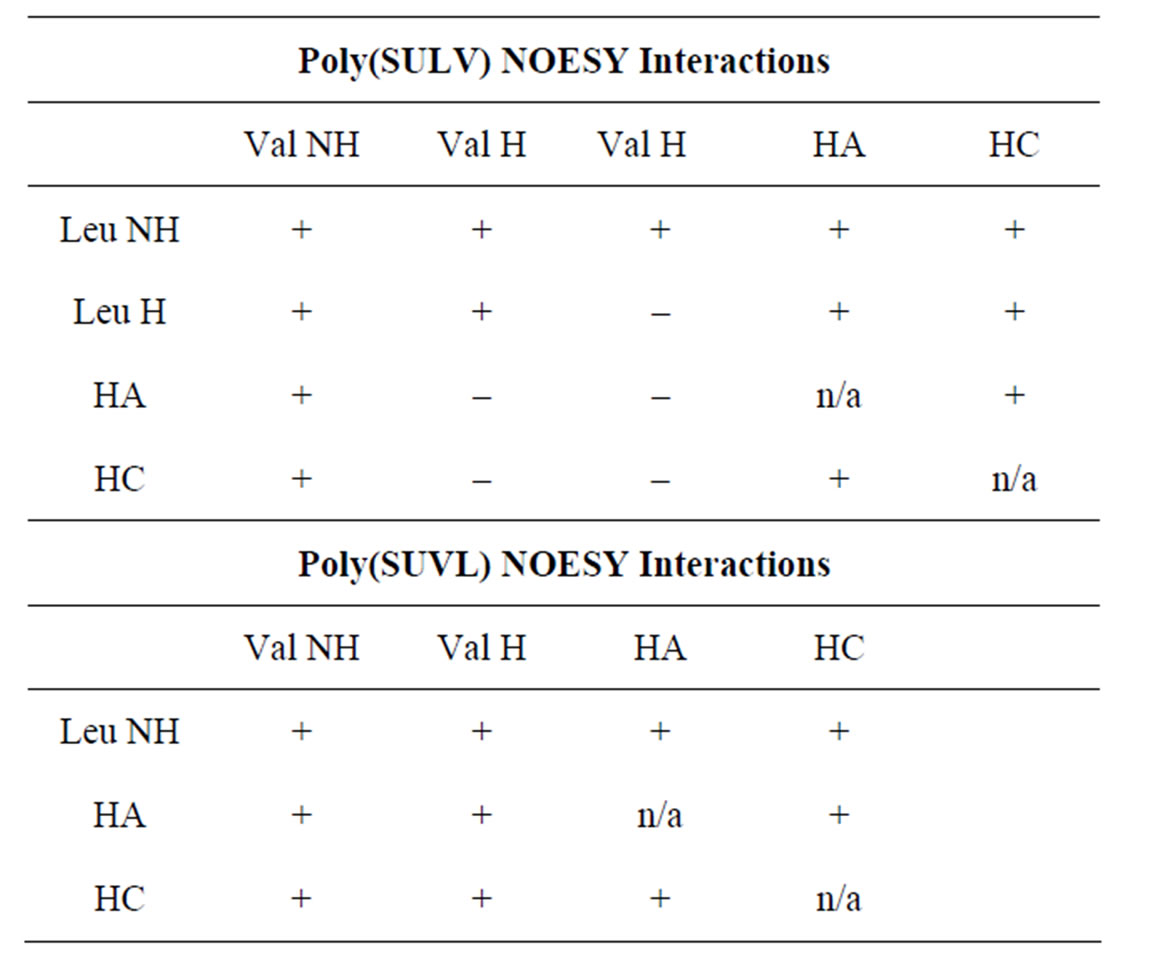
Table 1. NOE interactions observed for poly(SULV) and poly(SUVL). A (+) denotes the presence of and NOE cross peak and a (–) denotes the absence of an NOE interaction.
trum were assigned in this manner and used to generate the results reported in Table 1.
In Table 1, a (+) denotes the presence of an NOESY cross peak and a (–) indicates the absence of an NOE interaction. Therefore, based upon the Table 1 data it can be concluded that the leucine NH and valine NH protons in poly(SULV) are within 5 Å of one another because a cross peak is detected between these proton resonances in the NOESY spectrum (note the (+) designation in Table 1). No NOESY cross peak, though is detected between the poly(SULV) valine Hα and hydrocarbon chain HA protons, therefore the separation of these protons would be expected to be greater than the approximately 5 Å cut off for NOESY interactions.
Table 1 does not show results for all possible headgroup and hydrocarbon chain interactions because a number of the MM proton resonances overlap. For example, in NOESY spectra of both MM, the leucine Hα and Hα and hydrocarbon chain HB proton resonances overlap at ~1.5 ppm. Therefore, NOE cross peaks to this resonance in the spectrum could not be unambiguously assigned and are not reported. Likewise, the leucine Hα and valine Hα resonances overlap at ~0.8 ppm, so cross peaks to this chemical shift could not be definitively assigned to the either the leucine or valine methyl groups. Finally, in the poly(SULV) spectrum, the leucine and valine Hα protons are well resolved with chemical shifts of 4.36 and 3.98 ppm, respectively. In the poly(SUVL) spectrum though, the valine and leucine Hα resonances overlap in the 4.1 ppm region of the spectrum. Therefore, NOE interactions with the headgroup Hα protons are not reported because they could not be unambiguously assigned to either the valine or leucine amino acid.
Radial distribution functions (RFD’s) from the MD simulations for each of the proton-proton interactions in Table 1 were generated to make comparisons between the experimental NMR and computational results. Each RDF was generated by monitoring distances throughout the MD simulations between specified protons on the same and four adjacent surfactant monomer chains. Figure 5 shows four representative RDF’s for poly(SULV). The appearances of the remaining RDF’s generated from the MD simulations along with distances corresponding to the RDF maxima are summarized in Table 2. Overall, the RDF results show good agreement between the MD simulation results and the NOESY spectrum. For example, an NOE interaction was detected between the leucine and valine Hα atoms. The RDF for these two protons shown in Figure 5(a) is relatively sharp and shows an internuclear separation in 4 and 5 Å range. An NOE interaction was also observed between the leucine Hα and the hydrocarbon chain HA protons. The RDF in Figure 5(b) is consistent with the NOESY results, with the internuclear separation between these atoms again falling
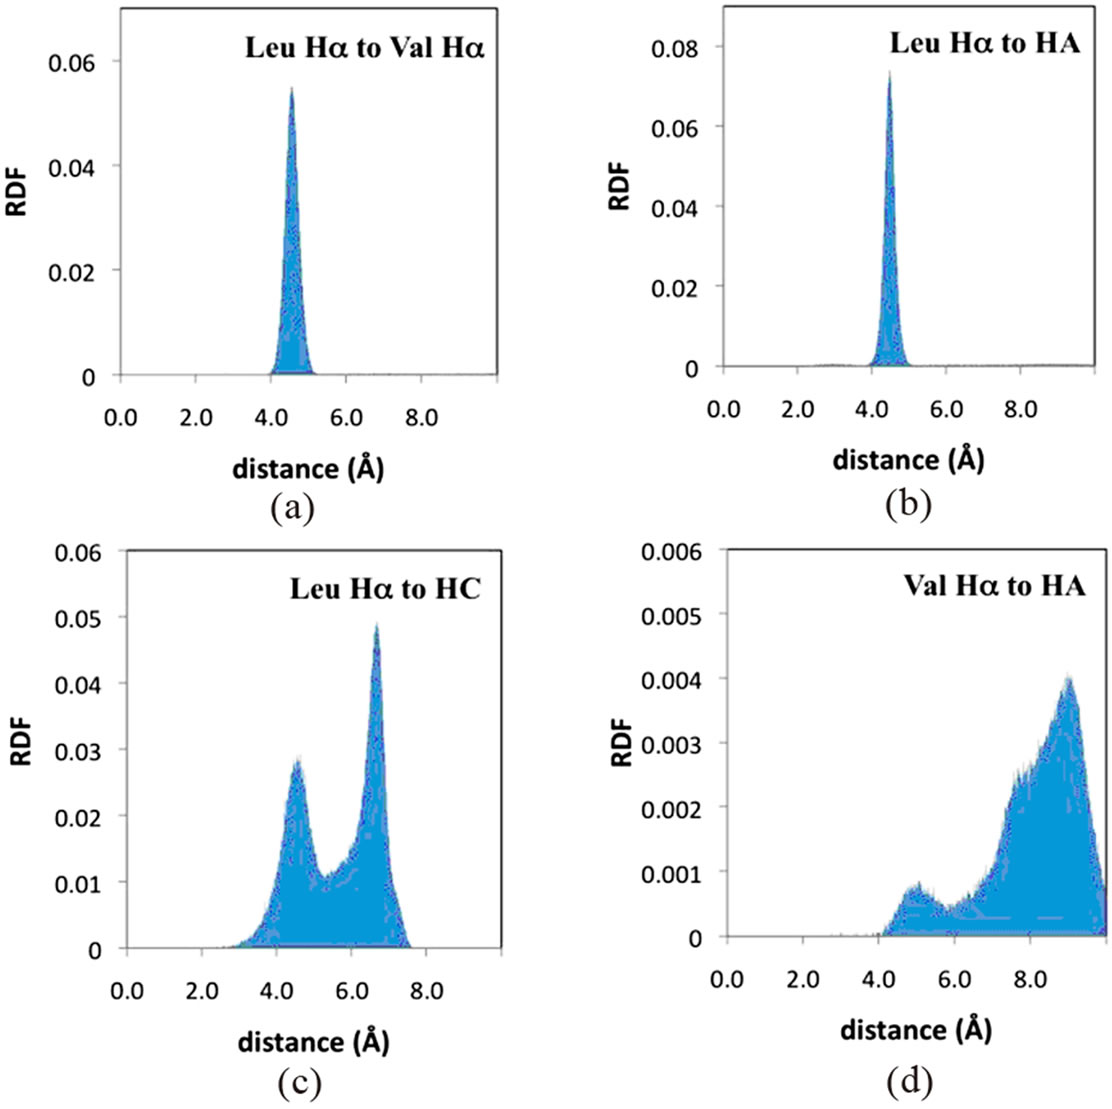
Figure 5. Poly(SULV) radial distribution functions from MD simulations for the (a) leucine Hα and valine Hα, (b) leucine Hα and HA, (c) leucine Hα and HC, and (d) valine Hα and HA atoms. See Figure 1 for hydrocarbon chain proton designations.
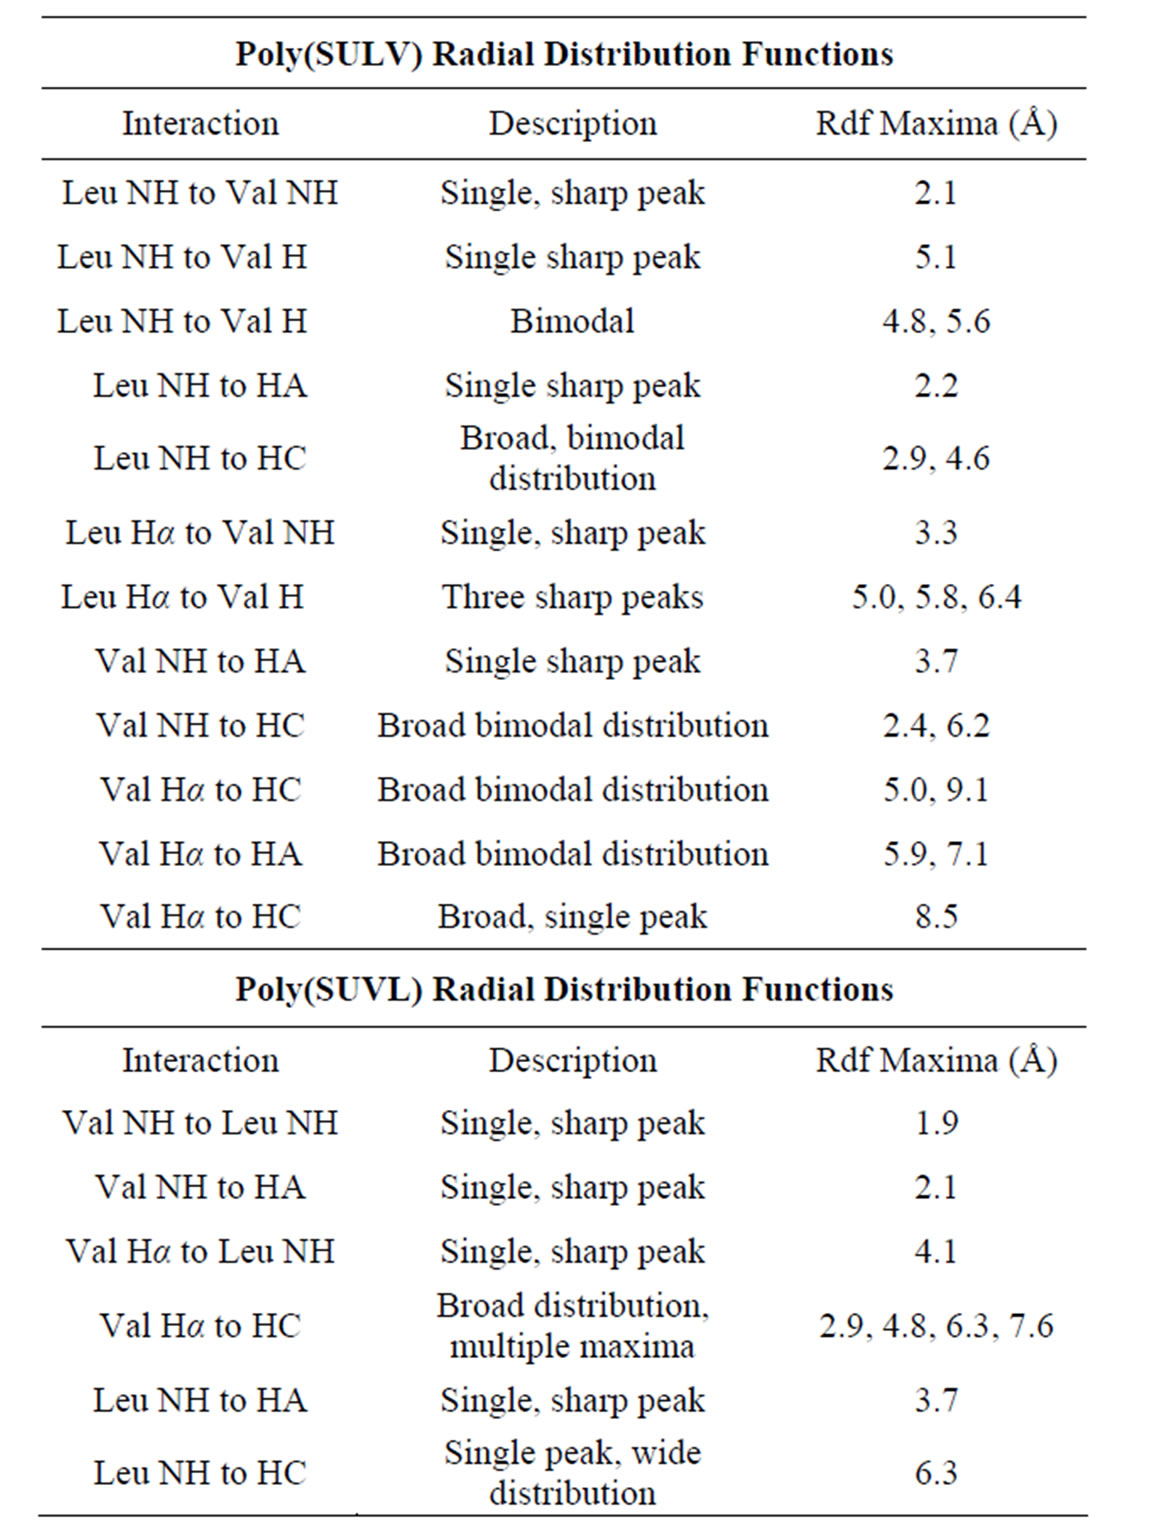
Table 2. Summary of radial distribution functions for poly (SULV) and poly(SUVL).
between 4 Å and 5 Å. Finally, the leucine Hα resonance of poly(SULV) showed a NOESY cross peak to the hydrocarbon chain protons HC. The RDF for these protons (Figure 5(c)) has a bimodal shape with peaks centered around 4.5 Å and 6.5 Å. The 4.5 Å peak suggests that during the MD simulation the leucine Hα and HC protons spend sufficient time close to one another to exhibit NOE activity. The bimodal shape of this RDF is discussed in more detail below.
Furthermore, in cases where no poly(SULV) NOESY cross peak was observed, the RDF’s show relatively large internuclear separations. For example, no NOESY interaction was observed between the valine Hα proton and either the HA or HC atoms of the hydrocarbon chain. The RDF’s in Figure 5(d) (HA) and Table 2 (HC) show that during the MD simulation the distances between the valine Hα and hydrocarbon chain protons exceeded the 5 Å separation required for NOESY interaction. Overall, the MD simulation results predicted relatively short internuclear separations when NOE activity was observed and much longer separations for cases where no NOE interaction was detected.
Table 1 also reports the NOESY cross peaks observed in the poly(SUVL) spectrum. Because of the spectral overlap discussed above, fewer interactions are reported for this MM. Figure 6(a) shows the RDF between the valine NH proton and the hydrocarbon chain proton HC. As in the poly(SULV) leucine Hα:HC RDF, a bimodal distribution is observed. In Figure 6(a), both peaks in the RDF lie within the distance range expected for NOE activity. Figure 6(b) shows the RDF between the VHα and HA protons. An NOE interaction was observed between these two atoms and again the larger peak in the RDF is in the 4 - 5 Å distance range. The relatively short distance between the valine Hα and hydrocarbon chain protons suggests that a significant number of the poly(SUVL) chains adopt a conformation with the valine R group pointed toward the hydrocarbon chain. The representative structure in Figure 4(d) shows a poly(SUVL) chain in this orientation.
The RDF’s for the leucine Hα and HC atoms in poly (SULV) and valine Hα and HC atoms in poly(SUVL) are shown in Figures 5(c) and 6(c), respectively. Note that each RDF has a bimodal shape. It was initially thought that the two maxima centered at approximately four and eight Angstroms represented intrachain and interchain interactions. However, the same bimodal pattern was observed when the RDF analyses are performed for the corresponding atoms on the same hydrocarbon chain (data not shown). Therefore, it seems more likely that the two peaks in the Hα to HC RDF’s represent different headgroup conformations that place the Hα atom close to or farther from the hydrocarbon chain. The poly(SULV) structure in Figure 4(c) with the more open wing-like headgroup conformation places the leucine Hα proton in relatively close proximity to the hydrocarbon chain. However, the folded headgroup conformation that predominates for poly(SUVL) (see Figure 4(d)) has the valine R-group pointing toward the hydrocarbon chain and the Hα proton pointing away. Therefore, the RDF plots for the Hα:HC distances likely report the relative number of open wing-like and folded surfactant headgroup conformations. Also note that the 4 Å peak in the bimodal distribution, which is attributed to the wing-like headgroup conformation, is larger in the poly(SULV) RDF than in the poly(SUVL) plot. This result suggests that in poly(SULV) a larger number of surfactant chains that adopt this conformation.
This RDF analysis also provides possible clues as to why poly(SULV) is generally a better chiral selector than poly(SUVL). Interactions of chiral analytes with MM likely involve a combination of non-stereoselective and chiral interactions. The later requires that the solvent and chiral compounds have access to the MM chiral centers. The folded surfactant chain conformations detected in poly(SUVL), however, limit analyte access to the chiral centers on the dipeptide headgroup. Thus solvent and chiral compounds in EKC have less opportunity to interact with the region of the MM containing the chiral centers, thereby reducing the number of possible chiral interactions. In contrast, the larger number of more open headgroup conformations observed for the poly(SULV) chains allows solvent and chiral analytes better access to the chiral centers on the dipeptide headgroup [9]. Water shell results presented below in fact show that poly
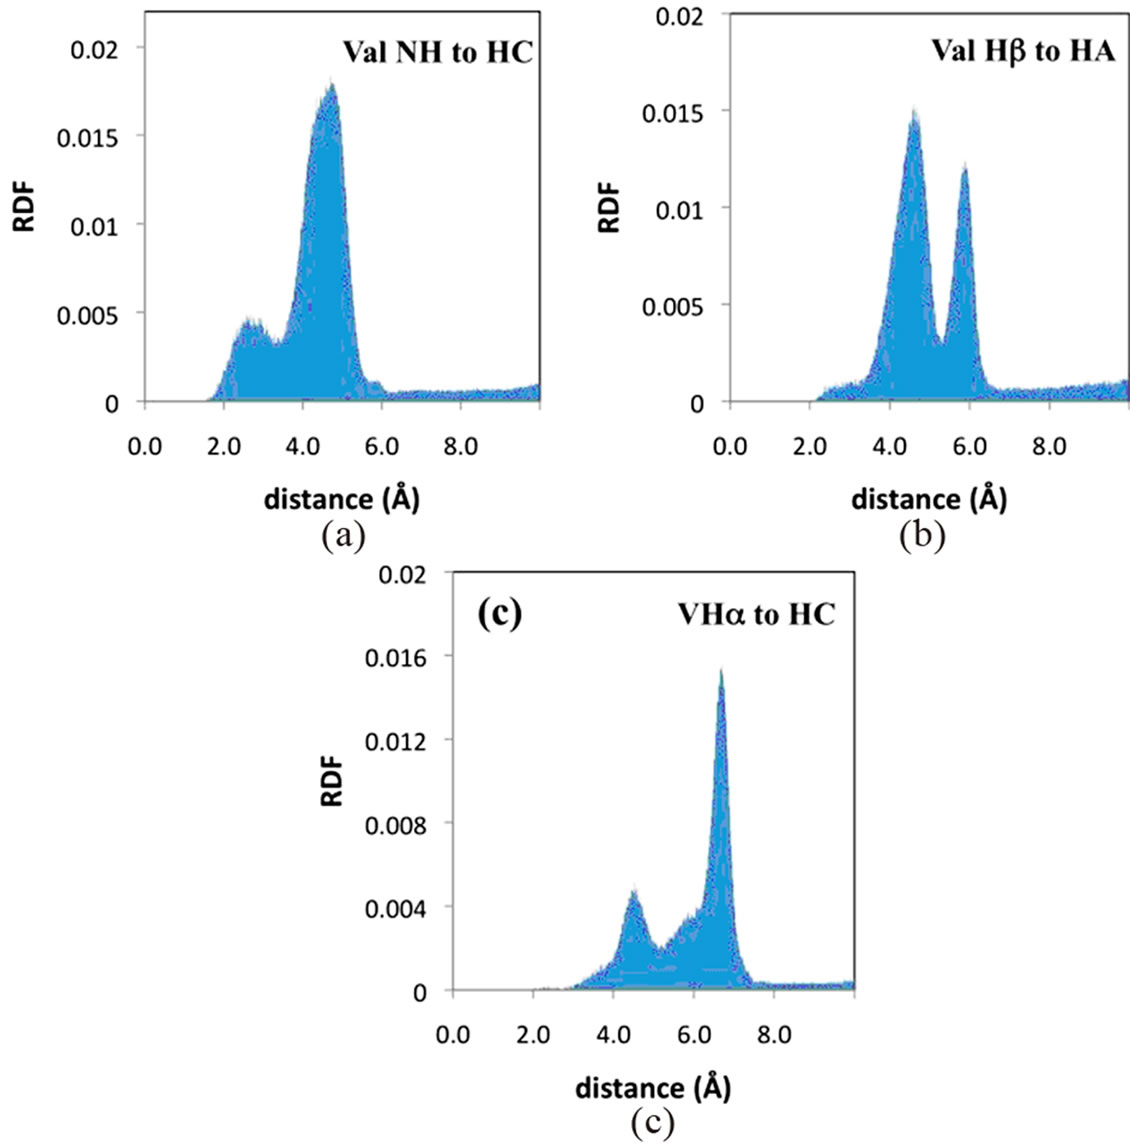
Figure 6. Poly(SUVL) radial distribution functions from MD simulations for the (a) valine NH and HC; (b) valine Hα and HA; and (c) valine Hα and HC atoms.
(SULV) has more water molecules than poly(SUVL) in the MM headgroup region. Characterization of the specific intermolecular interactions that lead to chiral recognition and chiral selectivity in EKC, though, will require that MD simulations be performed on chiral analyte: MM complexes. This work is currently underway and will be presented in a subsequent report.
3.2. Molecular Micelle Size
Along with comparisons of RDF’s and NOESY spectra, the overall size or radius of the MM predicted by the MD simulations was compared to hydrodynamic radii from NMR diffusion experiments. Diffusion coefficients of (1.08 ± 0.01) × 10–10 and (1.14 ± 0.01) × 10–10 m2·s–1 have been previously reported for poly(SULV) and poly (SUVL), respectively [34]. Substitution of these diffusion coefficients into the Stokes-Einstein equation yielded a hydrodynamic radius, Rh of 18.4 Å for poly(SULV) and an Rh value of 17.2 Å for poly(SUVL). These hydrodynamic radii correspond to the radius of a sphere with the same diffusion coefficient as the MM [43]. A D2O viscosity of 1.100 mPa·s at 25.0˚C was used in these calculations [44]. The relatively small difference in Rh values for poly(SULV) and poly(SUVL) may be within the experimental error of the method employed, given that D values depend on solution viscosity and obstruction effects [45]. The radii of ~17 - 18 Å calculated for poly (SULV) and poly(SUVL), though, do provide an experimental estimate of micelle size that can be compared to the values predicted by the MD simulations.
The following procedure was used to extract average MM radii from the MD simulations. Here the goal was to calculate a single effective spherical radius from the MD simulations that would represent the dimensions of the more ellipsoid-shaped MM and that could in turn be compared to the hydrodynamic radii from NMR. The method utilized is depicted in Figure 7. The dotted line represents the shape of the MM and the solid line represents the effective spherical radius. The first step of the analysis was to use representative structures for both MM to locate the atom nearest the center of mass of each structure. These atoms were found to be the terminal hydrocarbon chain carbons on chains 10 and 13 for poly (SULV) and poly(SUVL), respectively. The average distance from this carbon atom to each of the twenty carboxylate oxygens was then measured over all of the structures collected during the MD simulations. These distances are depicted by the arrows in Figure 7. The resulting distances for the twenty surfactant chains of each MM were then averaged. This analysis resulted in an average radius of 18.0 Å for poly(SULV) and 17.3 Å for poly(SUVL), which agree well with the hydrodynamic radii from NMR diffusion measurements.
3.3. Water Distribution and Analyte Binding
NMR diffusion experiments have also been used to investigate the binding of the chiral binaphthyl compounds BOH and 1,1’-binaphthyl-2,2’-diyl hydrogen phosphate (BNP) to poly(SULV) and poly(SUVL) [31-34]. The chemical structures of these compounds are shown in Figures 1(c) and (d), respectively. In the NMR binding measurements, the diffusion coefficient of the chiral analyte in the presence of the MM, Dobs, is assumed to be a weighted average of the micelle bound, Db, and free solution values (Dfree). NMR diffusion measurements of Dobs and Db in an analyte:MM mixture and of Dfree in the absence of the MM then allow the mole fraction of bound analyte, fb, and the analyte:MM association constant, K, to be calculated using Equations (2) and (3) [32]. Table 3 presents Dobs, Db, fb, and K values for BOH and BNP enantiomers interacting with both MM. The BOH: poly(SUVL) results are from this study and the remaining values are from the literature [32,34]. A BOH Dfree literature value of (5.40 ± 0.05) × 10–10 m2·s–1 was used to calculate the poly(SUVL) fb and K values from the diffusion coefficients listed in Table 3 [32].
Examination of the K values in Table 3 shows that overall BOH interacts more strongly than BNP with both MM. This result is not surprising because under the conditions of the measurements, BNP was an anion and would be expected to experience some electrostatic repulsion from the anionic MM headgroups. The association constants also show that both enantiomers of the less polar analyte BOH bind more strongly to poly(SUVL). For example, the (R)-BOH association constant is 590 ± 19 for poly(SUVL) and 425 ± 11 for poly(SULV). In contrast, association constants of 125 ± 3 and 73.8 ± 3.5 were obtained for (S)-BNP binding to poly(SULV) and poly(SUVL), respectively, showing that the more polar analyte interacts more strongly with poly(SULV). It should also be noted that NOESY studies of BOH and BNP association with both MM have shown cross peaks between resonances corresponding to the analyte and the MM hydrocarbon chain protons (HC). Interactions were
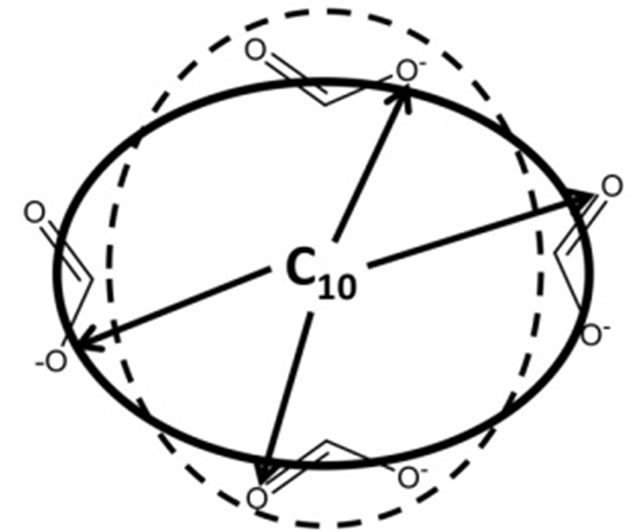
Figure 7. Calculation of the molecular radius from the MD simulations. The calculation for poly(SULV) is illustrated with the terminal hydrocarbon chain carbon of chain number 10 at the center of the MM.
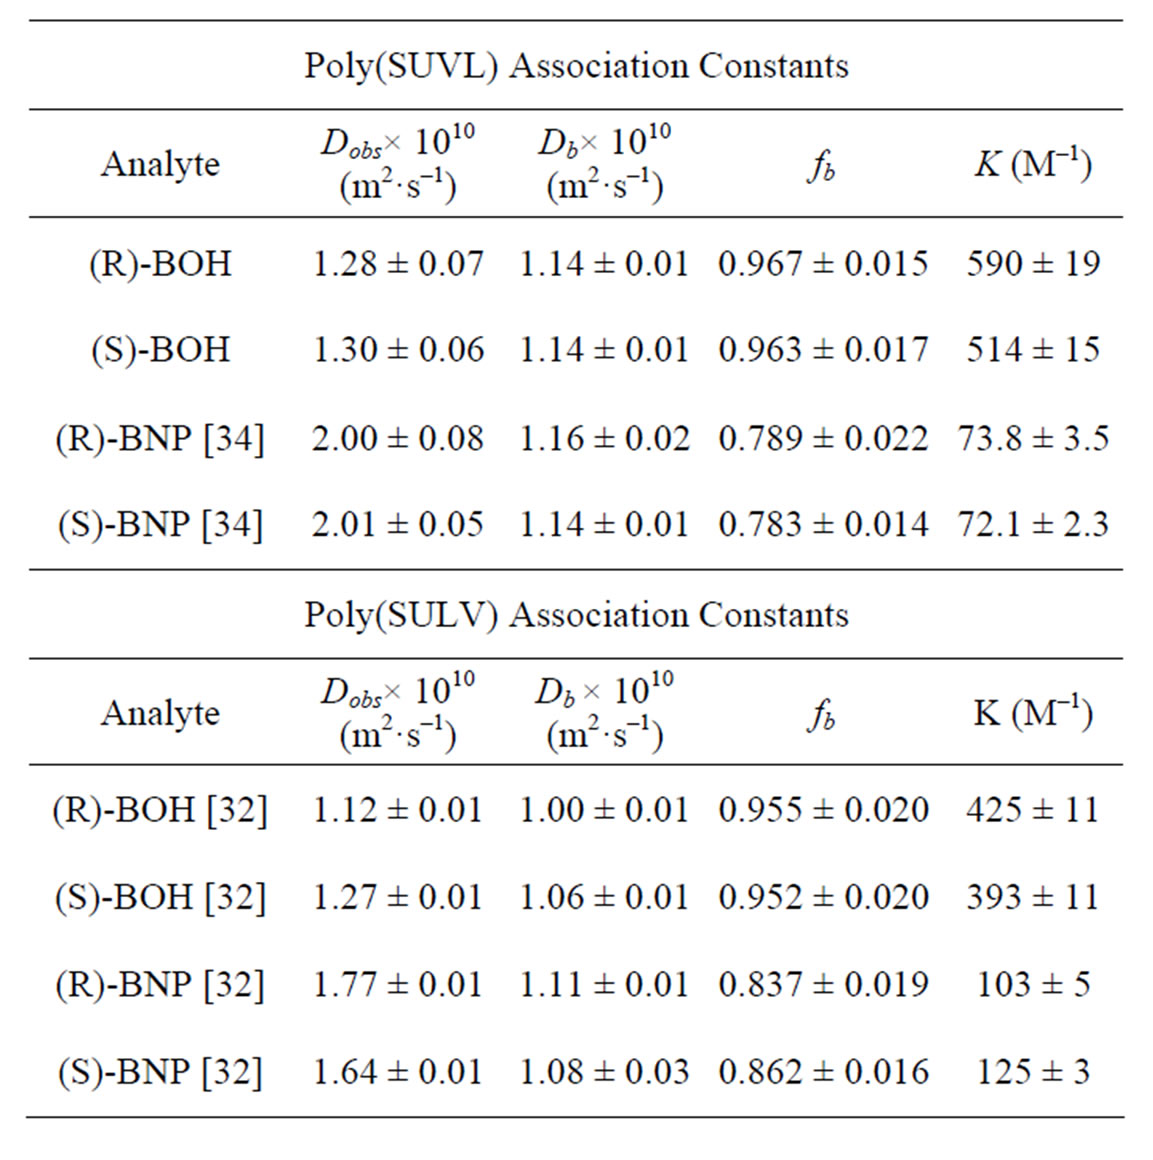
Table 3. Dobs, Db, fb, and K values for BOH and BNP binding to poly(SULV) and poly(SUVL). The BOH: poly(SULV) and BNP data are from the literature [32,34].
also observed between the analyte resonances and resonances from protons on the MM dipeptide headgroups [32-34]. These results suggest that both analytes interact in a stereoselective fashion with the MM headgroups and experience non-stereoselective hydrophobic interactions with the micelle core. In other words, when both BNP and BOH bind to the MM, they sample or spend time not only in the core but also in the headgroup regions.
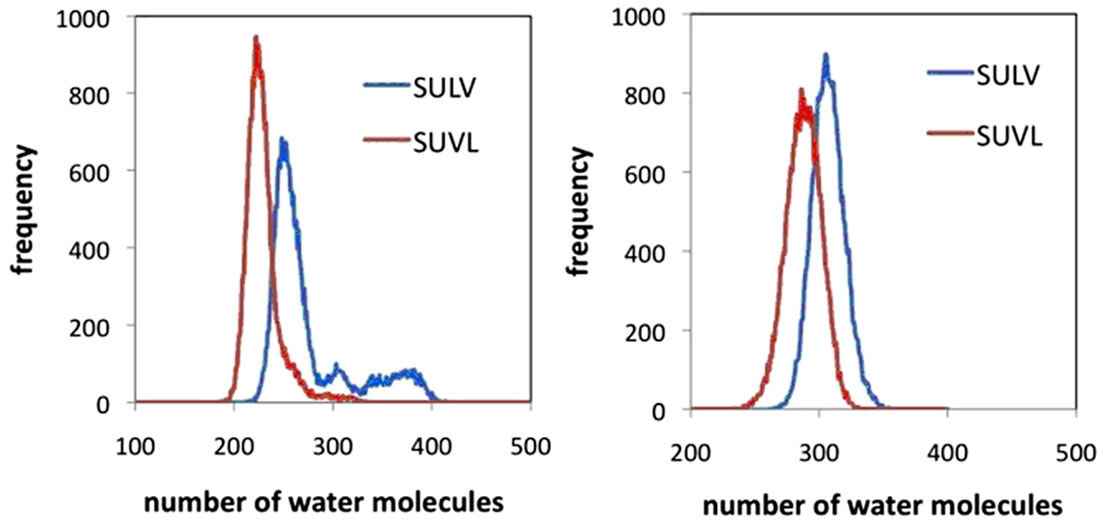
Results from the MD simulations were compared to these analyte binding results by examining the number of water molecules in each MM core and dipeptide headgroup region. The cores of both MM were assigned as the regions extending from the terminal carbon of each hydrocarbon chain to the carbonyl carbon separating the hydrocarbon chain from the dipeptide headgroup. RDF’s for these carbon atoms were generated and the average distance separating the two atoms averaged over the 20 monomer chains was found to be 9.5 Å. The number of water molecules in each hydrocarbon core was then quantified by calculating the number of waters in the region extending from each terminal hydrocarbon chain carbon atom outward 9.5 Å. A plot of the results for both MM is shown in Figure 8(a). Examination of the water distributions in the cores of the two MM shows that there are on average fewer water molecules found in the poly (SUVL) core and more water molecules found in the core of poly(SULV). This result is consistent with the analyte binding data presented above in that the poly(SUVL) core excludes water to a larger extent than poly(SULV) and at the same time has a greater binding affinity for the non-polar BOH molecule.
 (a) (b)
Figure 8. Distribution of water molecules in the hydrocarbon core and headgoup regions of (a) poly(SULV) and (b) poly(SUVL).
A similar comparison can be made of the number of water molecules in each MM headgroup region. This region for both MM was assumed to extend from the carbonyl carbon separating the headgroup and hydrocarbon chain to the C-terminal carboxylate of the dipeptide headgroup. RDF’s for the distance between these atoms were generated as above and the headgroup was estimated to extend 6.5 Å beyond the reference carbonyl atom. The number of water molecules in this 6.5 Å region was then calculated and the results are plotted in Figure 8(b). This analysis showed that there are more water molecules in the headgroup region of poly(SULV). The NMR binding data in turn show that the polar analyte BNP binds more strongly to poly(SULV) than to poly(SUVL). Therefore, the MD simulation results suggest that the structure and headgroup conformation of poly(SULV) give both polar water molecules and the polar analyte BNP greater access to the hydrophillic headgroup regions of the MM.
Taken together, the distribution of water molecules around both MM also gives clues as to why poly(SULV) is the better chiral selector. The same steric factors that cause poly(SUVL) to adopt a more compact structure that prevents H2O penetration into both the core and headgroup regions may also limit the access chiral compounds have to these regions. This would in turn result in fewer stereoselective interactions between analyte enantiomers and the MM chiral centers, thus reducing chiral selectivity. Poly(SULV) in contrast has a more open structure that gives greater access for both water molecules and chiral analytes to the dipeptide headgroup.
4. Conclusion
NMR spectroscopy and MD simulations were used to investigate the structures of two molecular micelles in aqueous solution. Radial distribution functions from the MD simulations were found be in good agreement with NMR NOESY spectra. The RDF’s in general showed short internuclear separations for protons connected by NOESY cross peaks and longer separations between protons for which no NOESY interaction was observed. Hydrodynamic radii of the two MM calculated from NMR-derived diffusion coefficients also corresponded well to radii measured in the MD simulations. Finally, NMR studies of the binding of BNP and BOH enantiomers to poly(SULV) and poly(SUVL) showed that BOH bound more strongly than BNP to both MM. However, the association constant for the non-polar BOH analyte with poly(SUVL) was larger than the corresponding poly(SULV) value. The more polar BNP molecule was found to associate more strongly with poly(SULV). The MD simulations in turn showed that poly(SULV) also had more water molecules in both the MM hydrocarbon core and dipeptide headgroup regions. Overall, given the relatively close correspondence between MD simulation and experimental NMR results, it can be concluded that meaningful MM properties can be extracted from the MD simulation.
5. Acknowledgements
This work was supported by grant # 8G12 MD007597 from NIMHD, NIH to the RCMI program at Howard University, an NSF CAREER grant to Dr. Eugene Billiot (No. 0449742), Howard University College of Medicine Bridge Funds and Pilot Study Awards program (BFPSAP) to Dr. Yayin Fang (No. U400040) and a Robert A. Welch Chemistry Departmental Grant to the Chemistry Program at Texas A & M University-Corpus Christi. We also acknowledge the Donors of the American Chemical Society Petroleum Research Fund (46707-B4) and the generosity of the Ralph E. Klingenmeyer family.
REFERENCES
- T. J. Ward and K. D. Ward, “Chiral Separations: Fundamental Review,” Analytical Chemistry, Vol. 82, No. 12, 2010, pp. 4712-4722.
- J. Wang and I. M. Warner, “Chiral Separations Using Micellar Electrokinetic Capillary Chromatography and a Polymerized Chiral Micelle,” Analytical Chemistry, Vol. 66, No. 21, 1994, pp. 3773-3776.
- J. Wang and I. M. Warner, “Combined Polymerized Chiral Micelle and γ-Cyclodextrin for Chiral Separation in Capillary Electrophoresis,” Journal of Chromatography: A, Vol. 711, No. 2, 1995, pp. 297-304.
- S. A. Shamsi and I. M. Warner, “Improved Chiral Separations Using a Polymerized Dipeptide Anionic Chiral Surfactant in Electrokinetic Chromatography: Separations of Basic, Acidic, and Neutral Racemates,” Analytical Chemistry, Vol. 69, No. 15, 1997, pp. 2980-2987.
- E. J. Billiot, K. Macossay, S. A. Shamsi and I. M. Warner, “Chiral Separations Using Dipeptide Polymerized Surfactants: Effect of Amino Acid Order,” Analytical Chemistry, Vol. 70, No. 7, 1998, pp. 1375-1381.
- E. J. Billiot, R. A. Agbaria, S. A. Shamsi and I. M. Warner, “Amino Acid Order in Polymeric Dipeptide Surfactants: Effect on Physical Properties and Enantioselectivity,” Analytical Chemistry, Vol. 71, No. 7, 1999, pp. 1252-1256.
- E. J. Billiot, S. Thibodeaux, S. A. Shamsi and I. M. Warner, “Evaluating Chiral Separation Interactions by Use of Diastereomeric Polymeric Dipeptide Surfactants,” Analytical Chemistry, Vol. 71, No. 18, 1999, pp. 4044-4049.
- H. H. Yarabe, S. A. Shamsi and I. M. Warner, “Characterization and Thermodynamic Studies of the Interactions of Two Chiral Polymeric Surfactants with Model Substances: Phenylthiohydantoin Amino Acids,” Analytical Chemistry, Vol. 71, No. 18, 1999, pp. 3992-3999.
- E. J. Billiot and I. M. Warner, “Examination of Structural Changes of Polymeric Amino Acid-Based Surfactants on Enantioselectivity: Effect of Amino Acid Order, Steric Factors, and Number and Position of Chiral Centers,” Analytical Chemistry, Vol. 72, No. 8, 2000, pp. 1740-1748.
- H. H. Yarabe, E. J. Billiot and I. M. Warner, “Enantiomeric Separations by use of Polymeric Surfactant Electrokinetic Chromatography,” Journal of Chromatography A, Vol. 875, No. 1, 2000, pp. 179-206.
- C. Akbay, N. L. Gill, R. A. Agbaria and I. M. Warner, “Copolymerized Polymeric Surfactants: Characterization and Application in Micellar Electrokinetic Chromatography,” Electrophoresis, Vol. 24, No. 24, 2003, pp. 4209- 4220.
- C. Akbay, R. A. Agbaria and I. M. Warner, “Monomeric and Polymeric Anionic Gemini Surfactants and Mixed Surfactant Systems in Micellar Electrokinetic Chromatography Part II: Characterization of Chemical Selectivity Using Two Linear Solvation Energy Relationship Models,” Electrophoresis, Vol. 26, No. 3, 2005, pp. 426-445.
- S. A. Rizvi and S. A. Shamsi, “Polymeric Alkenoxy Amino Acid Surfactants: IV: Effects of Hydrophobic Chain Length and Degree of Polymerization of Molecular Micelles on Chiral Separation of β-Blockers,” Electrophoresis, Vol. 26, No. 21, 2005, pp. 4172-4186.
- S. A. Rizvi and S. A. Shamsi, “Polymeric Alkenoxy Amino Acid Surfactants: V. Comparison of Carboxylate and Sulfate Head Group Polymeric Surfactants for Enantioseparation in MEKC,” Electrophoresis, Vol. 28, No. 11, 2007, pp. 1762-78.
- K. Otsuka and S. Terabe, “Enantiomer Separation of Drugs by Micellar Electrokinetic Chromatography using Chiral Surfactants,” Journal of Chromatography A, Vol. 875, No. 1-2, 2000, pp. 163-178.
- C. P. Palmer and S. Terabe, “Micelle Polymers as Pseudostationary Phases in MEKC: Chromatographic Performance and Chemical Selectivity,” Analytical Chemistry, Vol. 69, No. 10, 1997, pp. 1852-1860.
- S. A. Shamsi, B. C. Valle, F. H. Billiot and I. M. Warner, “Polysodium N-Undecanoyl-l-Leucylvalinate: A Versatile Chiral Selector for Micellar Electrokinetic Chromatography,” Analytical Chemistry, Vol. 75, No. 3, 2003, pp. 379- 387.
- A. D. MacKerell Jr., “Molecular Dynamics Simulation Analysis of a Sodium Dodecyl Sulfate Micelle in Aqueous Solution: Decreased Fluidity of the Micelle Hydrocarbon Interior,” Journal of Physical Chemistry, Vol. 99, No. 7, 1995, pp. 1846-1855.
- C. D. Bruce, M. L. Berkowitz, L. Perera and M. D. E. Forbes, “Molecular Dynamics Simulation of Sodium Dodecyl Sulfate Micelle in Water: Micellar Structural Characteristics and Counterion Distribution,” Journal of Physical Chemistry B, Vol. 106, No. 15, 2002, pp. 3788-3793.
- S. Bogusz, R. M. Venable and R.W. Pastor, “Molecular Dynamics Simulations of Octyl Glucoside Micelles: Structural Properties,” Journal of Physical Chemistry B, Vol. 104, No. 23, 2000, pp. 5462-5470.
- D. P. Tieleman, D. van der Spoel and H. J. C. Berendsen, “Molecular Dynamics Simulations of Dodecylphosphocholine Micelles at Three Different Aggregate Sizes: Micellar Structure and Chain Relaxation,” Journal of Physical Chemistry B, Vol. 104, No. 27, 2000, pp. 6380-6388.
- S. Bogusz, R. M. Venable and R. W. Pastor, “Molecular Dynamics Simulations of Octyl Glucoside Micelles: Dynamic Properties,” Journal of Physical Chemistry B, Vol. 105, No. 35, 2001, pp. 8312-8321.
- S. J. Marrink, D. P. Tieleman and A. E. Mark, “Molecular Dynamics Simulation of the Kinetics of Spontaneous Micelle Formation,” Journal of Physical Chemistry B, Vol. 104, No. 51, 2000, pp. 12165-12173.
- J. Gao, W. Ge, G. Hu and J. Li, “From Homogeneous Dispersion to Micelles A Molecular Dynamics Simulation on the Compromise of the Hydrophilic and Hydrophobic Effects of Sodium Dodecyl Sulfate in Aqueous Solution,” Langmuir, Vol. 21, No. 11, 2005, pp. 5223- 5229.
- T. Lazaridis, B. Mallik and Y. Chen, “Implicit Solvent Simulations of DPC Micelle Formation,” Journal of Physical Chemistry B, Vol. 109, No. 31, 2005, pp. 15098-15106.
- B. C. Stephenson, K. Beers and D. Blankschtein, “Complementary Use of Simulations and Molecular-Thermodynamic Theory to Model Micellization,” Langmuir, Vol. 22, No. 4, 2006, pp. 1500-1513.
- A. Cavallo, M. Müller and K. Binder, “Formation of Micelles in Homopolymer-Copolymer Mixtures: Quantitative Comparison between Simulations of Long Chains and Self-Consistent Field Calculations,” Macromolecules, Vol. 39, No. 26, 2006, pp. 9539-9550. doi:10.1021/ma061493g
- B. C. Stephenson, A. Goldsipe, K. J. Beers and D. Blankschtein, “Quantifying the Hydrophobic Effect. 2. A Computer Simulation-Molecular-Thermodynamic Model for the Micellization of Nonionic Surfactants in Aqueous Solution,” Journal of Physical Chemistry B, Vol. 111, No. 5, 2007, pp. 1045-1062.
- C. D. Bruce, S. Senapati, M. L. Berkowitz, L. Perera and M. D. E. Forbes, “Molecular Dynamics Simulations of Sodium Dodecyl Sulfate Micelle in Water: The Behavior of Water,” Journal of Physical Chemistry B, Vol. 106, No. 42, 2002, pp. 10902-10907.
- E. J. Billiot, “Chiral Recognition with Polymerized Dipeptide Surfactants in Capillary Electrophoresis,” Ph.D. Dissertation, Louisiana State University, Baton Rouge, 1998.
- J. K. Rugutt, E. J. Billiot and I. M. Warner, “NMR Study of the Interaction of Monomeric and Polymeric Chiral Surfactants with (R)- and (S)-1,1’-Binaphthyl-2,2’-Diyl Hydrogen Phosphate,” Langmuir, Vol. 16, No. 7, 2000, pp. 3022-3029.
- K. F. Morris, B. A. Becker, B. C. Valle, I. M. Warner and C. K. Larive, “Use of NMR Binding Interaction Mapping Techniques to Examine Interactions of Chiral Molecules with Molecular Micelles,” Journal of Physical Chemistry B, Vol. 110, No. 35, 2006, pp. 17359-17369. doi:10.1021/jp0627224
- B. C. Valle, K. F. Morris, K. A. Fletcher, V. Fernand, D. M. Sword, S. Eldridge, C. K. Larive and I. M. Warner, “Understanding Chiral Molecular Micellar Separations Using Steady-State Fluorescence Anisotropy, Capillary Electrophoresis, and NMR,” Langmuir, Vol. 23, No. 2, 2007, pp. 425-435. doi:10.1021/la0612623
- S. A. Kingsbury, C. J. Ducommun, B. M. Zahakaylo, E. H. Dickinson and K. F. Morris, “NMR Characterization of 1,1’-Binaphthyl-2,2’-Diyl Hydrogen Phosphate Binding to Chiral Molecular Micelles,” Magnetic Resonance in Chemistry, Vol. 48, No. 3, 2010, pp. 184-191.
- M. Piotto, V. Saudek and V. Skienar, “Gradient-Tailored Excitation for Single Quantum NMR Spectroscopy of Aqueous Solutions,” Journal of Biomolecular NMR, Vol. 2, No. 6, 1992, pp. 661-665.
- M. Lin, D. A. Jayawickrama, R. A. Rose, J. A. DelViscio and C.K. Larive, “Nuclear Magnetic Resonance Spectroscopic Analysis of the Selective Complexation of the Cis and Trans Isomers of Phenylalanylproline by β-Cyclodextrin,” Analytica Chimica Acta, Vol. 307, No. 3, 1995, pp. 449-457.
- D. H. Wu, A. D. Chen and C. S. Johnson. Jr. “An Improved Diffusion Ordered Spectroscopy Experiment Incorporating Bipolar Gradient Pulses,” Journal of Magnetic Resonance, Vol. A115, No. 2, 1995, pp. 260-264.
- P. Stilbs, “Fourier Transform Pulsed-Gradient Spin-Echo Studies of Molecular Diffusion,” Progress in NMR Spectrosopy, Vol. 19, No. 1, 1987, pp. 1-45.
- D. A. Case, T. A. Darden, T. E. Cheatham, C. L. Simmerling, J. Wang, R. E. Duke, R. Luo, M. Crowley, R. C. Walker, W. Zhang, K. M. Merz, B. Wang, S. Hayik, A. Roitberg, G. Seabra, I. Kolossváry, K. F.Wong, F. Paesani, J. Vanicek, X. Wu, S. R. Brozell, T. Steinbrecher, H. Gohlke, L. Yang, C. Tan, J. Mongan, V. Hornak, G. Cui, D. H. Mathews, M. G. Seetin, C. Sagui, V. Babin and P. A. Kollman, “AMBER 10,” University of California, San Francisco, 2008.
- J. Wang, P. Cieplak and P. A. Kollman, “How Well Does a Restrained Electrostatic Potential (RESP) Model Perform in Calculating Conformational Energies of Organic and Biological Molecules,” Journal of Computational Chemistry, Vol. 21, No. 12, 2000, pp. 1049-1074.
- U. Essmann, L. Perera, M. L. Berkowitz, T. A. Daden and L. H. Pedersen, “A Smooth Particle Mesh Ewald Method,” Journal of Chemical Physics, Vol. 103, No. 19, 1995, pp. 8577-8593.
- K. Wüthrich, “NMR of Proteins and Nucleic Acids,” John Wiley & Sons, Inc., New York, 1986.
- D. K. Wilkins, S. B. Grimshaw, V. Receveur, C. M. Dobson, J. A. Jones and L. J. Smith, “Hydrodynamic Radii of Native and Denatured Proteins Measured by Pulse Field Gradient NMR Techniques,” Biochemistry, Vol. 38, No. 50, 1999, pp. 16424-16431.
- C. H. Cho, J. Urquidi, S. Singh and G. W. Robinson, “Thermal Offset Viscosities of H2O, D2O, and T2O,” Journal of Physical Chemistry B, Vol. 102, No. 11, pp. 1991-1994.
- S. A. Rogers-Sanders, D. V. Velde and C.K. Larive, “Evaluation of NMR Diffusion Measurements for the Conformational Analysis of Flexible Peptides,” Journal of Analytical Chemistry, Vol. 369, No. 3, 2001, pp. 308-331.
NOTES
*Corresponding author.