Open Journal of Geology
Vol. 2 No. 3 (2012) , Article ID: 21389 , 7 pages DOI:10.4236/ojg.2012.23018
Analytical Model of Landslide Risk Using GIS
1Department of Civil Engineering, COPPE, Federal University of Rio de Janeiro, Rio de Janeiro, Brazil
2Transpetro S/A, Rio de Janeiro, Brazil
3Centro Federal de Educação Tecnológica Celso Suckow da Fonseca/UnED-Petrópolis, Rio de Janeiro, Brazil
Email: cfmahler@acd.ufrj.br
Received April 12, 2012; revised May 24, 2012; accepted June 4, 2012
Keywords: Risk; Landslide; GIS; Bayesian Theory
ABSTRACT
This paper presents a model for quantitative risk analysis with the application of geographic information systems (GISs) using Bayesian theory. It was used for the thematic integration of maps in a natural state (vegetation, geological-geotechnical, natural drainage and gradient). A landslide susceptibility map was produced based on this integration associated with vulnerability data (time and housing construction standards) and risk criteria. A quantitative risk map for a specific area was also drawn up from this data.
1. Introduction
Landslides are extremely important geological/geomorphologic processes. Although they are natural evolutionary processes of relief, they often claim many victims and/or cause significant material losses, as well as help unleash other events, such as erosion processes. Urban consolidation in mid-size and large towns and cities and the consequent disorganised land occupation in the past few decades are the prime factors responsible for catastrophes in various regions of Brazil.
In land planning and organisation, one of most important stages involves zoning in accordance with different risk levels. To formulate zoning rules, it is necessary to distinguish between the concepts of susceptibility and risk. The first refers to the probability that a possible fact will affect a zone with certain intensity, irrespective of harm to the population. The concept of risk includes the possible existence of damages to the population, facilities, infrastructures or activities. Therefore, when zoning a piece of land, not only the susceptibility of the zones to natural phenomena should be considered but also the existence of residents, infrastructure, facilities and other factors in the area that is vulnerable and may be affected. Several studies have been made during these past decades to identify areas susceptible to mass movements, due to the large number of geological-geotechnical accidents that have occurred causing damage to the population.
When the study involves vast areas, it is preferable for the analysis to be done with the help of a geographic information system (GIS). A GIS is a tool that can organise georeferenced databases, address a large volume of data and reduce inaccuracy in comparison with the work done by hand.
The characterisation of the physical environment of a study area can provide key information for rational planning of the use and conservation of land and water. In this context, the use of a GIS permits the integration of the data more accurately and faster than the traditional analytical methods. A GIS also enables better use of existing data and from it can provide further information, thereby permitting more efficient organisation of actions. GISs are, in the environmental area, especially in developing or Third World countries, valuable tools for control and more rational use of scarce financial resources.
Developing computer techniques has endowed cartographic information processing with incredible speed and precision. The use of the tool in a GIS environment helps integrate information from various sources and on different topics. This is why it is extremely important for land planning and specifically risk management.
2. Methodology
Several proposals for risk assessment methods have already been made, but most of them basically consist of the production and use of preliminary maps, such as susceptibility and/or hazard charts. The model proposed here involves a procedure to assess a landslide risk based on a three-tier mapping structure: thematic, susceptibility or hazard and risk maps.
2.1. Thematic Maps
Maps or charts are cartographic documents used for various purposes. Thematic maps present information relating to one or more aspects of the biotic, human and physical environment.
Map production using geographic information system technology is an incredible advance in the area, by linking geographic data to alphanumerical data, the latter of which are normally represented in the form of tables, producing thematic maps that combine information with major benefits compared to the traditional systems.
One of the major problems when preparing charts and maps concerns the cartographic principles and content of each document. One of the aspects of the environment that is recorded in maps and charts relates to the physical environmental components, namely rocks, unconsolidated materials, water, relief, climate conditions and related aspects, such as vegetation, and so on.
Therefore, thematic maps are cartographic documents concerning the physical environment and are produced using physical data of the region and its current status that are the basis for undertaking a cartographic analysis. The proposed thematic maps in this model are those that record the spatial variability of physical aspects contributing to landslide occurrences.
There are a number of methods to prepare natural state maps. They consist of office work such as photo-interpretation and geoprocessing, as well as field work. The data come from earlier studies and aerial photos.
The topographical map is the basic document that must be available as a source of data. The restriction when making these charts is precisely the scale, range of the relief and equidistance of the contours where they appear. All data from the existing cartographic basis (topographical map) is put together to form a database. The information must be georeferenced to obtain the following maps:
• Gradient map;
• Vegetation map;
• Natural drainage map;
• Map of geological-geotechnical domains;
• Map of construction vulnerability;
• Regional geographic map.
The maps characterise a distinct theme that refers to the physical environment. Each theme consists of classes (attributes) that are associated with a deduced probability corresponding to specialist opinions regarding existing risk factors. Considering the absence of statistical data for the relationship between existing risk factors and landslide occurrences, probabilities are adopted, deduced by specialists, which express the confidence with which each attribute contributes, to a greater or lesser degree, to the likelihood of landslide occurrence. The existing risk factors correspond to the set of environmental, geologic and geometric conditions in which landslides will occur. The model in question does not include factors directly responsible for causing landslides (rainfall, erosion, temperature variation, etc.) due to the scarcity of data.
Probability by judgement is adopted to quantify the attributes in each thematic class, which is a way of formally capturing specialist opinions in figures and then combining these opinions in models. The uncertainty captured in this way has a numerical value that depends on the specialist’s personal skill in judging uncertainties developed from past experience.
Current experience suggests that at least in the early stages of specialist deduction, verbal descriptions are more intuitive than numbers. Thus, such descriptions are included as components within event or fault trees. Accordingly, approximate transformations between verbal descriptions and approximations by quantifying probabilities by judgement can be fixed for component events.
Table 1 gives a list of verbal descriptions with their values adapted from studies by [1,2]. These values were attributed in each thematic class to express confidence, by judgement of each situation contributing to landslide occurrence.
2.2. Thematic Integration in GIS
The GIS environment permits frequently used overlapping operations. The georeferenced databases form information plans (IPs) that overlap each other. Therefore, overlapping can be efficiently implemented with an unlimited number of possible overlaps for this kind of analysis.
The geoprocessing system used is SPRING 4.3.2, developed by INPE1 [4], with all Brazilian technology. SPRING is based on a data model focusing on objects and combines the ideas of “fields” and “geographic objects”. This provides the menu-driven interface and the LEGAL language (Algebra-based Geographic Space Language).
This language is based on formulating geographic algebra that helps express specific operations for each type
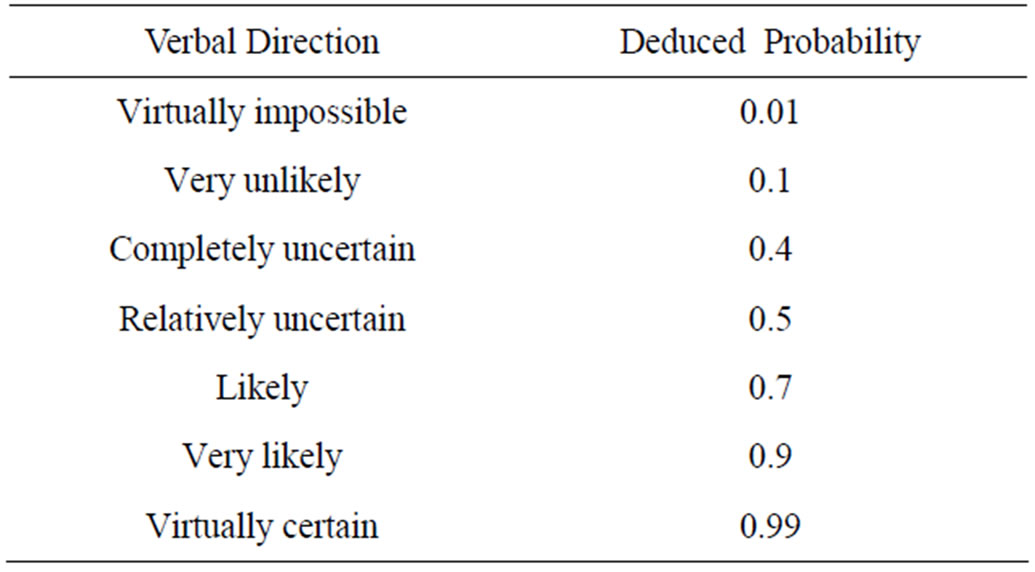
Table 1. Verbal descriptions of adapted probabilities [3].
of data, and explains mathematical and algebraic operations or logical analyses that transform one kind of data into another. It was therefore possible to use Bayesian probability theory to integrate the natural state maps in the GIS environment.
2.3. Bayesian Theory
Bayesian probability, based on Bayes’ Theorem, is the result of the product rule and is related to two concepts: later and earlier probability. In other words, with prior knowledge of a certain aspect, the prior probability can be updated by an extra piece of information acquired from observing phenomena or evidence.
Bayes’ Theorem is used to make statistical inferences to update estimates of probability that different hypotheses are true, based on the findings and knowledge of how these findings relate to the hypotheses. Bayes also suggested that probabilities deduced by judgement, from mere “feelings”, could be combined with probabilities obtained by relative frequencies using a theorem [5].
According to [6] Bayes’ Theorem formulates a rule to update the conviction of hypothesis “H” (namely, the initial probability of hypothesis “H”, in this case landslide occurrences) considering the additional evidence E and preceding information (context) I. In other words, this theorem proposes that probabilities can be revised when more information is obtained about the events of interest.
Therefore, for the scenario in question, context I can be considered as the physical environment in which event H (landslide) occurs, given the presence of E (evidence). The probability of a landslide occurring where the evidence (E) is present can be expressed in terms of conditional probability.
From these concepts, Bayesian theory was applied to the model by taking as an initial or prior probability (H) the data from the Inventory of Accident and Risk Situations of Mass Movements (landslides) compiled by [5]. The evidence consists of the probabilities deduced by judgement, associated with the classes specified for each theme in the natural state maps (gradient, natural drainage, vegetation and geological-geotechnical) that provide additional information that will increase or decrease the prior probability. Therefore, the initial probability can be updated when integrated by a factor that represents the presence or absence of further information, namely, landslides.
Based on Equation (1), the version of Bayes’ Theorem for updating initial probabilities, considering multiple data in the proposed context is expressed by (see Equation (1)).
3. Susceptibility and Risk Maps
By applying the Bayesian algorithm in the georeferenced system, we then have a map with numerical value representations. To sector the construction of the susceptibility or hazard and risk maps of a certain area, it is necessary to establish a ranking and criteria to establish ranges (quantitative intervals) of acceptability of hazard and risk.
3.1. Criteria for Hazard and Risk Limits
According to [7] there is a level of acceptability and tolerance of risks to landslides in all regions with potential occurrence (hazard) of this kind of phenomenon. Several studies have been done to establish risk levels considered tolerable to enable development of risk management processes.
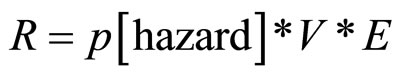
Various authors consider the f × N curve as a criterion for defining quantitative risk limits. This method considers the annual accident frequency per number of fatal victims for a certain region. Therefore, the quantitative risk limits of the f × N curve are presumed as a criterion. Figure 1 shows an example of this curve calculated for the municipality of Petrópolis, from the data of the inventory of accident frequency (f) with fatal victims (N), between 1943 and 1989 [5]. Petrópolis is located in the mountain region of the state of Rio de Janeiro and has a history of frequent landslides, aggravated by largely unregulated land occupation and deforestation of hillsides.
From the curve f × N the quantitative ranges are defined that are required for slicing the Risk Map, summarised in Table 2.
Generally the risk is estimated by the product of probability of the consequences and can be defined as the association of probability of occurrence of some damage to an element at risk and potential accident occurrence (risk situation), represented by Equation (2):
 , (2)
, (2)
where:
r—Risk;
p[hazard]—Probability of hazard occurrence (mass movement) in a risk situation;
V—Vulnerability of elements at risk;
e—Elements at risk—human lives, buildings, facilities.
Equation (2) expresses that, when analysing a risk
 (1)
(1)
Figure 1. f × N curve for deaths due to mass movements in Petropolis [5].

Table 2. Risk Limits used when segmenting the quantitative risk map.
situation, the hazard should be identified as a natural phenomenon that can cause an unpleasant fact, such as landslides on natural or artificial slopes, falling rocks, erosion or scouring of river banks, mud slicks, embankment slides, and so on.
Quantifying possible occurrence of the hazard is expressed as the probability of hazard occurrence calculated by integrating frequency data of landslide occurrences and additional information relating to the physical environment.
Equation (3) was used to calculate the hazard, attributing the unit value to the term “E”, considering the calculation of individual risk. Therefore, Equation (3) is expressed as follows;
 (3)
(3)
Vulnerability (V) in the context of quantitative risk analysis is associated with the level of potential damages, or degree of losses, expressed normally on a scale from 0 to 1 [5]. The assessment of vulnerability therefore involves knowledge of the interaction between a given landslide and the affected elements.
Vulnerability values are attributed on the scale of 10−1 based on this interval (0 to 1). Therefore, the criterion adopted for calculating the susceptibility range is expressed by Equation (4).
 (4)
(4)
The limit values for hazard ranges are obtained by applying the values established for risk in Table 2 in Equation (4), summarised in Table 3.
3.2. Susceptibility Map
The landslide susceptibility map is based on information from natural state maps, prepared by means of photointerpretation, field work and bibliographic research. Mechanical parameters, not used in this study, may be associated to soil properties in a specific map.
The quantified hazard is considered as the probability of landslide occurrence in the physical space, characterising a risk situation.
To update the initial probability, an algorithm is applied using the mathematical expression (1), where that corresponding to an area of 25 m2 (5 × 5 m) is adopted for each point, represented by one “pixel”. The fields are transformed one by one so that the resulting effect on each point is independent of the values of neighbouring points. Figure 2 gives an example of the thematic integration by using Bayes’ Theorem.
Next, a map is obtained with the numerical model, in which the data are now quantitative. The points assume numerical values and may consist of matrix representations (rectangular grids), as shown in Figure 3. The updated probability will be interpreted as the potential for landslide occurrence in that area.
From the numerical model map, the quantitative ranges defined in Table 3 are applied to the qualitative creation of the susceptibility map. The quality of the hazard is defined as being Very High, High, Average or Low.
3.3. Quantitative Risk Map
This map documents the risk situations and their potential consequences. The consequences associated with a risk situation may affect human lives, cause economic impacts or environmental changes. Accordingly, the risk situation of a particular area, of a slope surface, will depend on land use and conditions in which it is found.
According to [8,9], risks can be mapped at two different detail levels: zoning (or sectoring) the risk and risk

Table 3. Hazard limits used in segmenting the susceptibility map.
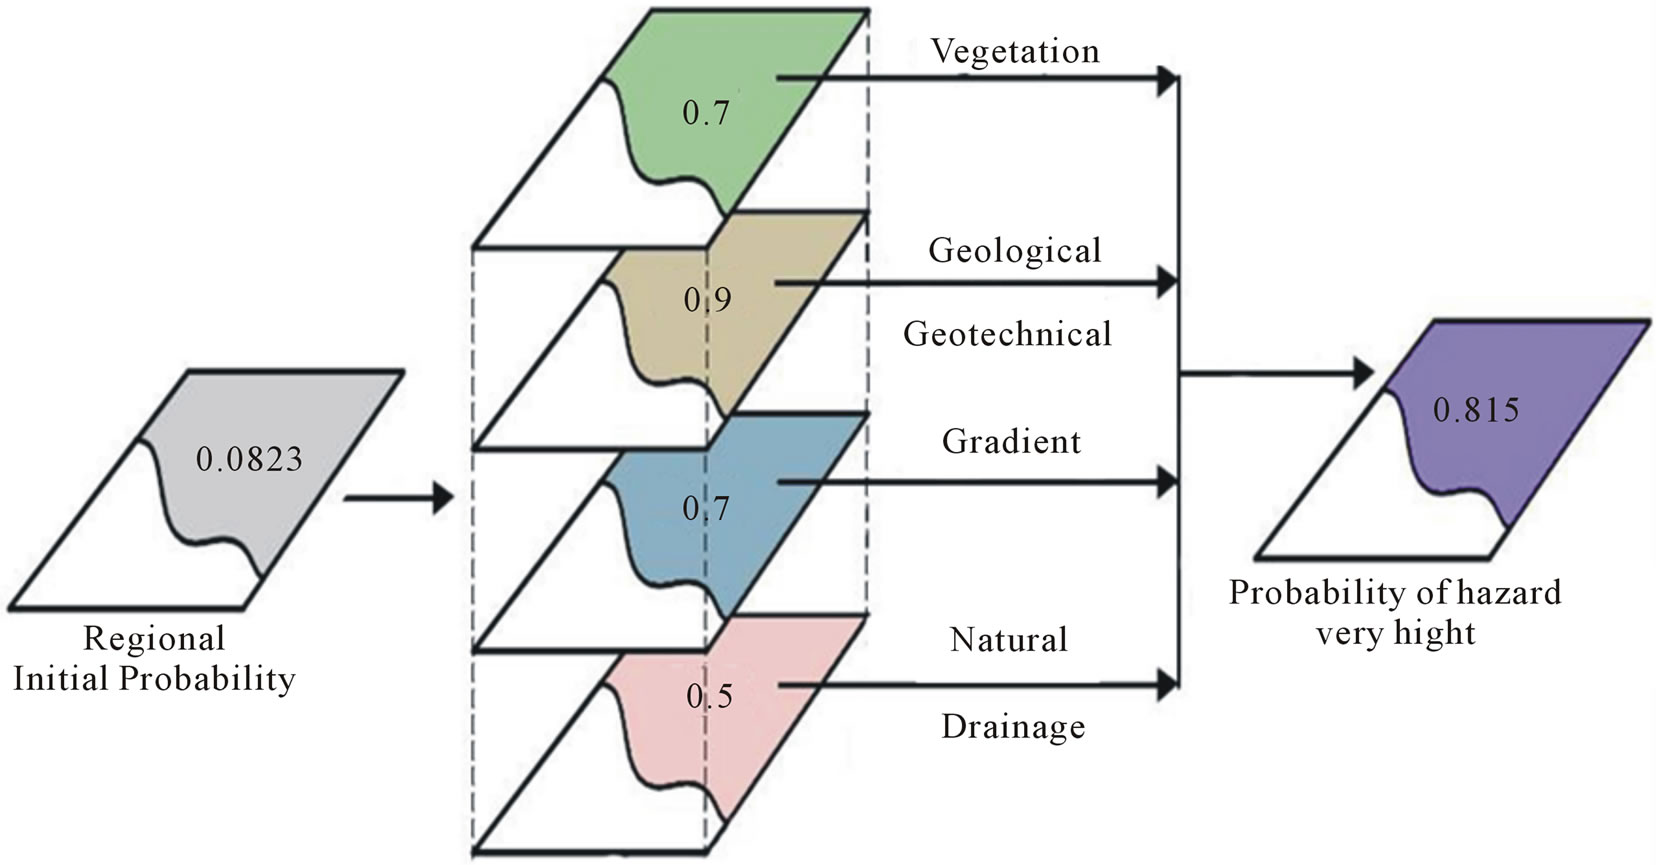
Figure 2. Example of application of the bayesian theory [3].

Figure 3. Transformation of thematic image in numerical image (matrix) [3].
registration. In risk zoning, sectors are demarcated in which a number of dwellings generally exist. It is therefore assumed that all dwellings in the sector have the same degree of risk, for example, high risk. However, in reality dwellings in the sector may not have the same risk status. Hence, this model involves making a generalisation in risk zoning.
Therefore, the prepared quantitative risk map is a sectoring map, namely, there is generalisation of risk areas, meaning that cases may exist where the map’s classification does not correspond to the situation of the particular terrain. In such cases it will be necessary to register the risk areas later in order to check the risk status of the place. This is done in the risk management stage.
As already mentioned, risk is the combination of susceptibility maps with vulnerability information. The word vulnerability means being susceptible to some condition or event. It is a term used to express the degree of relationship between an element in the environment and a certain event that, if it happens, may affect the community of the element in normal conditions.
The socioeconomic aspect of a certain region and how long people have been living there affect or contribute to the analysis of the vulnerability pattern. The building standards and economic level of the population are factors directly influencing the risk analysis due to the hazard status that they give to landslides.
4. Practical Application and Risk Analysis
This method was applied in Petrópolis when preparing the City Risk Reduction Plan.
In order to validate the methodological model, the results obtained from drawing up the landslide and risk susceptibility maps were compared with the risk areas identified through the Inventory of Accidents and Risk Situations [5].
In the study by [5] a risk average was estimated for a certain place defined earlier as a risk area based on the inventory data and author’s experience. A single probability value was calculated for each place to quantify the risk. Figure 4 gives an example of the various local situations.
Duques is a neighbourhood half way down the slope of the BR-040 highway. The land is characteristically colluvium talus, with many rock fragments in an unstable state, many originating from rock quarrying to build the highway. At some points the road drainage was precariously blocked and diverted and, in fact, there is road flooding in this stretch when there is heavy rainfall due to these diversions. The area in question next to the Tinguá Biological Reserve (REBIO Tinguá) and is included in the Petrópolis APA2. The permanent preservation area is partly occupied, with this occupation expanding (despite its legal protection as a preservation area).
To check the results using geographic information systems, the predominant values in the hazard and risk maps are used in the quantitative risk analysis. Table 4 shows a summary of the local data.
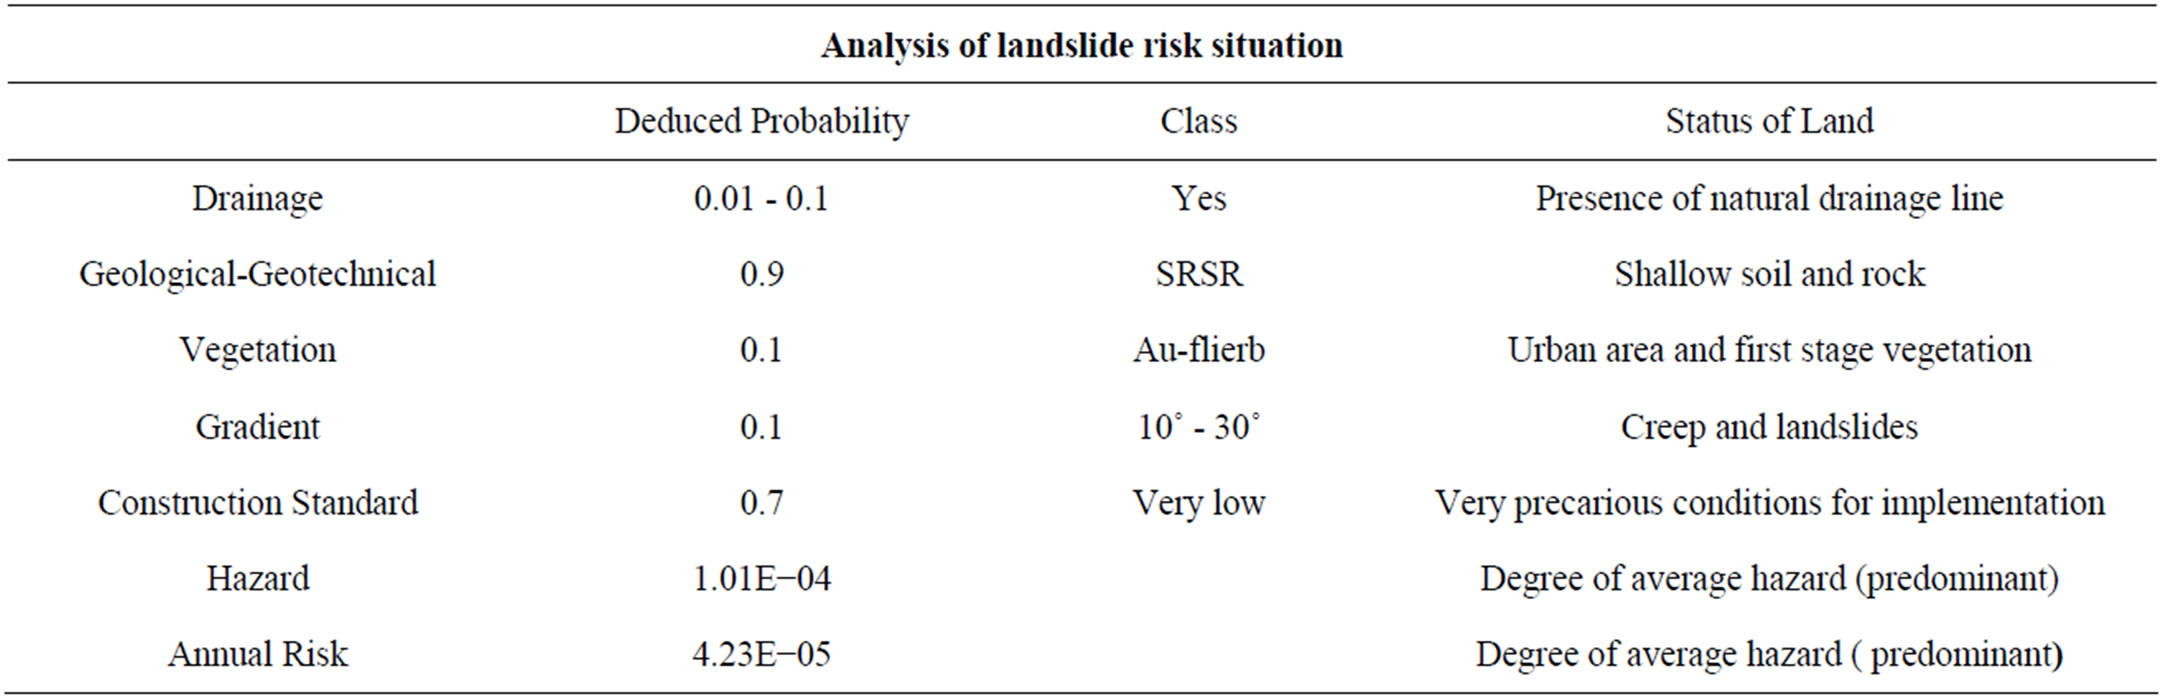
Table 4. Quantitative risk analysis of the Duques neighbourhood [3].
Figure 4. Comparative analysis of area defined in inventory and resulting stain on the hazard map and quantitative risk map [3].
From these values it can be deduced that the factors responsible for intensifying the hazard are an association of the existence of land with shallow soil on rock in an urban area, poor construction standards and presence of a natural drainage line. All these parameters have values of deduced probabilities that together result in an average risk degree.
To reduce the degree of risk, the deduced probability value of the parameters may be altered: urban area and construction standard, which can be changed by human action. This type of analysis suggests a more efficient risk management degree, that is, the risk diminishes as management increases.
Table 5 shows an example of risk analysis with the alteration of deduced probabilities, considering three situations:
1) Current status, risk degree if continuing unaltered;
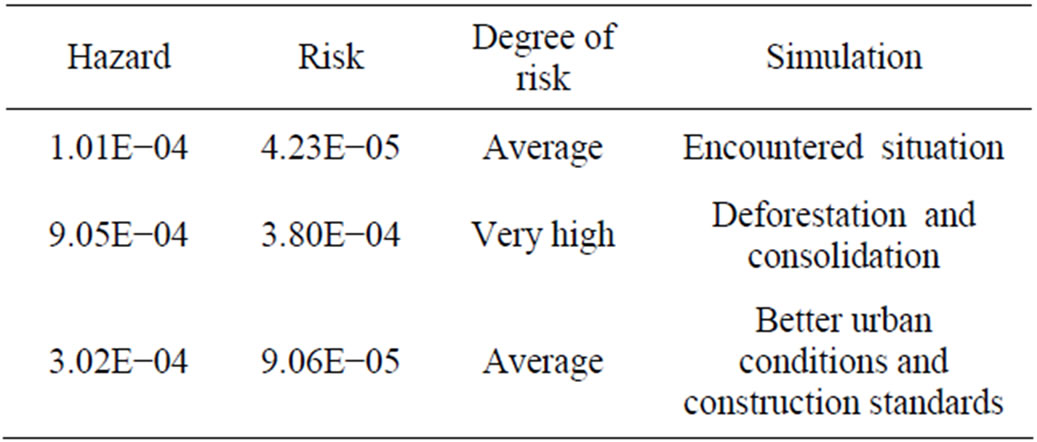
Table 5. Quantitative risk analysis.
2) An additional 50% of deduced probability of the urban area parameter, considering, for example, an increase in the demographic density and deforestation level.
3) A reduction of 50% in the deduced probability of the urban area parameter and construction standards, namely, improvements in housing and urban conditions.
The results demonstrate that the risk will be high in the event of deforestation and occupational expansion. However, if the urban occupation is controlled and there are housing and urban improvements, the conditions of the areas will be better than their current state.
5. Conclusions
This article discusses a method for preparing an annual individual landslide quantitative risk map, demarcating risk areas using a geographic information system and landslide susceptibility maps. The combination of the characteristics and interpretations of the physical environment in a single georeferenced database showed that it was a feasible and effective way to organise and handle all information. The landslide susceptibility and quantitative risk maps produced using this method confirmed the analysed part of the results given in the Inventory of Accidents and Risk Situations.
Deduction of probabilities by specialists as a substitute for the correlations between characteristics of the physical environment and landslides by applying Bayes’ Theorem proved to be a good alternative for preparing the quantitative risk map, considering the sparse geotechnical data.
We can therefore say that the use of an algorithm based on the Bayesian statistics for thematic integration of the natural state maps brings reliable results in identifying areas susceptible to landslides.
The existence of landslide accident records in an inventory for the area under study helped when applying Bayes’ Theorem, namely the relative frequency of accidents considered as initial probabilities could be updated from the additional information.
In conclusion, defining risk areas is a valuable tool in landslide risk management and therefore the data model (georeferenced in GIS) adopted in this study can help public authorities to improve land use planning.
6. Acknowledgements
We wish to thank the funding agencies CAPES, CNPq, FAPERJ and DAAD for their constant support. We also thank the company Theopratique Obras e Serviços de Engenharia and the Petrópolis municipal government for their collaboration.
REFERENCES
- S. Lichtenstein and J. R. Newman, “Empirical Scaling of Common Verbal Phrases Associated with Numerical Probabilities,” Psychonometric Science, Vol. 9, No. 10, 1967, pp. 563-564.
- S. Vick, “Dam Safety Risk Assessment: New Directions,” Water Power and Dam Construction, Vol. 49, No. 6, 1997, pp. 40-42.
- E. Varanda, “Quantitative Landslide Risk Mapping for the 1st District of Petrópolis, Rio de Janeiro State, Using GIS,” Master’s Thesis, COPPE/Federal University of Rio de Janeiro, Rio de Janeiro, 2006.
- INPE (National Space Research Institute), “Spring Basic,” 2006. http://www.dpi.inpe.br/spring/portugues
- L. C. D. Oliveira, “Quantitative Risk Analysis of Mass Movements Using Bayesian Statistics,” Ph.D. Thesis, COPPE/Federal University of Rio de Janeiro, Rio de Janeiro, 2004.
- J. Stutz and P. A. Cheeseman, “Short Exposition on Bayesian Interference and Probability,” Computational Science Division, National Aeronautic and Space Administration Ames Research Centre, Data Learning Group, 1994. http://www.periodicos.capes.gov.br
- R. Fell and D. Hartford, “Landslides Risk Management,” Proceedings of the International Workshop on the Landslides Risk Assessment, Honolulu, 19-21 February 1997, pp. 51-109.
- Ministry of Cities, “Training in Mapping and Risk Management,” Cities Alliance, Brasília, 2006.
- Ministry of Cities, “Landslide Risk Prevention on Slopes: Guide for Preparing Local Government Policies,” Cities Alliance, Brasília, 2006.
NOTES
1Instituto Nacional de Pesquisas Espaciais [National Space Research Institute].
2Área de Proteção Ambiental [Environmental Protection Area].