World Journal of Nuclear Science and Technology
Vol.2 No.3(2012), Article ID:21258,10 pages DOI:10.4236/wjnst.2012.23017
Discussion on IAEA and China Safety Regulation for NPP Coastal Defense Infrastructures against Typhoon/Hurricane Attacks
1College of Engineering, Ocean University of China, Qingdao, China
2Disaster Prevention Research Institute, Ocean University of China, Qingdao, China
Email: {liuguilin73, *liu, huajun}@ouc.edu.cn, wang_qd1936@yahoo.cn, zt_dream@163.com
Received February 23, 2012; revised March 28, 2012; accepted May 14, 2012
Keywords: IAEA Safety Regulation; Typhoon/Hurricane Attacks; Design Basis Flood; Multivariate Compound Extreme Value Distribution; Risk Assessment; ALARP
ABSTRACT
The World Meteorological Organization estimates that about 90 percent of all natural disasters is extreme meteorological hazards like typhoon/hurricane and tropical cyclone triggered disasters. With the increasing tendency of natural hazards, the typhoon induced surge, wave, precipitation, flood and wind as extreme external loads menacing Nuclear Power Plants (NPP) in coastal and inland provinces of China. For all of the planned, designed and constructed NPP in China the National Nuclear Safety Administration of China and IAEA recommended Probable Maximum Hurricane/ Typhoon/(PMH/T), Probable Maximum Storm Surge (PMSS), Probable Maximum Flood (PMF), Design Basis Flood (DBF) as safety regulations recommended for NPP defense infrastructures. This paper discusses the joint probability analysis of simultaneous occurrence typhoon induced extreme external hazards and compared with IAEA 2003-2011 recommended safety regulations for some NPP along China coast to make safety assessment based on the “As Low As Reasonable Practice” (ALARP) principle.
1. Introduction
In China, three NPP have been built along coasts in 1980, and more than 37 NPP along coast of South-East China Sea are in the stages of planning, design, or construction. In the “2007 China Long Term NPP Plan” estimated that before 2020 about 70 billion USD (450 billion RMB) will be invested in 6 coastal provinces.
China has a wide continental slope to decay tsunami energy. If M9 earthquake occurs at Manila trench or Rykyu trench, the wave produced by tsunami wave at south and southeast China coast would be no more than 5 - 6 m [1]. In 2006, typhoon disasters were especially serious in China. Five of the most severe typhoon disasters brought about 1600 deaths and disappearances, and affected 66.6 million people. The economic loss reached 80 billion RMB and influenced agriculture areas of totally more than 2800 thousand hectares. Among these disasters, typhoon Saomai induced 3.76 m surges and 7 m waves, causing 240 deaths, sinking 952 ships and damaging 1594 others in Shacheng harbor. If the typhoon Saomai had landed 2 hours later, then the simultaneous occurrence of the typhoon surge and high spring tide with 7 m wave would have inundated most areas of the Zhejiang and Fujian provinces, where located several NPP. The results would be comparable with 2011 Japanese nuclear disaster.
With the global warming and sea level rising, the frequency and intensity of extreme external natural hazards would increase. All the coastal areas having NPP are menaced by possibility of future typhoon disasters. So calibration of typhoon disaster prevention criteria is necessary for existed and planning NPP. In China Nuclear Safety Regulations: “HAF101, HAD101/09~11” [2-5] and IAEA Engineering Safety Section: “Extreme External Events in the Design or Assessment of NPP” [6-10] there are appeared some vague definitions and they should be dissected and described with probability characteristics by using statistical analysis.
This paper discusses the joint probability analysis of simultaneous occurrence typhoon induced extreme external hazards and compare China and IAEA recommended safety regulation design criteria for some constructed NPP coastal defense infrastructures along China coasts.
2. Discussion on Design Basic Flood (DBF)
For coastal sites, IAEA, US NRC and China safety regulations [2-10] recommended evaluation of DBF, which should be the combination of following three parts: Probable maximum storm surge (PMSS) induced by Probable Maximum Typhoon (PMT), spring tide and simultaneous extreme wave height. Probable wind-wave effects considered independently or in combination.
IAEA recommends that deterministic and probabilistic methods for evaluating the design basis flood should be considered complementary. The estimated flood hazard should be compared to historical data to verify that the specified design basis exceeds the historical extreme by a substantial margin. For example, the characteristics of PMT and Probabilistic models for estimating design basis floods are generally based on approaches that characterize the extreme flood as a random event, describe the properties of this random phenomenon using probability distributions, and use these probability distributions to estimate extreme floods corresponding to a specified probability of exceedance.
The two key components of the probabilistic models are 1) the historical flood data and 2) the probability distribution used to describe the historical flood data. Typically, the historical record of annual maximum instantaneous peak discharge at the site of interest. Because the random variable of interest—the peak discharge—is represented as a continuous variable, a continuous probability distribution is appropriate. The design-basis flood at the site can be selected from the frequency distribution of extreme floods.
A suitable combination of flood causing events depends on the specific characteristics of the site and involves considerable engineering judgment. The following is an example of a set of combinations of events that cause floods for use in determining the design conditions for flood defense in coastal areas: the astronomical tide, storm surge and simultaneous wave. The design basis flood associated with an established probability of exceedance (e.g. 1 × 10⁻⁴) for the combination of events should be determined.
The above definitions in safety regulation of coastal defenses against typhoon attacks for nuclear power plant are influenced by many uncertainty factors such as the differences in comprehensions and calculation methods of them. DBF as design criteria is used for all of planned, designed, uncompleted and constructed nuclear power plants in China but not included any joint probability consideration. There are some facts must be taken into account: First, prediction of typhoon induced extreme events instead of traditional annual maximum data sampling, the typhoon process maximum data sampling is used, it significantly improved description of the probability laws of extraordinary floods; Second, PMT in different sea area is related to annual occurring frequency of typhoon (λ) and six typhoon characteristics. It means that different PMT can be derived from different combinations of typhoon characteristics; Third, according to the randomness of annual typhoon occurrence frequency along different sea areas, it can be considered as a discrete random variable. Typhoon characteristics or typhoon-induced extreme sea events are continuous random variables. The Multivariate Compound Extreme Value Distribution (MCEVD) can be then derived by compounding a discrete distribution and the extreme distribution for typhoon induced extreme events along coasts [11,12].
3. Theory of Multivariate Compound Extreme Value Distribution (MCEVD)
In 1972, Typhoon Rita attacked Dalian port in the North Bohai Bay of China, causing severe damage in this port. The authors found that, using traditional extrapolation (such as a Pearson type III model), it was difficult to determine the design return period for the extreme wave height induced by a typhoon. According to the randomness of annual typhoon occurrence frequency along different sea areas, it can be considered as a discrete random variable. Typhoon characteristics or typhoon-induced extreme sea events are continuous random variables. The Compound Extreme Value Distribution (CEVD) can then be derived by compounding a discrete distribution and the extreme distribution for typhoon-induced extreme events along China’s coasts [13]. Then the CEVD is used to analyze long-term characteristics of hurricanes along the Gulf of Mexico and the Atlantic US coasts [14]. During the past few years, CEVD has been developed into MCEVD and applied to predict and prevent typhoon induced disasters for coastal areas, offshore structures, and estuarine cities [15-19]. Both CEVD and MCEVD have the following advantages: instead of traditional annual maximum data sampling, the typhoon process maximum data sampling is used; and the typhoon frequency is used in the models. Derivation of Poisson-Nested Logistic Trivariate Compound Extreme Distribution (PNLTC-ED):
As mentioned above, frequency of occurrences of extreme events can be fitted to Poisson distribution, as
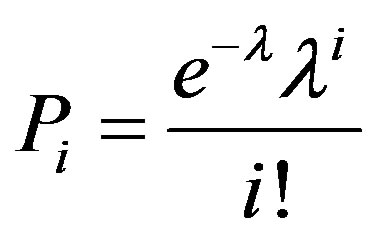 (1)
(1)
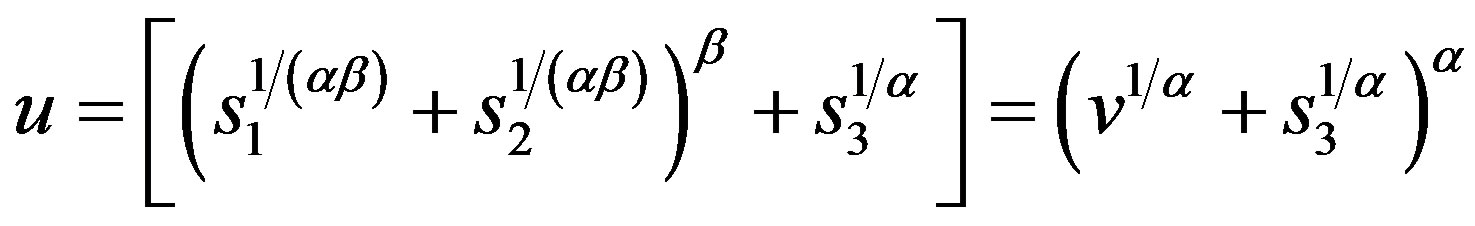
and substitute nested-logistic trivariate distribution [20] for the continuous distribution , the PNLTCED can be obtained using:
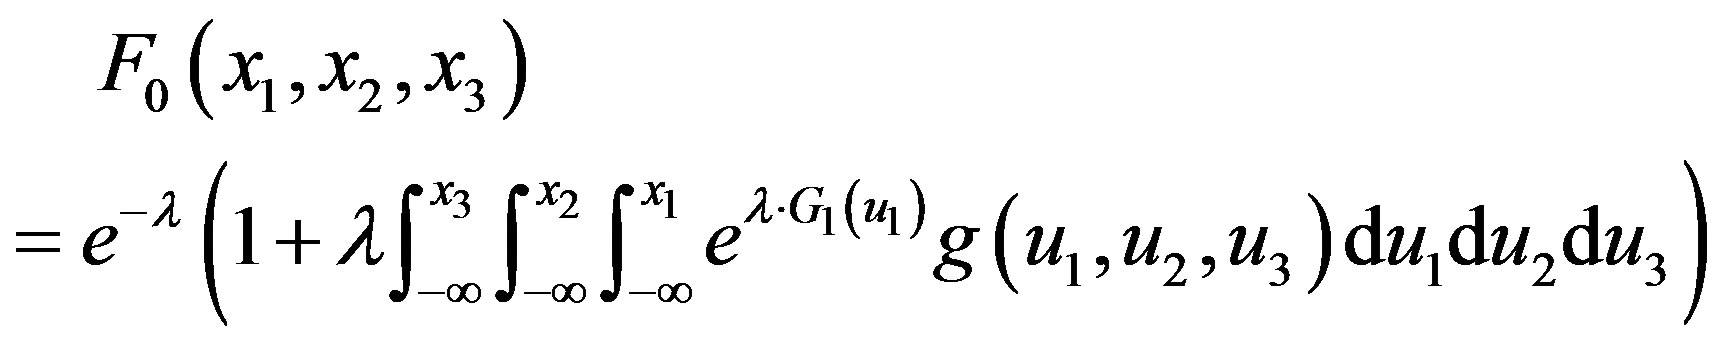 (2)
(2)
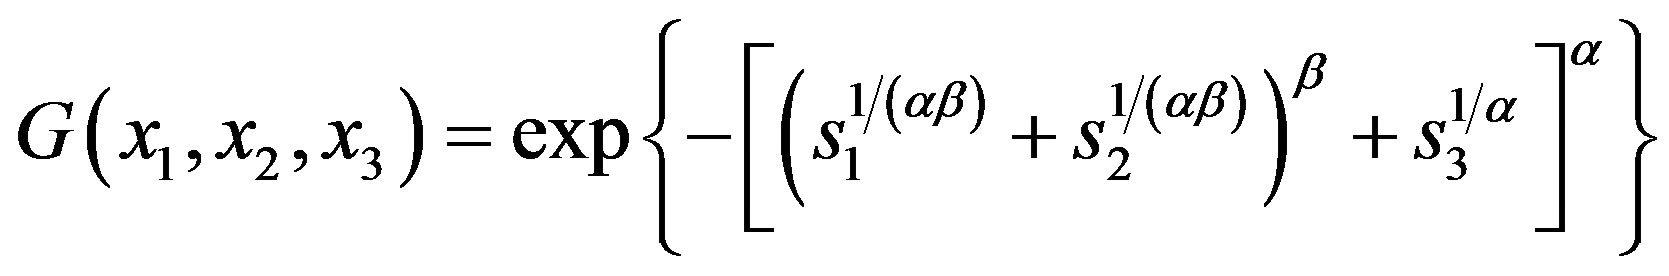
Nested-logistic trivariate distribution is expressed as:
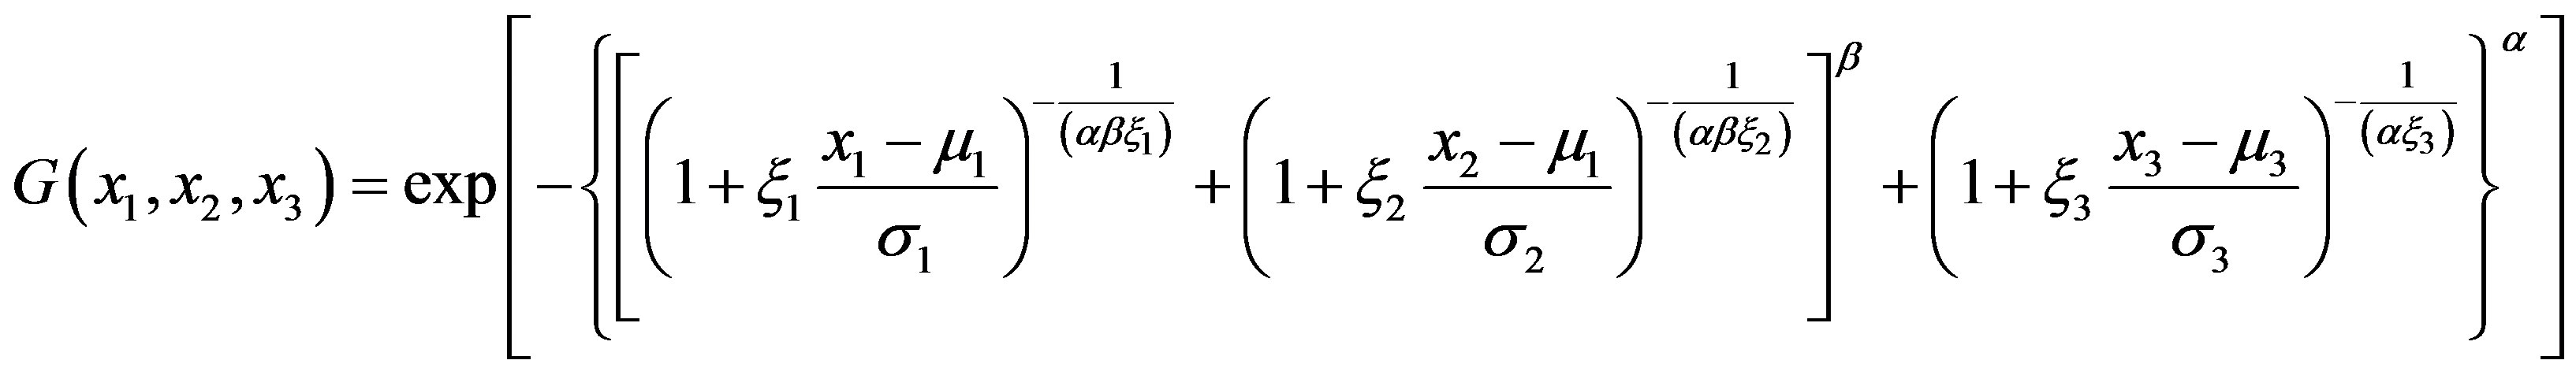 (3)
(3)
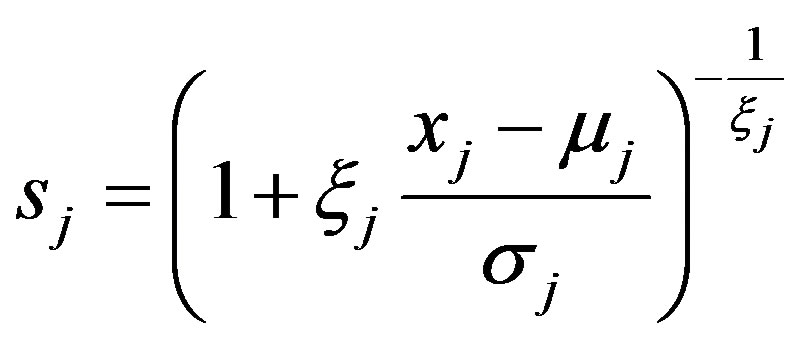
In which ,
,  ,
,  are the shape, location and scale parameters of the marginal distributions
  to
to  (j = 1, 2, 3), respectively. And dependent parameters α, b can be obtained by moment estimation
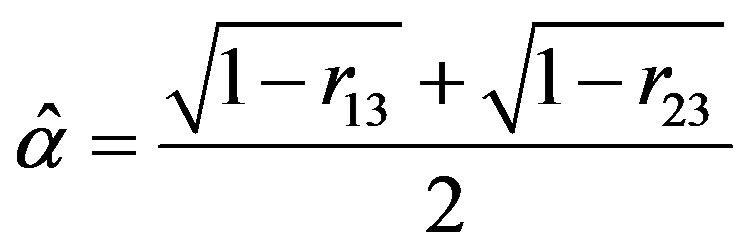 (4)
(4)
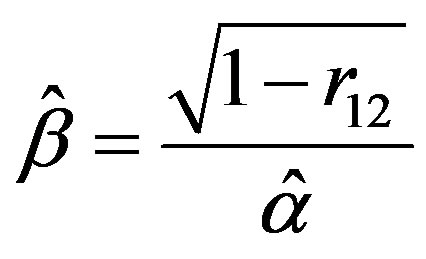 (5)
(5)
where  is the correlation coefficient between xi and xj for i < j, i, j = 1, 2, 3.
Let
 (6)
(6)
Then Equation (3) can be written as
 (7)
(7)
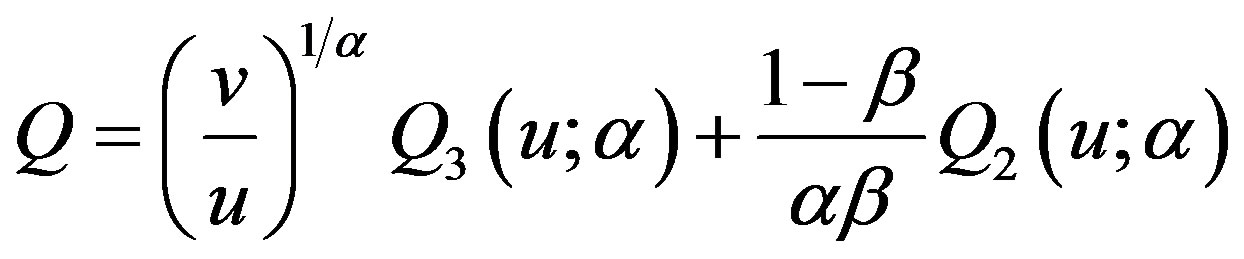
Its corresponding probability density function is
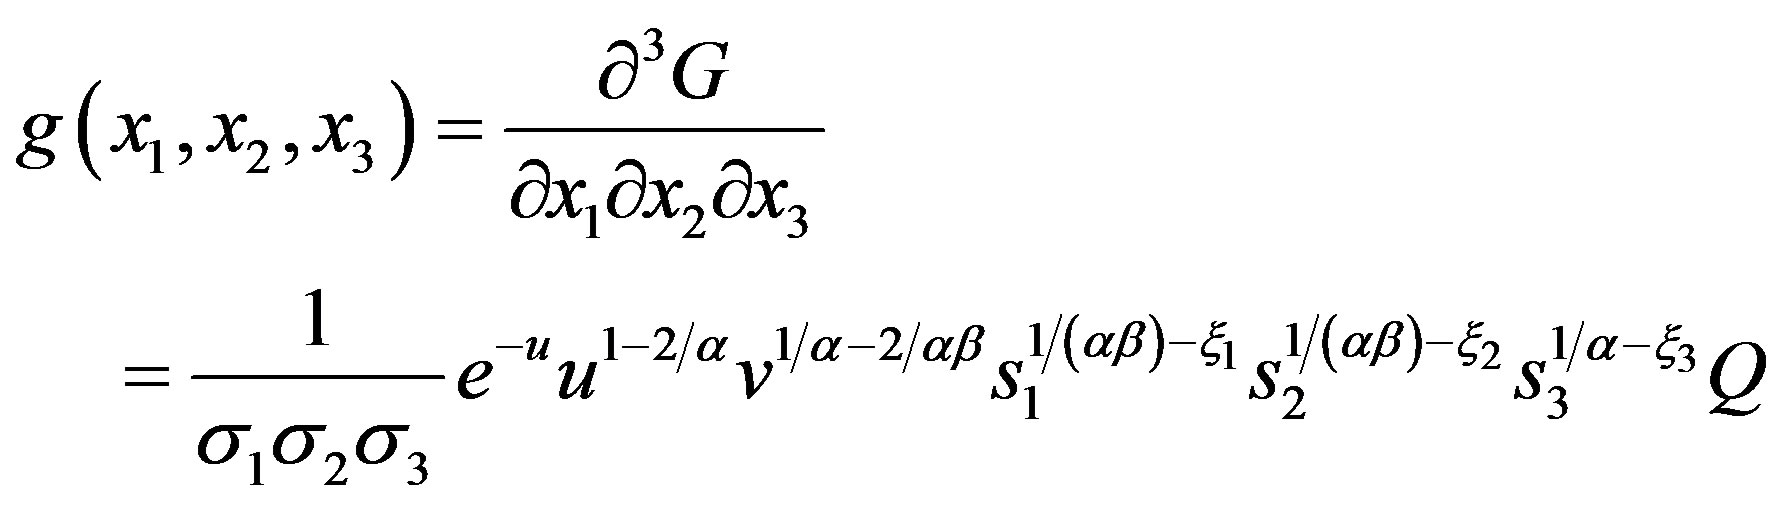 (8)
(8)
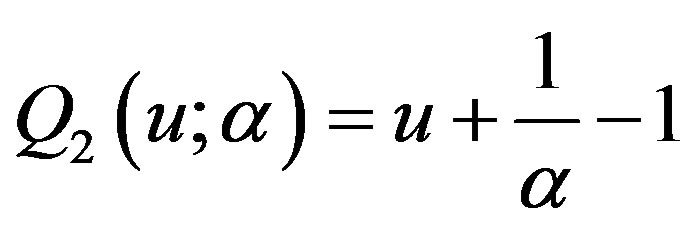
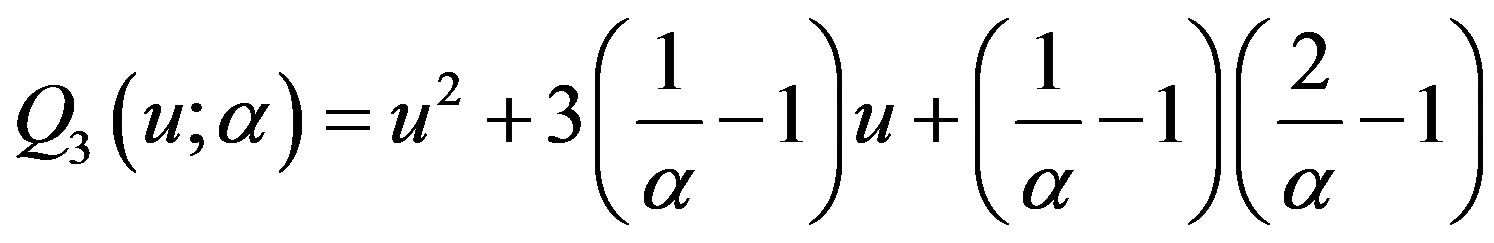
In which
 (9)
(9)
 (10)
(10)
 (11)
(11)
 (12)
(12)
 (13)
(13)
Trivariate layer structure (α-outside, b-inside layer) shows that the correlation between x1 and x2 is better than those among x1, x3 and x2, x3.
As shown above, the PNLTCED can be obtained through the estimation of parameters of the marginal distributions and their dependent parameters. The PNLTCED considers the extreme event occurring frequency and combination of trivariate variable and it has a simple structure. Consequently, it is easy for use in engineering applications.
Many application of MCEVD in engineering design and risk analysis show the scientific and reasonable of its predicted results in China and abroad [21-24]. As mentioned in “Summary of flood frequency analysis in the United States” [25]: “The combination of the eventbased and joint probability approaches promises to yield significantly improved descriptions of the probability laws of extraordinary floods”. MCEVD is the model which follows the development direction of the extraordinary floods prediction hoped for by Kirby and Moss. Since 2005 hurricane Katrina and Rita disasters proved accuracy of 1982 predicted hurricane characteristics and after disaster calculated results. It stands to reason that MCEVD is a practicable model for prediction of typhoon/hurricane/tropical cyclone induced extreme events. Our proposed methods in [13,14,24,25] are used as design criteria of wind-structure interaction experimentation for mitigating hurricane-induced coastal disasters [26].
4. Design Code Calibration of Coastal Defense against Typhoon Attacks from Lesson Hurricane Katrina Disaster
In 1979, American National Oceanic and Atmospheric Administration (NOAA) divided Gulf of Mexico and Atlantic coasts into 7 areas according to hurricane intensity, in which corresponding Standard Project Hurricane (SPH) and Probable Maximum Hurricane (PMH) were proposed as hurricane disaster prevention criteria [27]. Using Compound Extreme Value Distribution (CEVD) [14], the predicted hurricane central pressures with return period of 50 yr and 1000 yr were close to SPH and PMH, respectively, except that for the sea area nearby New Orleans (Zone A) and East Florida (Zone1) coasts, hurricane intensities predicted using CEVD were obviously severer than NOAA proposed values. SPH and PMH are only corresponding to CEVD predicted 30 - 40 yr and 120 yr return values, respectively. In 2005, hurricane Katrina and Rita attacked coastal area of the USA, which caused deaths of about 1400 people and economical loss of $400 billion in the city of New Orleans and destroyed more than 110 platforms in the Gulf of Mexico. The disaster certified that using SPH as flood-protective standard was a main reason of the catastrophic results [28-30]. Figure 1, Tables 1 and 2 indicate that both
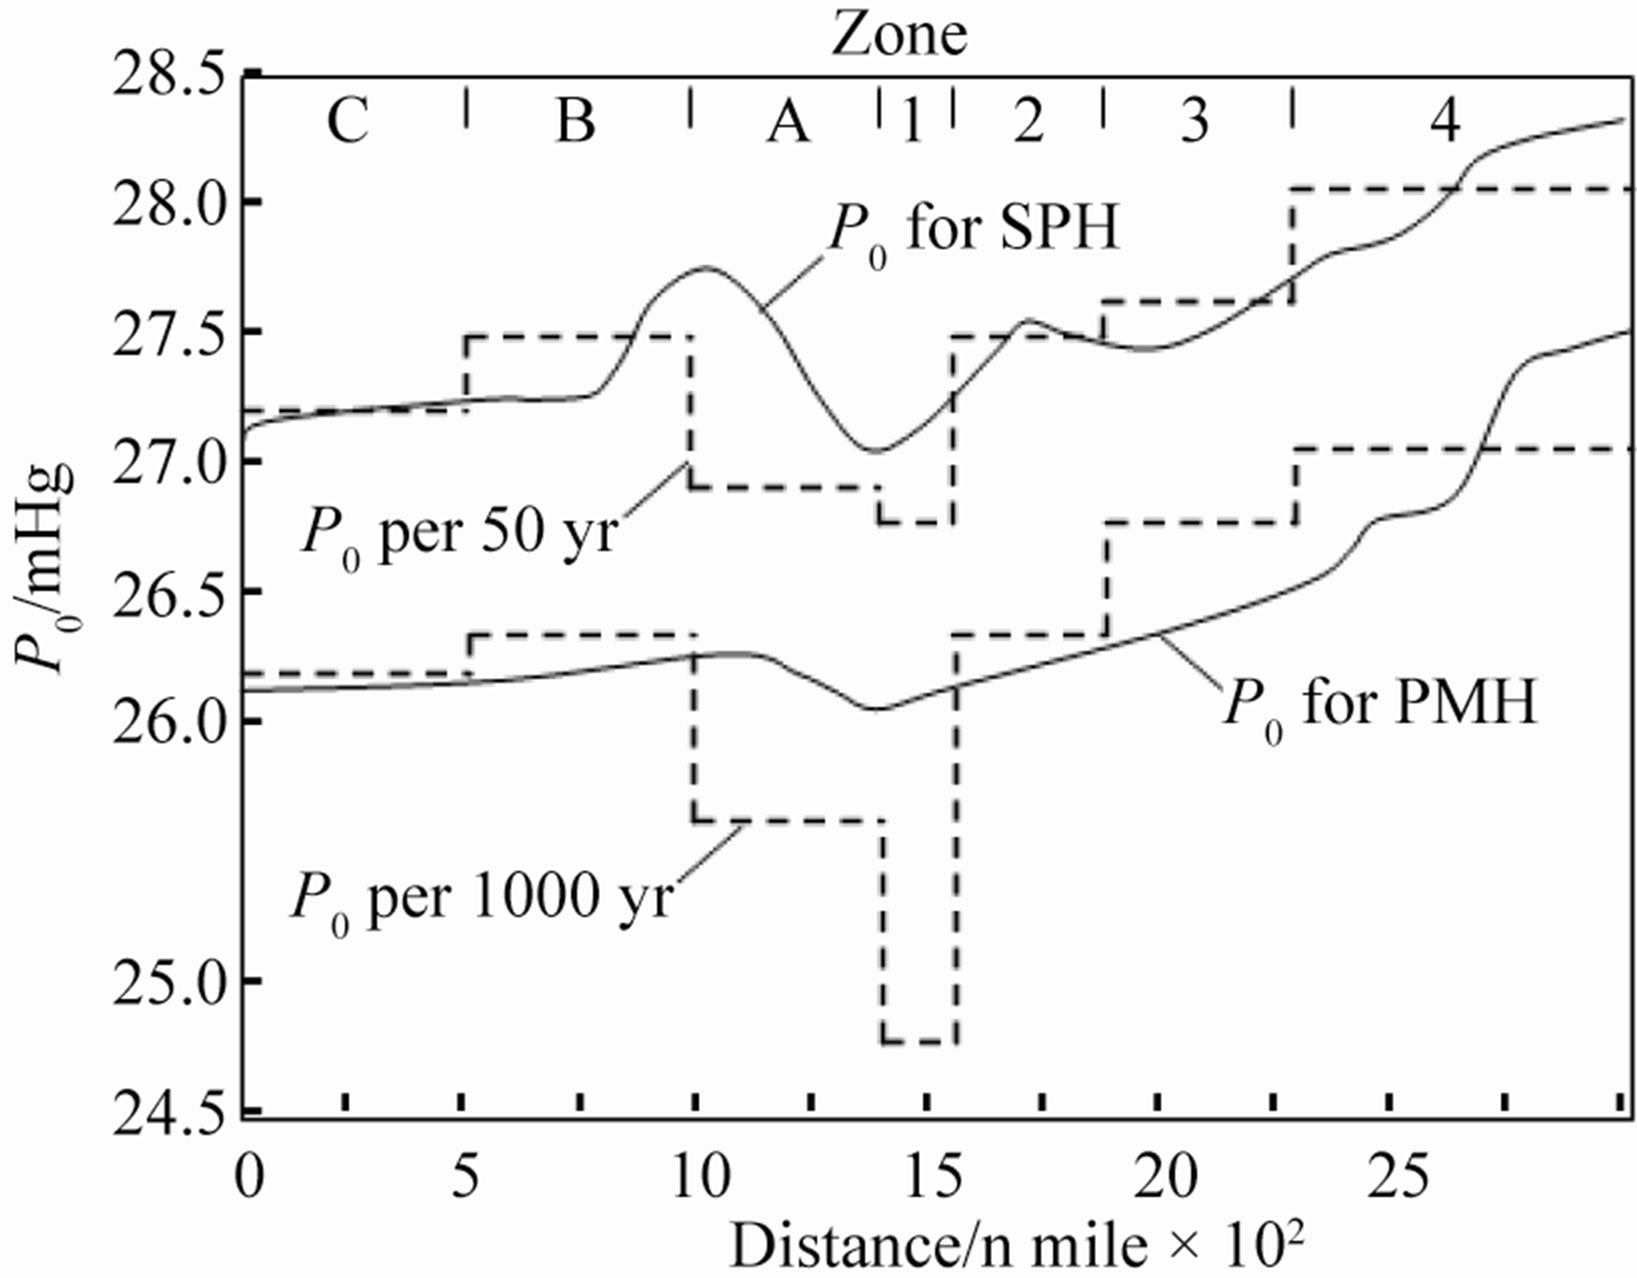
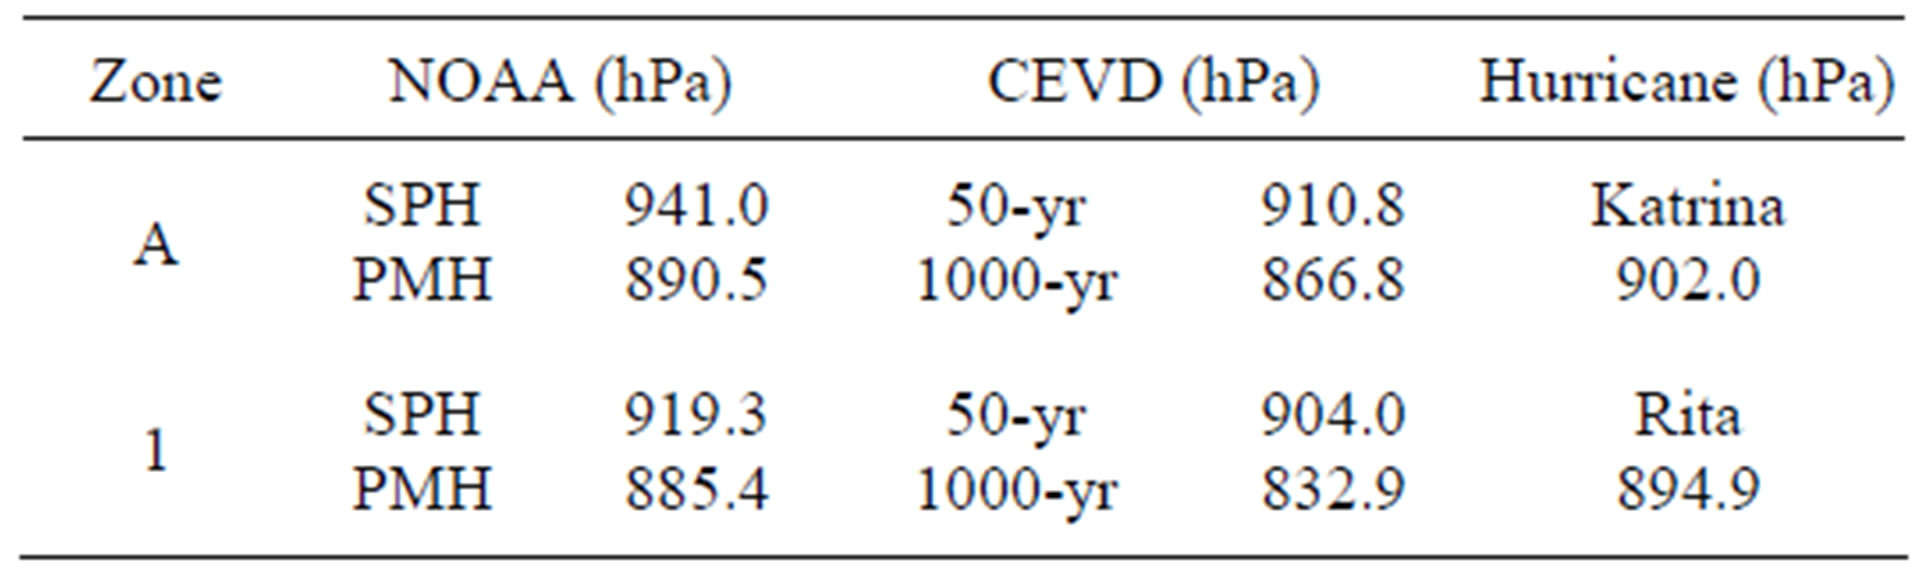
Table 1. Comparison between NOAA and CEVD.

Table 2. Comparison between MCEVD and other method.
CEVD and MCEVD (see next part) predicted and hindcast results are more reasonable than NOAA or other methods.
According to safety regulations for NPP in China, USA and IAEA [2-10]: DBF in coastal areas should be taken as combinations of spring tide, PMSS and simultaneous 100 years return period wave height.
The above definitions in safety regulation of coastal defenses against typhoon attacks for NPP are influenced by many uncertainty factors such as the differences in comprehensions and calculation methods of them.
The spring tide, maximum wave height and PMSS can be seen as non-Gaussian random variables with different correlation. The PMT and PMSS must involve the joint probability characters, and then DBF can be actually obtained by multivariate joint probability prediction. For example, the characteristics of PMT and PMSS in different sea area is related to annual occurring frequency of typhoon (λ), maximum central pressure difference (ΔP), radius of maximum wind speed (Rmax), moving speed of typhoon center (s), minimum distance between typhoon center and target site (δ), typhoon moving angle (θ) and typhoon duration (t). It means that different PMT and PMSS can be derived from different combinations of typhoon characteristics. For this reason, the characteristics of PMT and PMSS inevitably involve a selection of discrete distribution (λ) and multivariate continuous distribution of other typhoon characteristic factors (ΔP, Rmax, s, δ, θ, t), which can be described by Multivariate Compound Extreme Value Distribution (MCEVD) [23]. The calculation of PMT and PMSS by a numerical simulation method can remove the uncertainties of typhoon characteristics and may be led to different results, while the PMSS obtained on basis of them may has some arbitrary and cause wrong decision making. The lesson from 2005 hurricane Katrina showed that unreasonable calculation of the Probable Maximum Hurricane (PMH) and Standard Project Hurricane (SPH) is one of the most important reasons of New Orleans catastrophe [2,17,19].
According to IAEA and China safety regulations, PMSS should be obtained based on PMT. So aiming at PMT with different combinations of typhoon characteristics, some sensitive factors should be selected as control factors and substituted into procedure of Global Uncertainty Analysis (GUA) and Global Sensitivity Analysis (GSA) [34]. The PMSS corresponding to PMT of different sea areas can be derived by repeated forward-feedback calculations.
Based on MCEVD (analytical solution and stochastic simulation), Multi-Objective Nested Probability Model (MONPM) can be established for long term probability prediction of typhoon characteristics and corresponding disaster factors.
As shown in Figure 2, GUA and GSA are introduced into DLNMPM. In the model, typhoon characteristics in the first layer need to be varied repeatedly, and then their sensitivities to storm surge can be calculated. The PMSS corresponding to PMT of different typhoon characteristic combinations in certain sea area can be calculated by numerical simulation of repeated forward-feedback calculations of GUA, GSA in input-output procedure. The most sensitivity combination of typhoon characteristics and their induced storm surge can be selected as PMT and PMSS. PMSS with corresponding spring tide and 100 years return period wave height with joint return period calculated by MCEVD will be determined the probabilistic definition of DBF. This model also can be used for dominated by wave case. The ALARP(As Low As Reasonable Practice) [35] can be used to estimate failure probability of NPP coastal defense infrastructures against extreme external hazards.
5. Joint Probability Safety Assessment for DYW-NPP Defense Infrastructure in South China Sea Coast
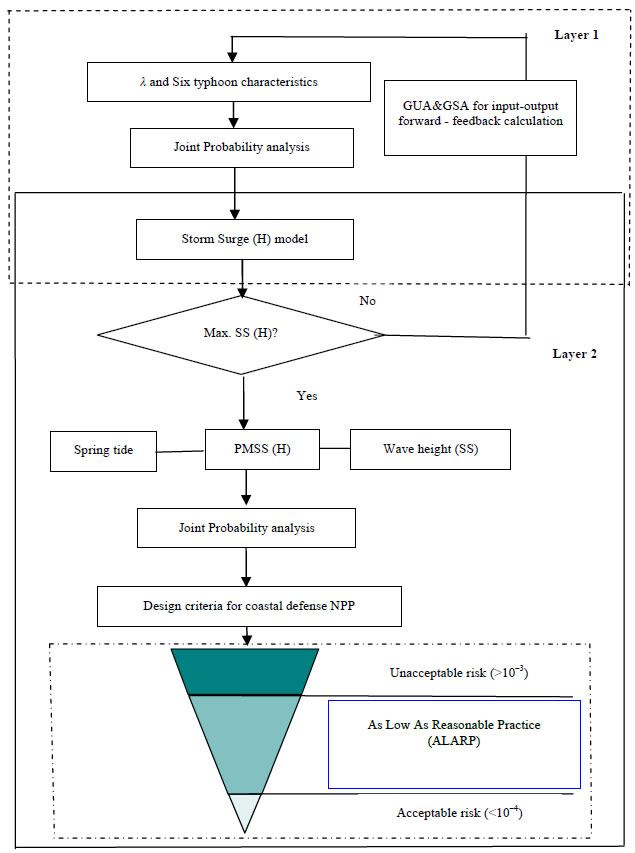
Figure 2. Application of MONPM with GUA, GSA to safety regulation calibration for NPP coastal defense infrastructures by ALARP.
China Sea, where the combined extreme external events are dominated by waves. The typhoon characteristics and design criteria of coastal engineering is listed in Tables 3 and 4.
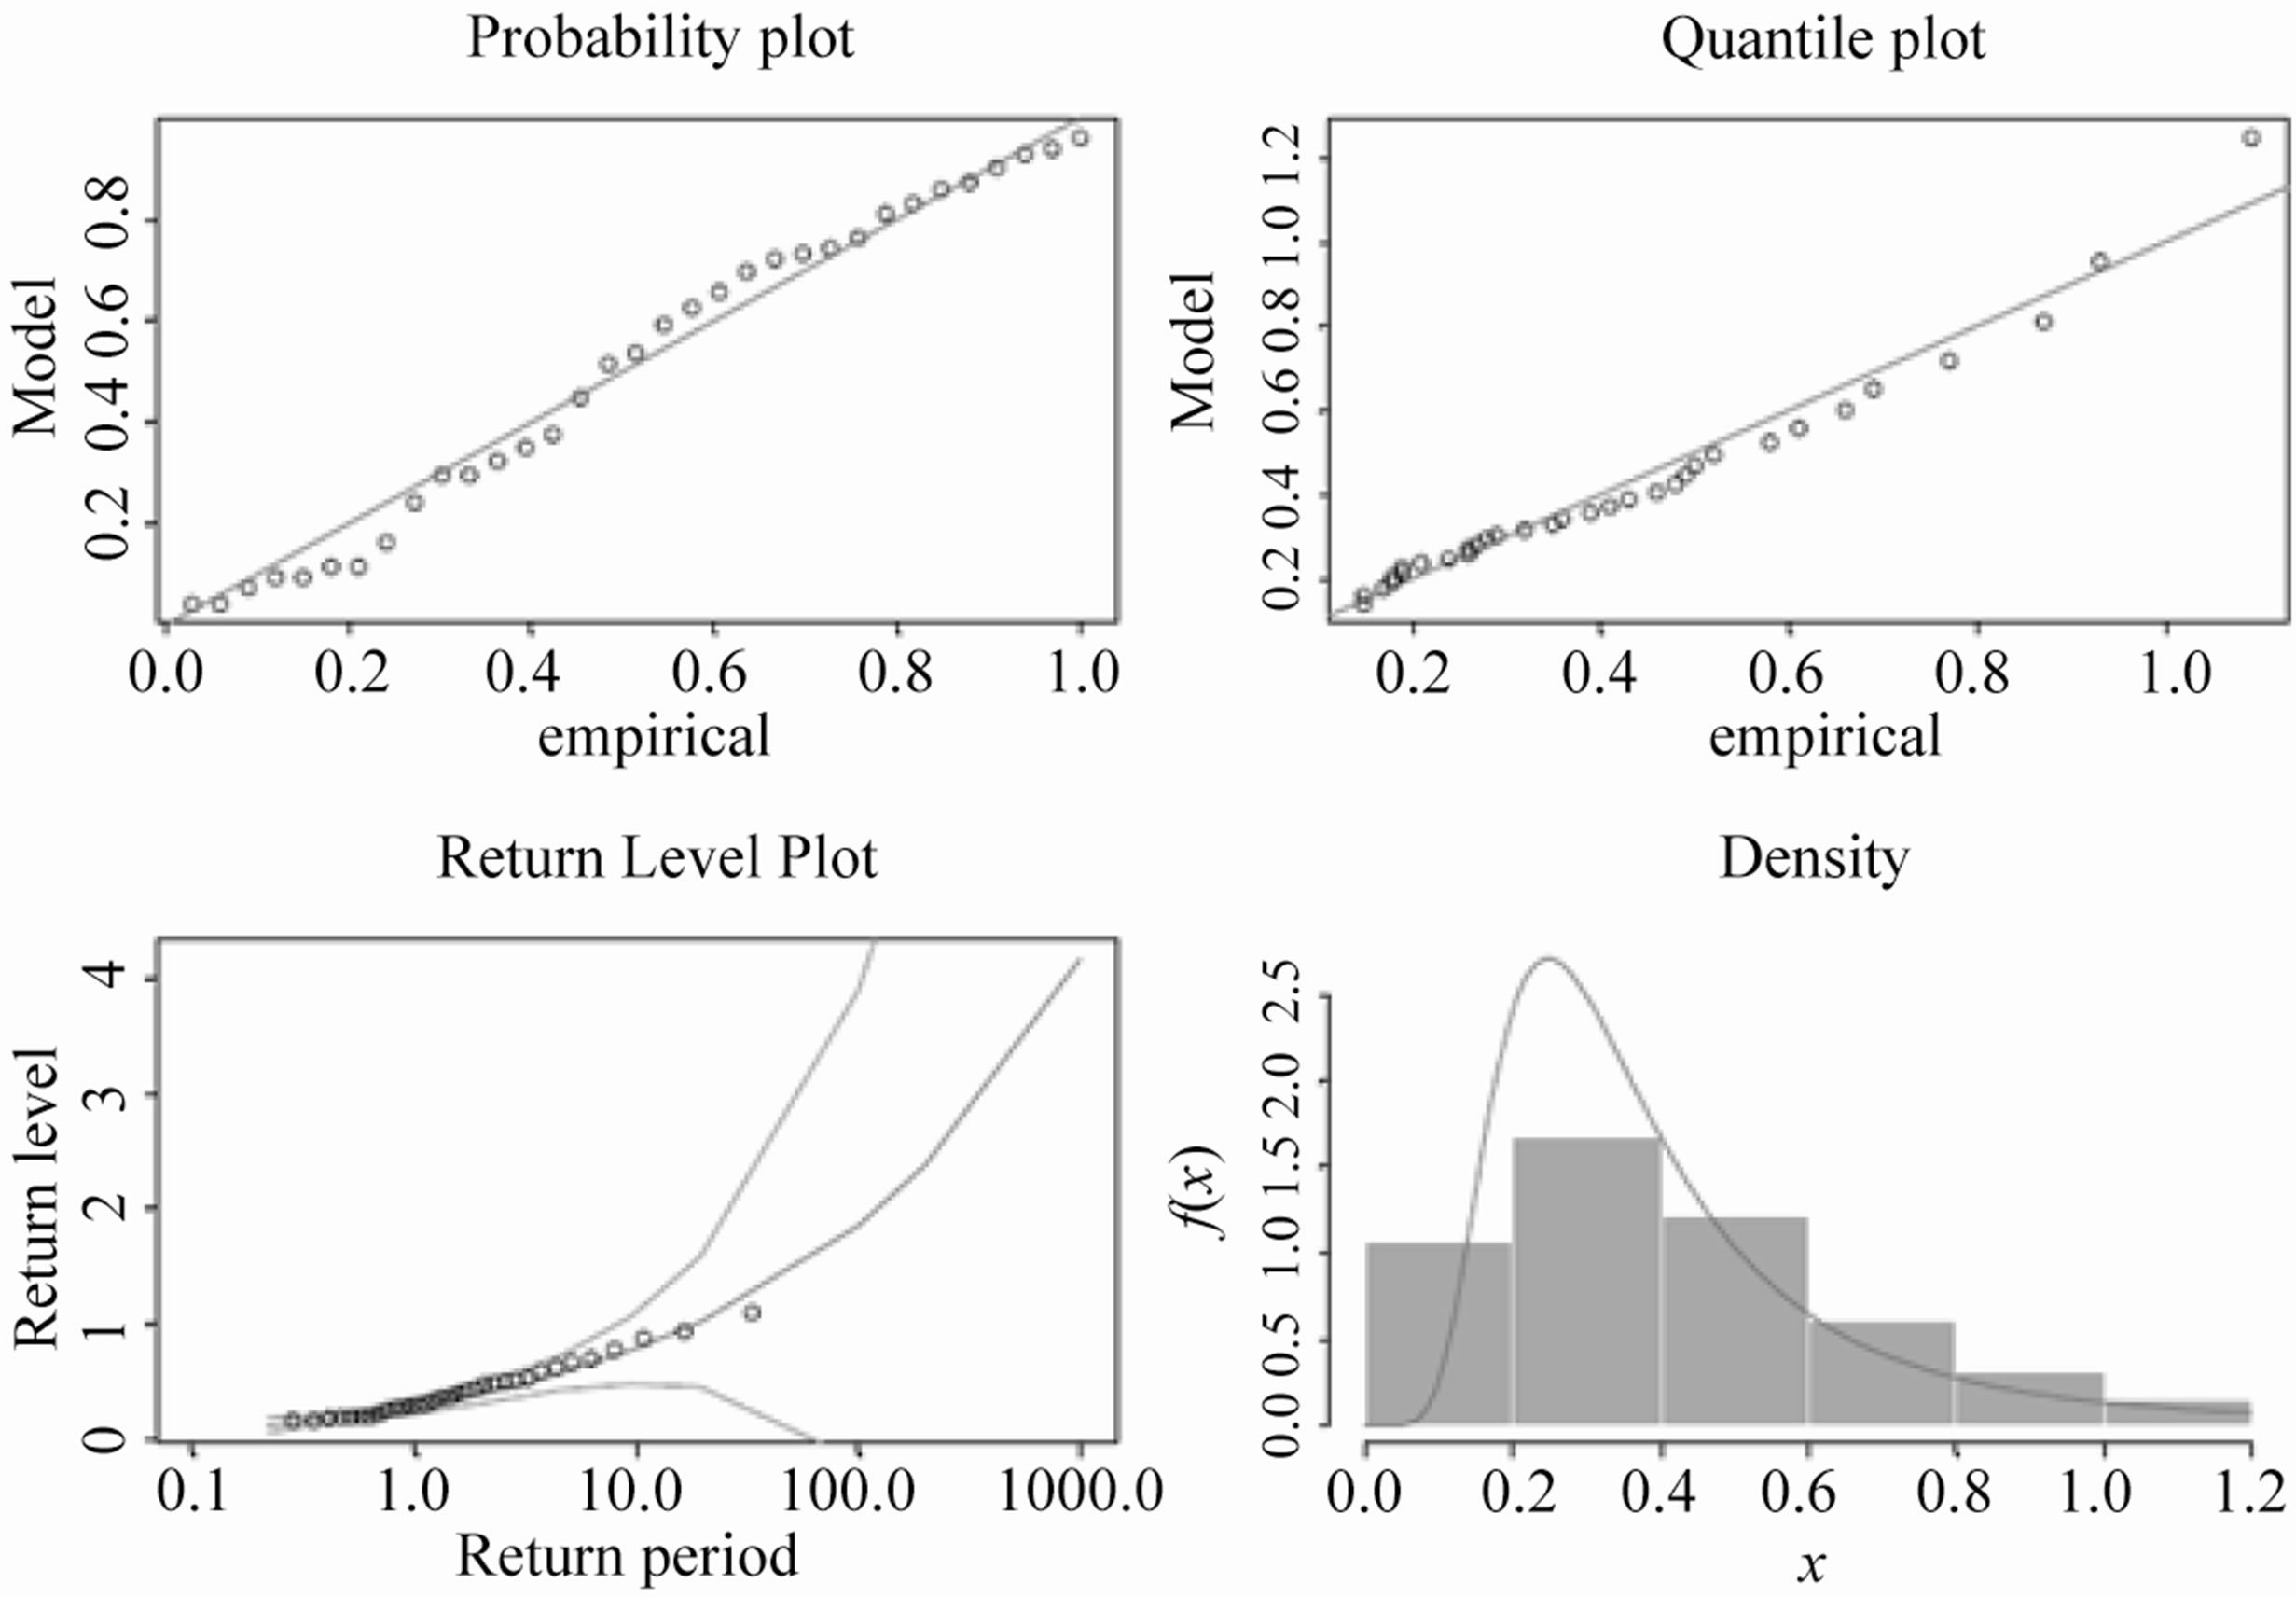
For discussion on joint return period of wave height with storm surge and corresponding spring tide, the PNLTCED can be used for analytical solution. Different combinations of typhoon characteristics in first layer of PNLCED (see Table 3) can be induced different combinations of storm surge and waves. The diagnostic checks of spring tide, surge and wave in Figures 3(a)-(c) show that PNLTCED is applicable model.
The Tables 4 and 5 show the present design criteria by China design code and by PNLTCED predicted extreme external events with different joint return period. The DYW NPP constructed breakwater is 14 - 16 m height which is lower than 1000 years return period combined extreme events.
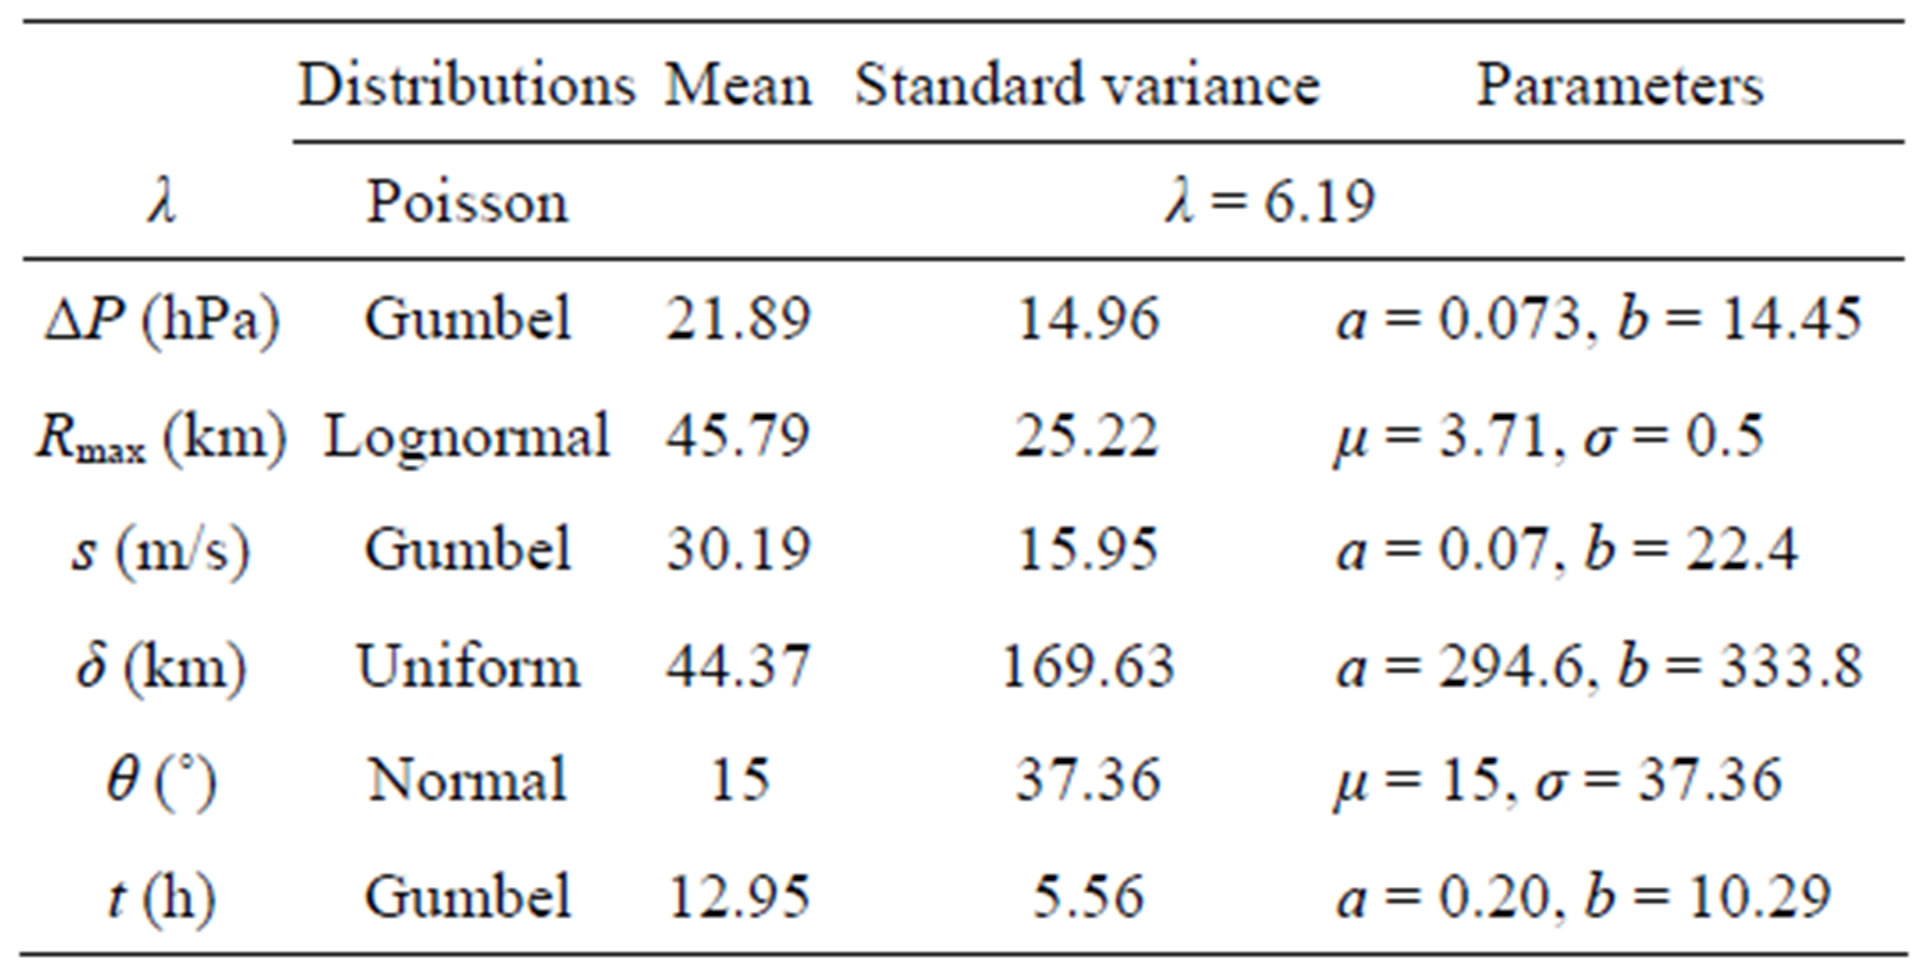
Table 3. Marginal distribution and parameters of typhoon characteristics.
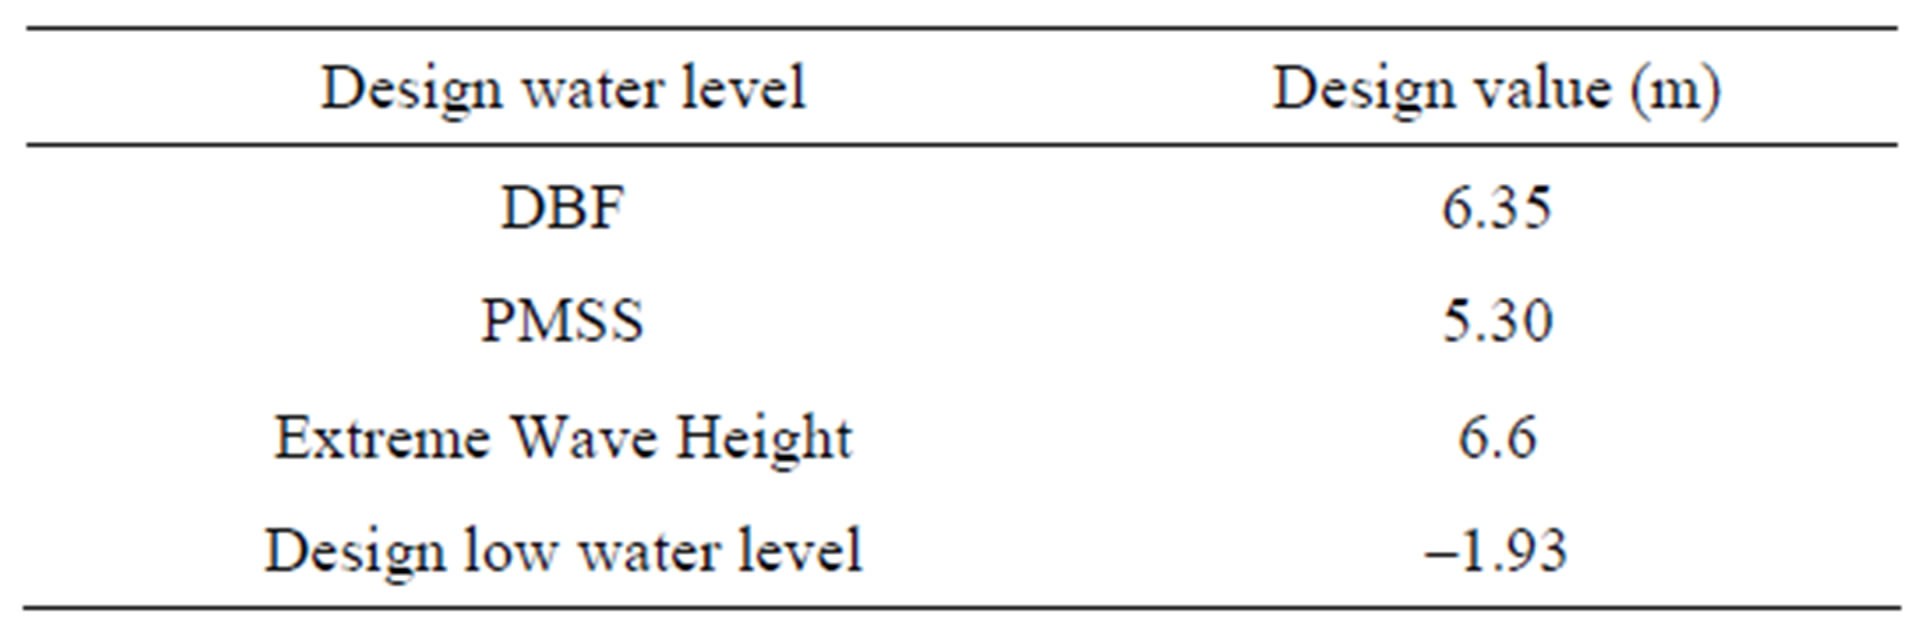
Table 4. Present design criteria for coastal defense of DYW nuclear power plant [36].
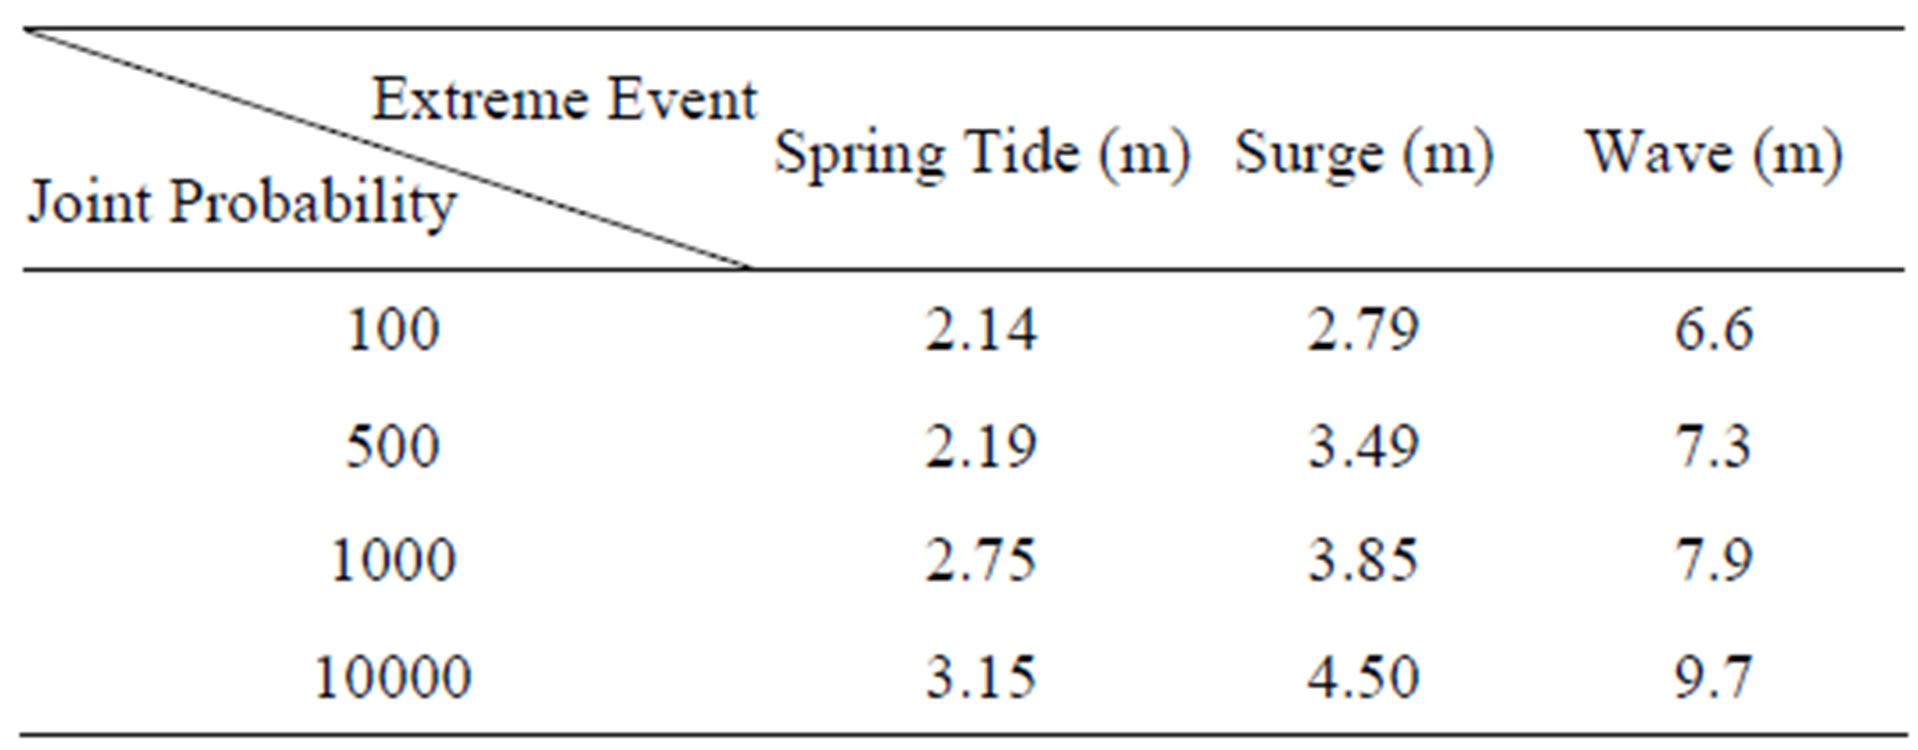
Table 5. Combined extreme external events with joint return period for DYW NPP by PNLTCED.
6. Joint Probability Safety Assessment for QS-NPP Defense Infrastructure in Qiantang River Estuarine Area, East China Sea
The combination of typhoon induced storm surge with the strongest spring tide in Qiantang river estuarine always lead to disasters. The observed maximum surge and spring tide more than 9 m. The QS NPP locates in south coast of estuarine Qiantang River and face to East China Sea where always occurred the severest spring tide in China.
The height of constructed breakwater is 9.76 m. So the joint probability safety assessment of combined extreme external events for coastal defense infrastructure dominated by spring tide should be taken into account.
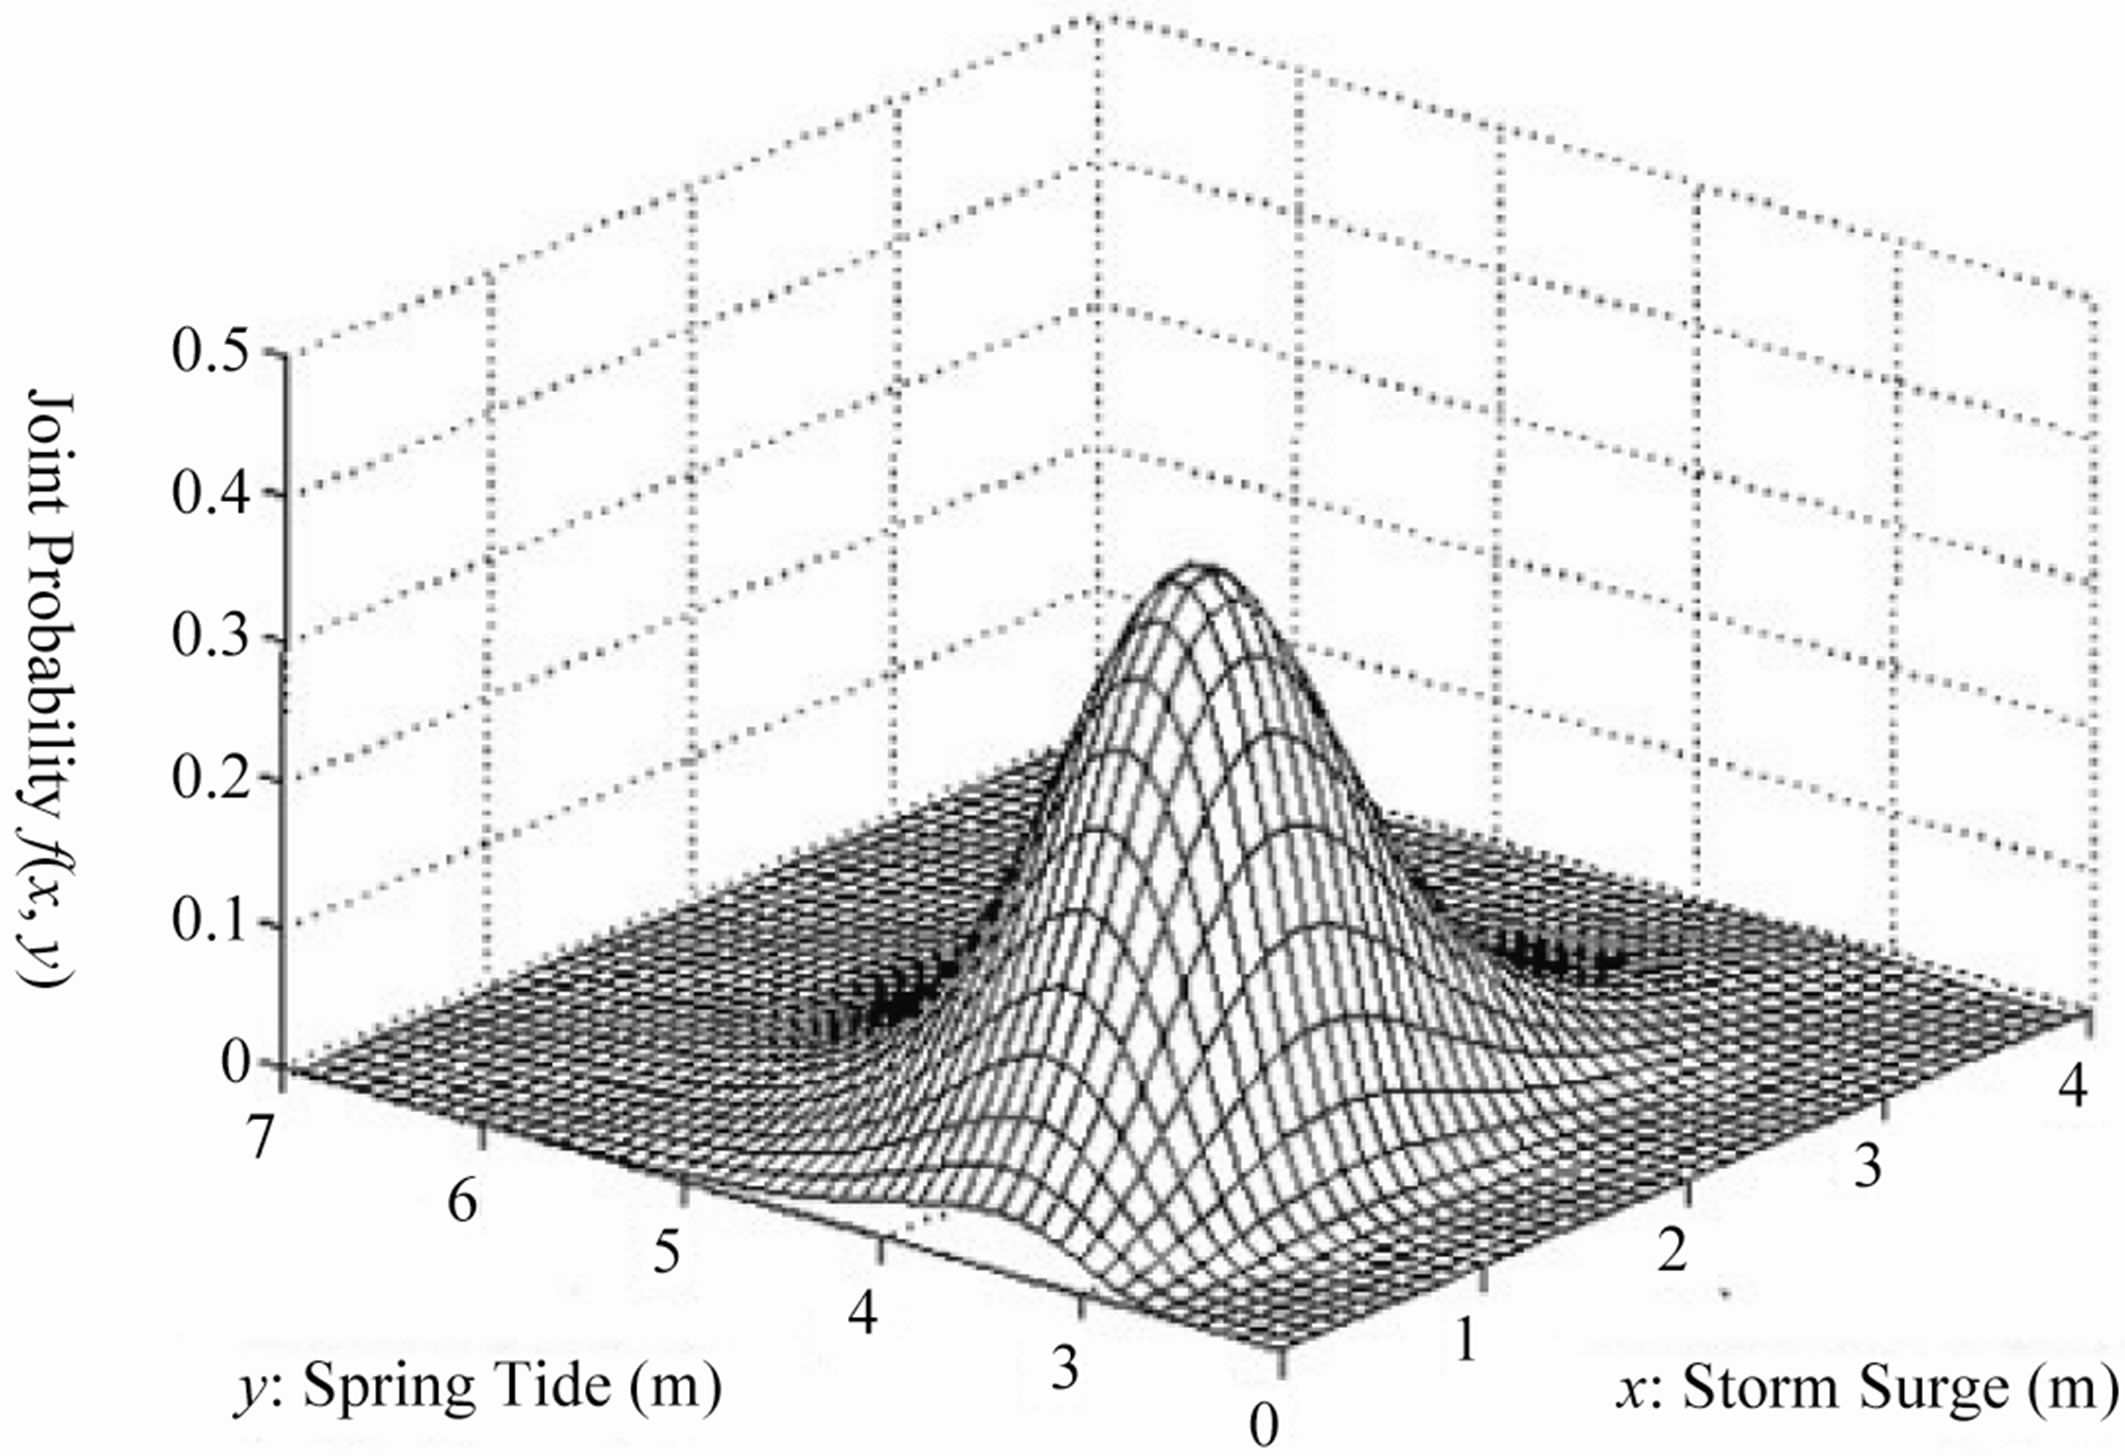
As the severest extreme external events for QS NPP are combined effect of spring tide and surge, two dimensional joint probability model can be used to calculate corresponding joint probability density function and cumulative distribution function (Figures 4(a) and (b)). Joint probability distribution of spring tide, storm surge and corresponding extreme wave with 1000 years joint return period much severe than present design criteria by [37], it can be seen in Table 6 and Figure 5.
For mentioned above joint probability safety assessment the spring tide is used as one of the random variables, because the statistical analysis shows that harmonic constituent and sea level vary from year to year. The maximum values, minimum values and some other values of amplitudes and mean sea level are chosen as the boundary conditions of numerical model. The calculated results show that the sea level caused by semi-diurnal tide of major lunar tidal constituent M2 and major solar tidal constituent S2 (see Table 7) [37].
Calculated mean value μ, variance σ and coefficient of variation Cov of the harmonic constituents and sea level are shown as follows:
For harmonic constituents:
 ;
; ;
; ;
;
For mean sea level:
 ;
; ;
; .
.
The resulting uncertainty for spring tide can be obtained as:
The confidence intervals of predicted joint return value
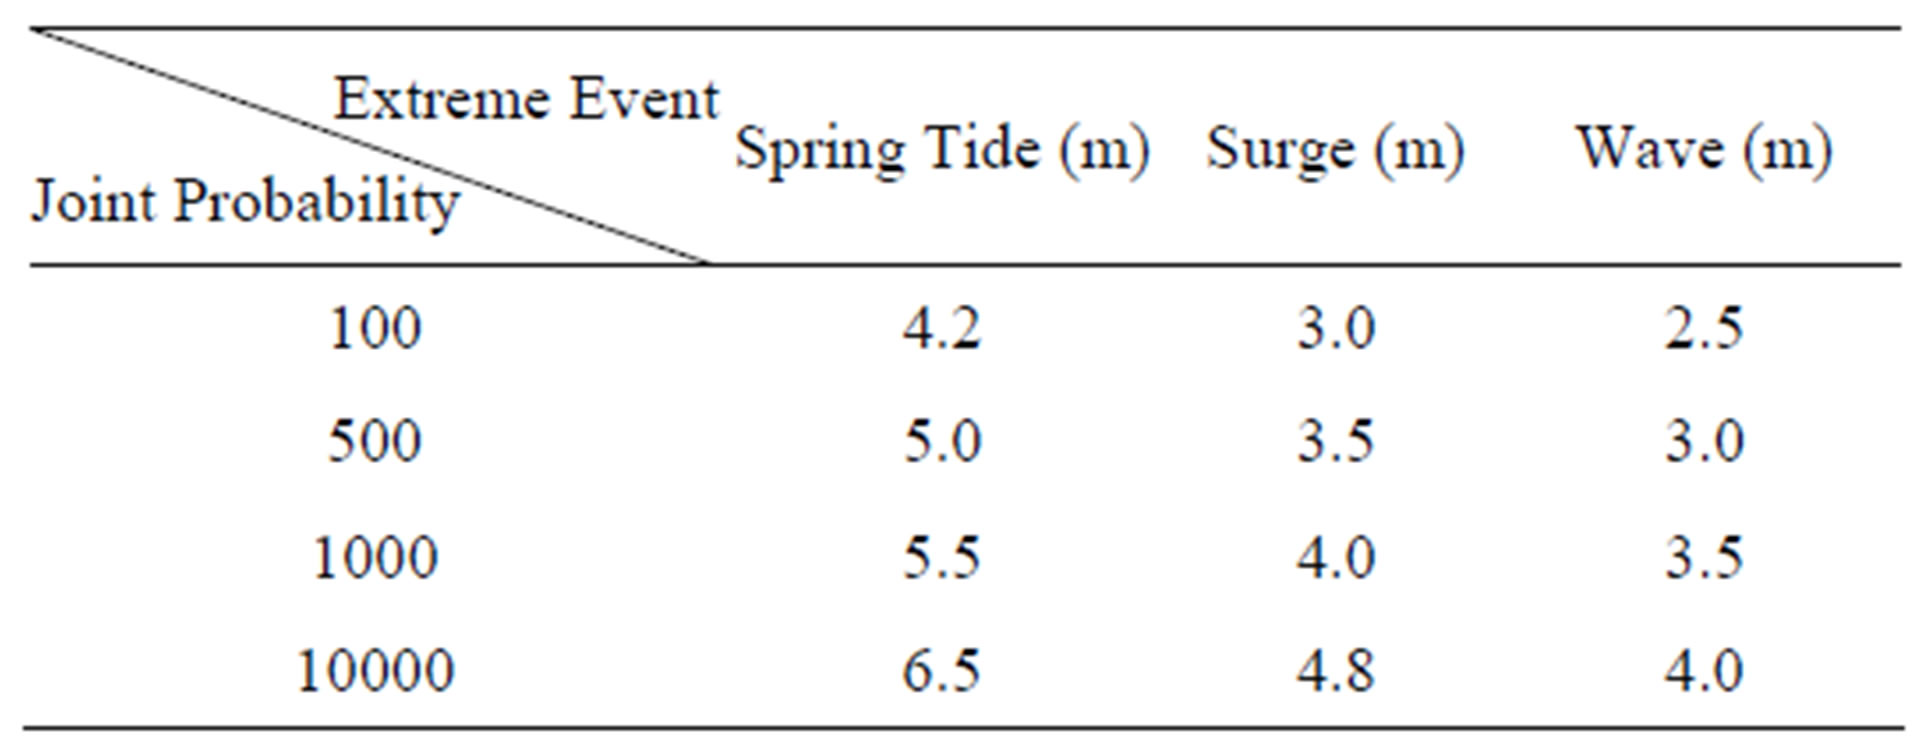
Table 6. Combined extreme external events with joint return period for QS NPP by PNLTCED.

Table 7. Calculated spring tide from different inputs.
 (a)
(a)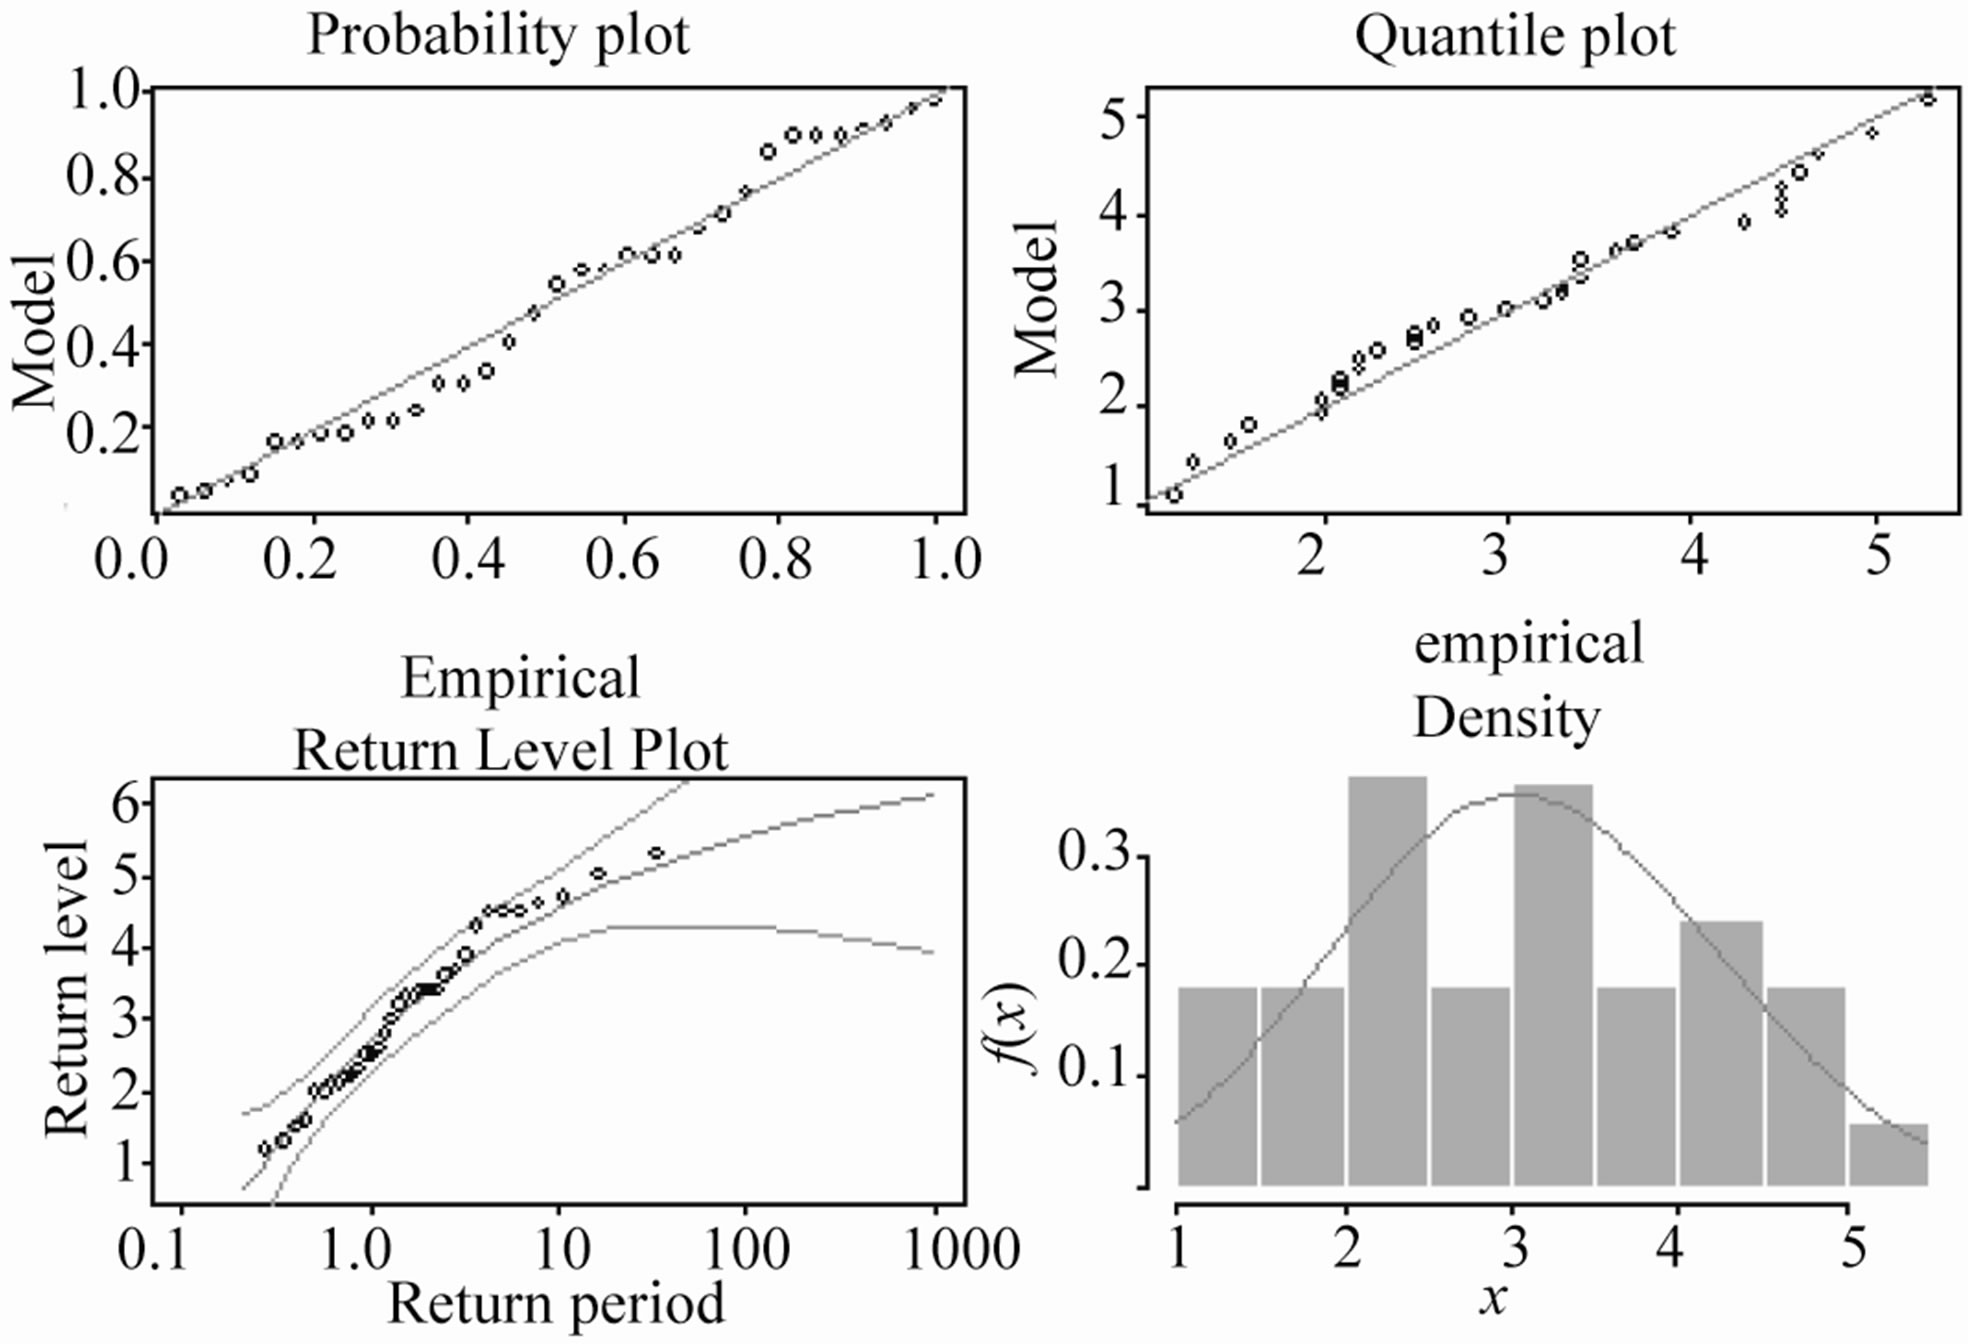 (b)
(b)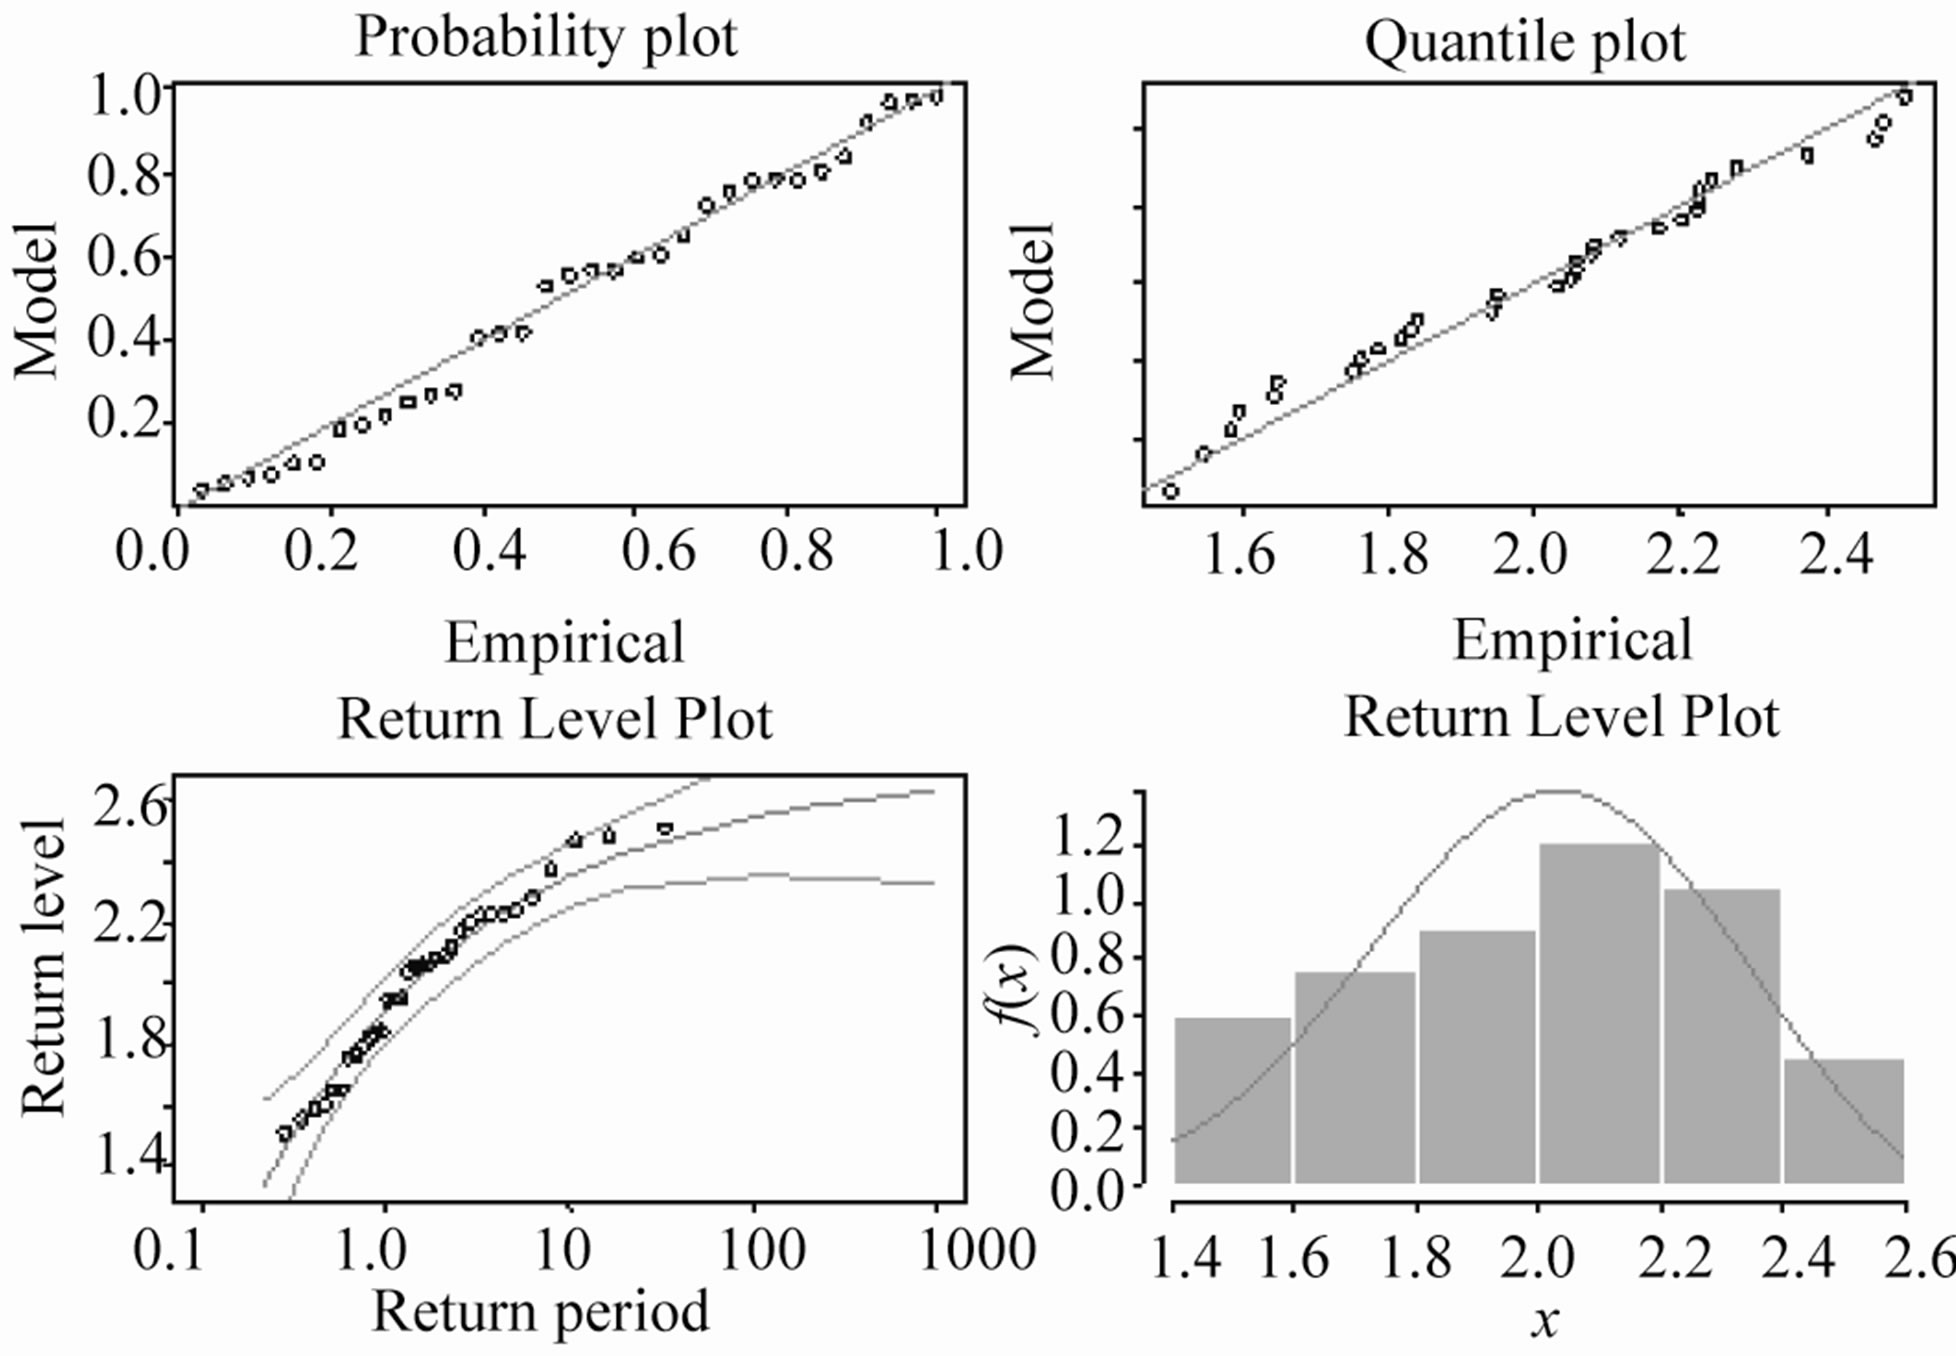 (c)
(c)
Figure 3. (a) Distribution diagnostic testing of storm surge; (b) Distribution diagnostic testing of spring tide; (c) Distribution diagnostic testing of wave height.
are estimated by authors proposed formula as follows [38]:
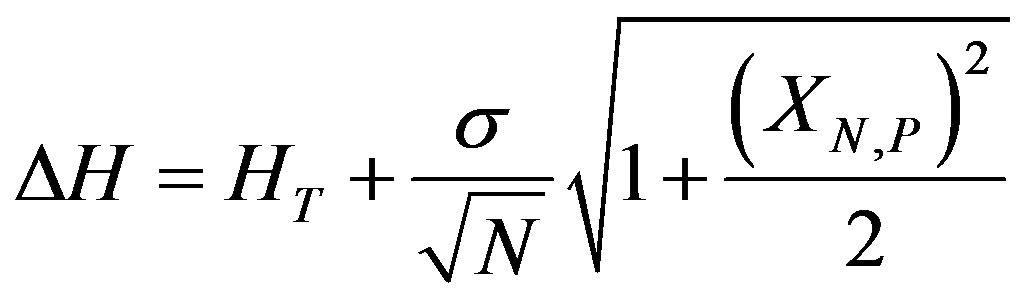 (14)
(14)
In formula
ΔH—confidence interval HT—design value with T years return period
σ—standard deviation N—total data number XN,P—coefficient dependent on data number N and probability P, it can be calculated by formula:
 (15)
(15)
The confidence intervals of predicted 500 years joint return spring tide can be calculated by mentioned above formulas as 1.7 m, the 500 years joint return value of spring tide, surge (5.0 + 1.7 + 3.5) = 10.2 m with corresponding wave height 3.0 m should be over constructed breakwater height 9.76 m. Joint probability safety assessment shows that constructed coastal defense infrastructure for QS NPP can not against 500 years return period extreme hazards.
7. Conclusions
Joint probability safety assessment for NPP coastal defense infrastructure against extreme external hazards shows that China and IAEA recommended safety regulations appear to have some vague definitions and different kinds of uncertainties. Both of two constructed NPP located along South China Sea and East China Sea where dominated external events are wave and spring tide, and
 (a)
(a)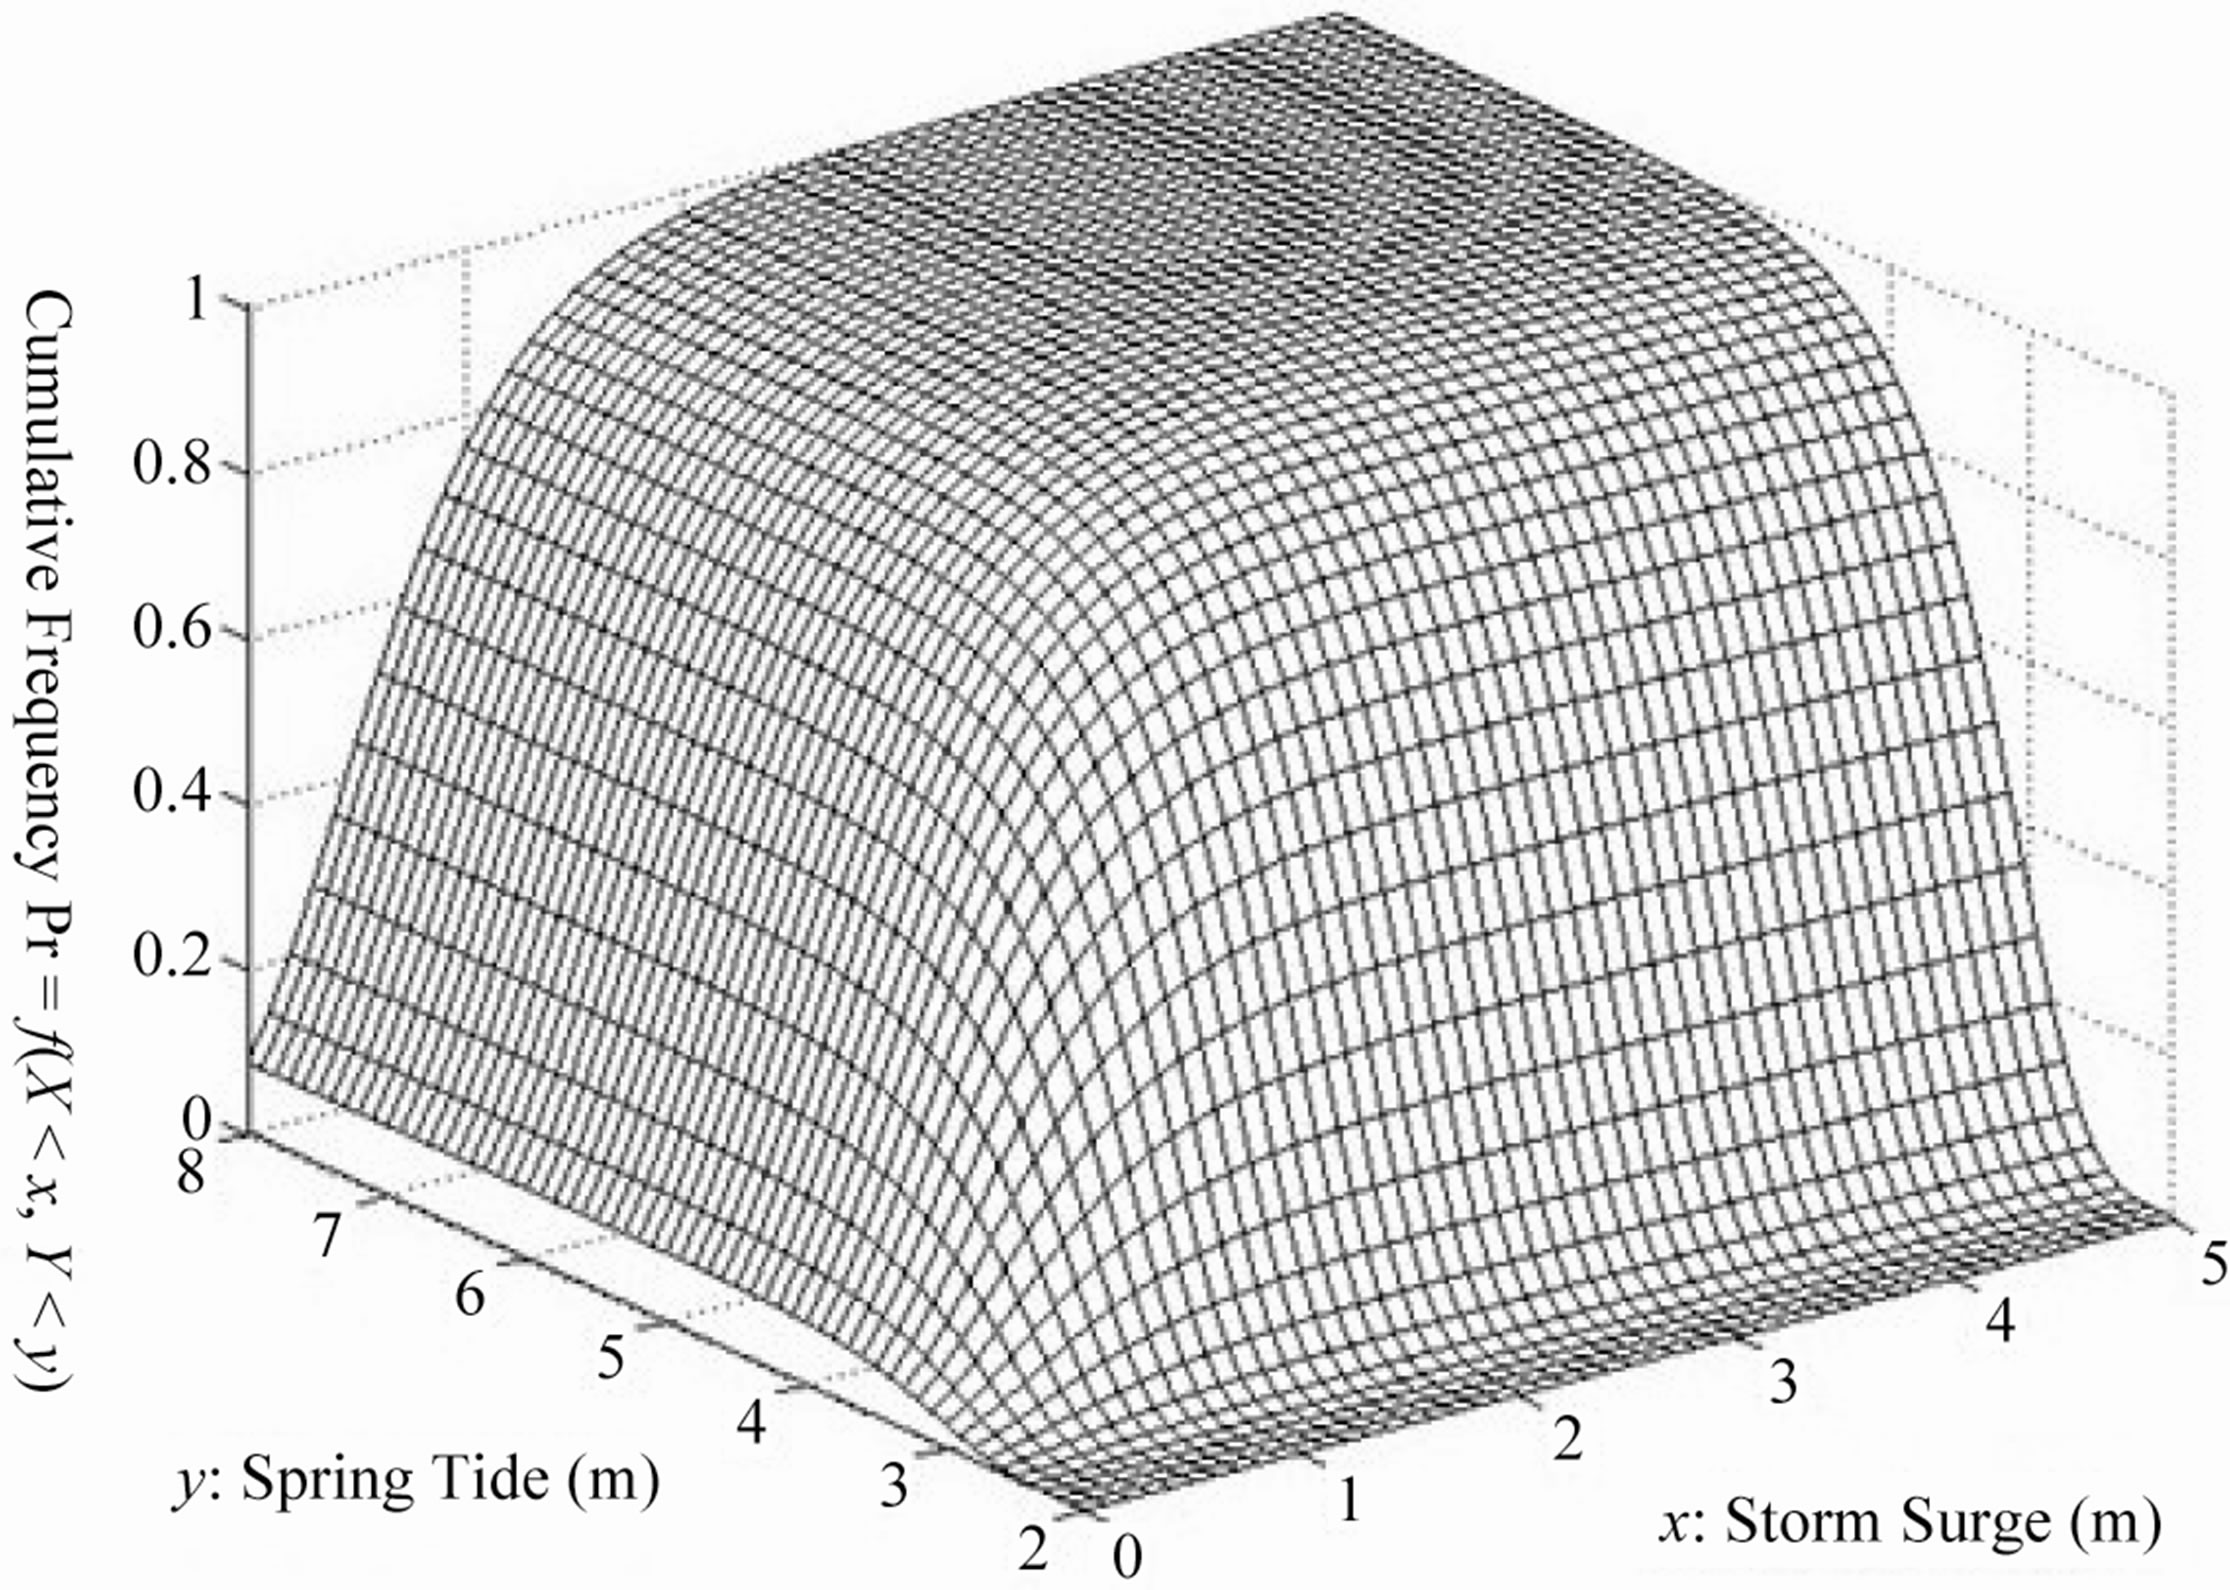 (b)
(b)
Figure 4. (a) Probability density distribution of spring tide and storm surge; (b) Cumulative probability distribution of spring tide and storm surge.
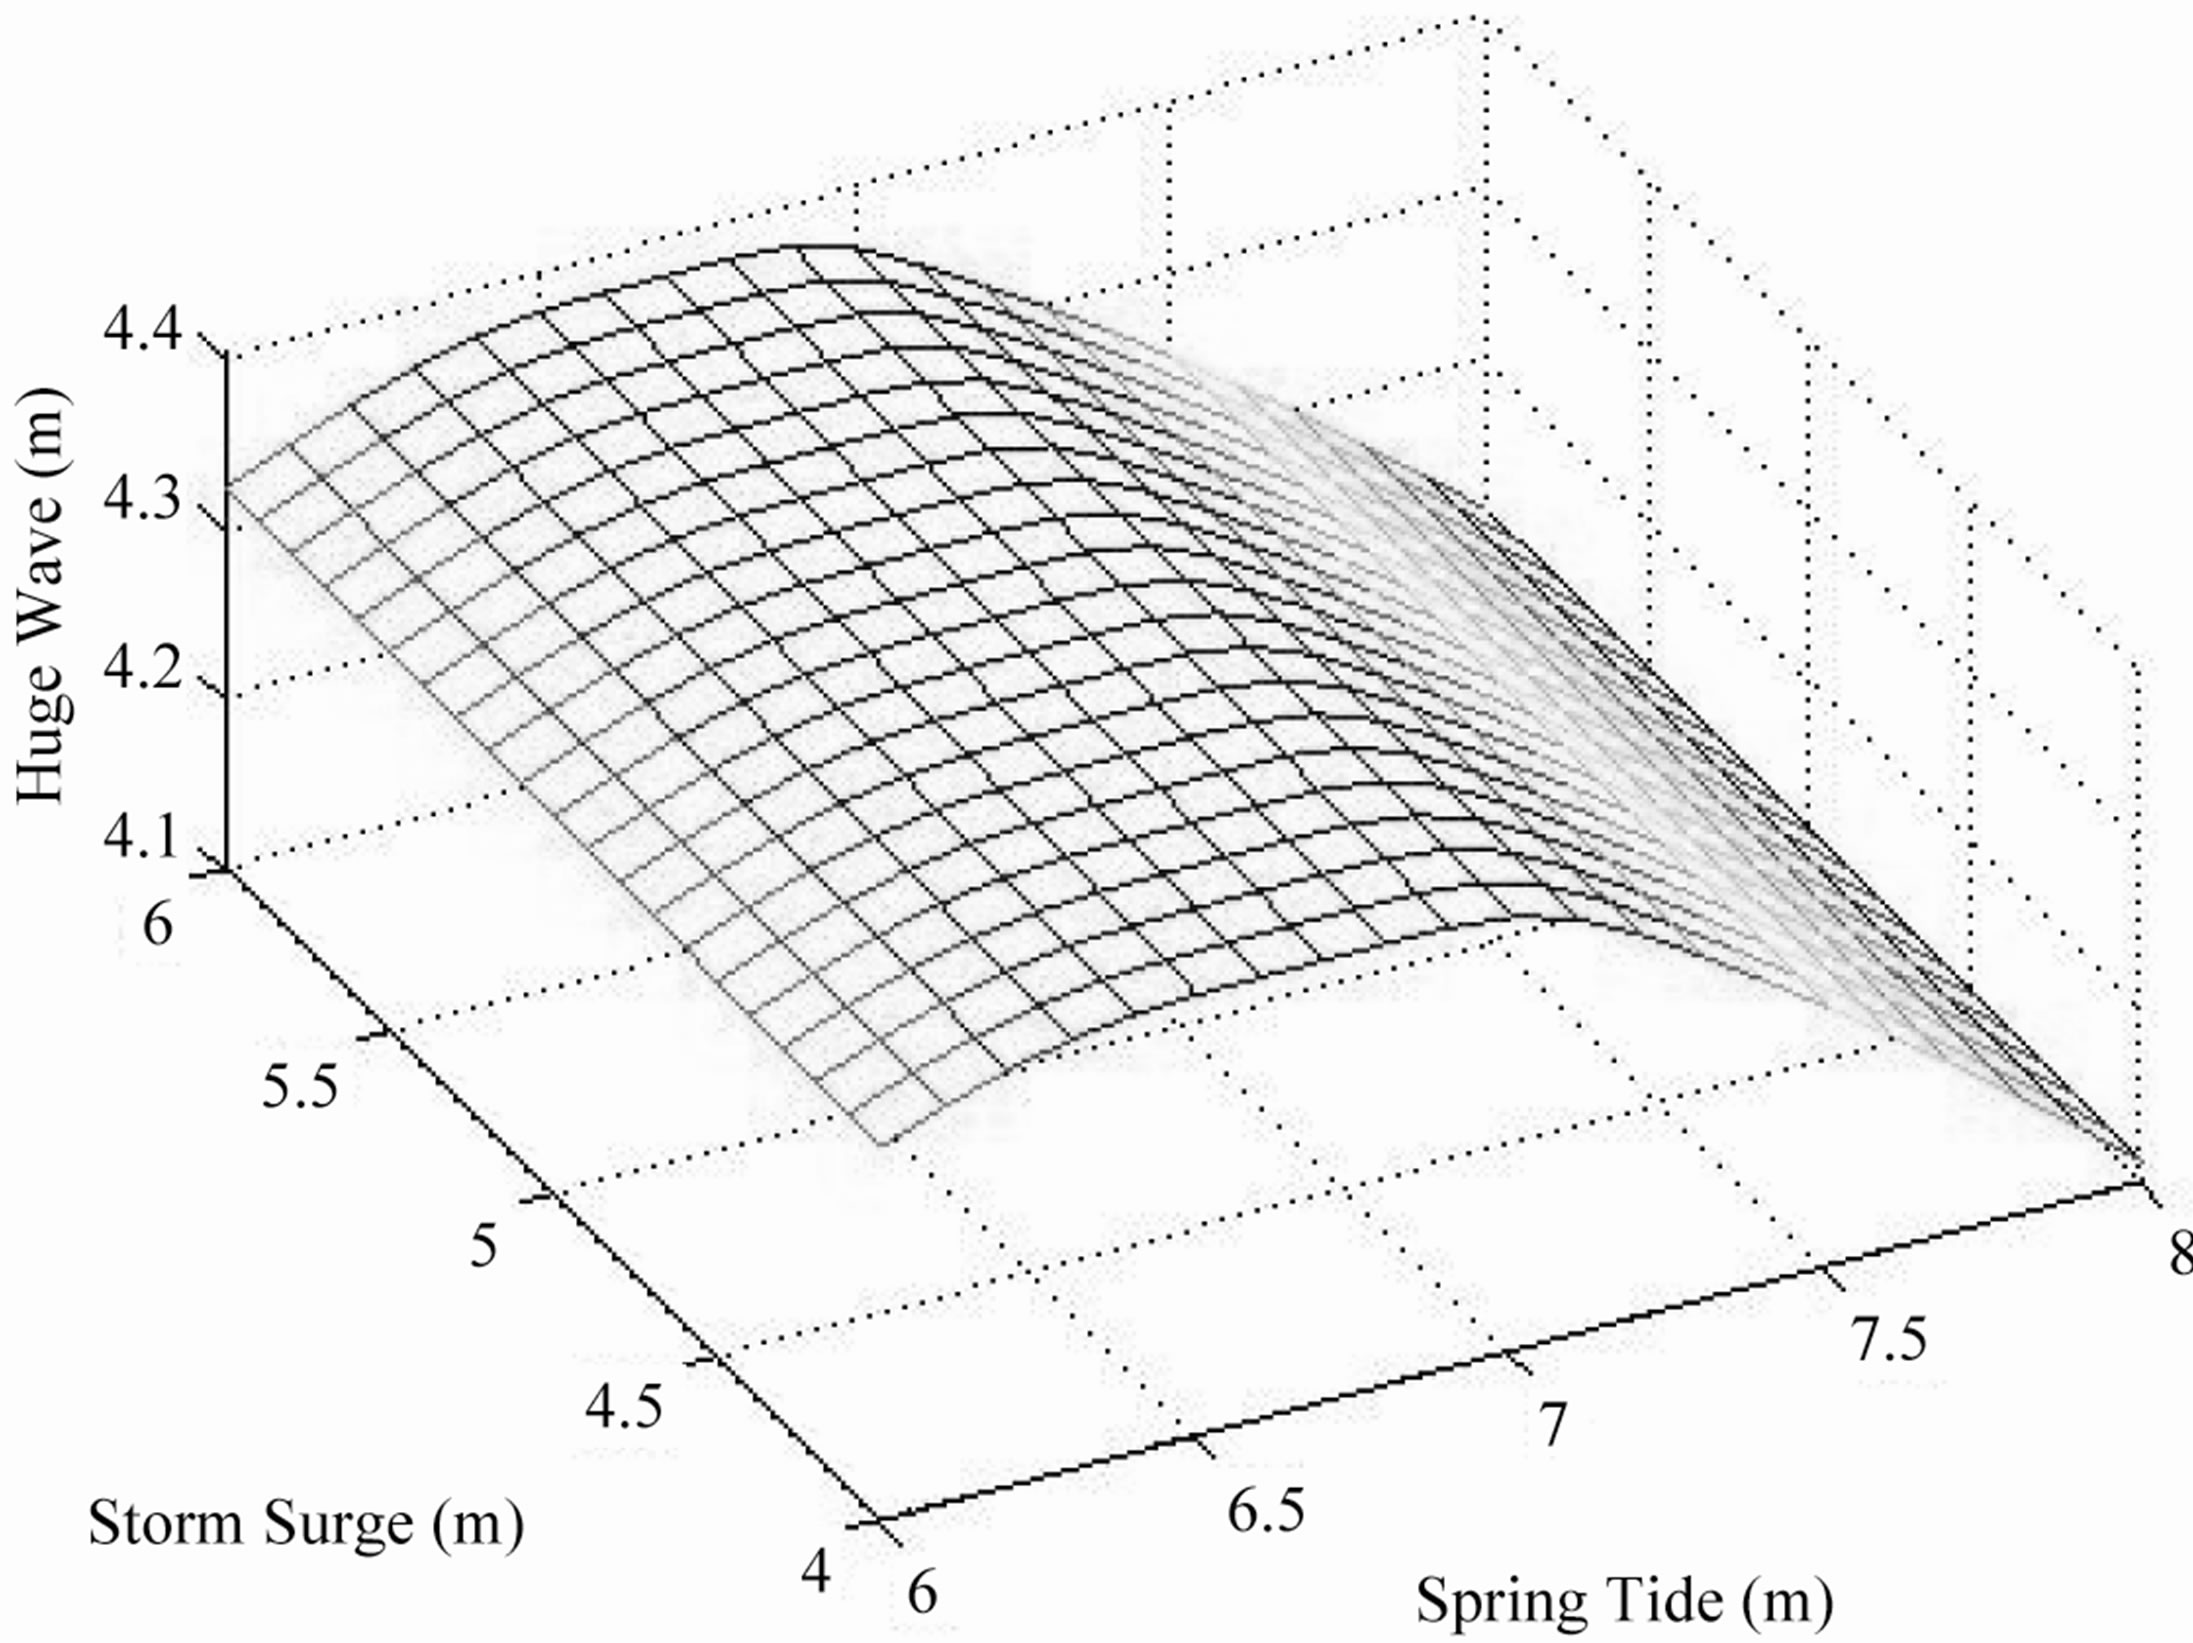
Figure 5. Joint probability distribution of spring tide, storm surge and extreme wave with 1000 years joint return period.
the China and IAEA recommended safety regulation are much lower than 1000 years return period typhoon induced sea hazards predicted by DLNMPM, that means by ALARP principle [39] the risk level of mentioned above two NPP constructed coastal defense infrastructures is unacceptable (Figure 2).
Face up to the frequently occurrence of typhoon hazards and disasters with 1000 years and higher return periods in the world during the past few years, we have to worry about consequence of typhoon disasters for nuclear power plant.
8. Acknowledgements
This work is supported by the National Natural Foundation of China (No. 5101000).
REFERENCES
- Y. Liu, A. Santos, et al., “Tsunami Hazards along Chinese Coast from Potential Earthquakes in South China Sea,” Physics of the Earth and Planetary Interiors, Vol. 163, No. 1-4, 2007, pp. 233-244.
- National Nuclear Safety Administration of China, “Determination of Design Basis Flood Level on Coastal Nuclear Power Plant Site,” HAD101/09, 1990.
- National Nuclear Safety Administration of China, “Design Tropical Cyclone for Nuclear Power Plant,” HAD- 101/11, 1991.
- National Nuclear Safety Administration of China, “Extreme Meteorological Condition for Selection of Nuclear Power Plant Site,” HAD101/10, 1991.
- National Nuclear Safety Administration of China, “Regulations for Selection of Nuclear Power Plant Site,” HAF- 101, 1991.
- IAEA, “Extreme External Events in the Design or Assessment of Nuclear Power Plants,” TECDOC-1341, Vienna, 2003.
- IAEA, “Flood Hazard for Nuclear Power Plants on Coastal and River Sites,” Safety Standards Series No. NSG-3.5, 2003.
- IAEA, “Advanced Nuclear Plant Design Options to Cope with External Events,” 2006.
- IAEA, “Criteria for Use in Preparedness and Response for a Nuclear or Radiological Emergency, General Safety Guide,” Safety Standards Series No. GSG-2, 2011.
- NRC, “Design-Basis Flood Estimation for Site Chracterization at NPP in the United States of America,” 2011.
- D. F. Liu, L. P. Wang, et al., “Theory of Multivariate Compound Extreme Value Distribution and Its Application to Extreme Sea State Prediction,” Chinese Science Bulletin, Vol. 51, No. 23, 2006, pp. 2926-2930. doi:10.1007/s11434-006-2186-x
- D. F. Liu, L. Pang, et al., “Typhoon Disaster in China: Prediction, Prevention and Mitigation,” Natural Hazards, Vol. 49, No. 3, 2009, pp. 421-436. doi:10.1007/s11069-008-9262-2
- T. F. Liu and F. S. Ma, “Prediction of Extreme Wave Heights and Wind Velocities,” Journal of the Waterway Port Coastal and Ocean Division, Vol. 106, No. 4, 1980, pp. 469-479.
- T. F. Liu, “Long Term Distribution of Hurricane Characteristics,” Proceedings of Offshore Technology Conference, Houston, 3-6 May 1982, pp. 305-313.
- D. F. Liu, H. D. Shi, et al., “Disaster Prevention Design Criteria for the Estuarine Cities: New Orleans and Shanghai—The Lesson from Hurricane Katrina,” Acta Oceanologica Sinica, Vol. 25, No. 4, 2006, pp. 131-142.
- D. F. Liu, Y. Song, et al., “Combined Environmental Design Loads Criteria for Marine Structures,” Offshore Technology Conference, Houston, 6-9 May 2002, pp. 1-4.
- D. F. Liu, H. J. Li, et al., “Prediction of Extreme Significant Wave Height from Daily Maxima,” China Ocean Engineering, Vol. 15, No. 1, pp. 97-106.
- D. F. Liu, H. J. Li, G. L. Liu and F. Q. Wang, “Design Code Calibration of Offshore, Coastal and Hydraulic Energy Development Infrastructures,” World Science and Engineering Academy Society (WSEAS) International Journal Energy and Environment, Vol. 5, No. 6, 2011, pp. 733-747.
- L. Pang, D. F. Liu, et al., “Improved Stochastic Simulation Technique and Its Application to the Multivariate Probability Analysis of Typhoon Disaster, Lisbon,” Proceedings of the 16th International Offshore and Polar Engineering Conference, Lisbon, 1-6 July 2007, pp. 1800- 1805.
- D. J. Shi and S. S. Zhou, “Moment Estimation for Multivariate Extreme Value Distribution in a Nested Logistic Model,” Annals of the Institute of Statistical Mathematics, Vol. 51, No. 2, 1999, pp. 253-264. doi:10.1023/A:1003854023902
- M. G. Naffa, A. M. Fanos and M. A. Elganainy, “Characteristics of Waves off the Mediterranean Coast of Egypt,” Journal of Coastal Research, Vol. 7, No. 3, 1991, pp. 665-676.
- M. C. Ochi, “Stochastic Analysis and Probabilistic Prediction of Random Seas,” Advanced Hydro Science, Vol. 13, 1982, pp. 218-375.
- S. T. Quek and H. F. Cheong, “Prediction of Extreme 3-Sec. Gusts Accounting for Seasonal Effects,” Structural Safety, Vol. 11, No. 2, 1992, pp. 121-129. doi:10.1016/0167-4730(92)90004-7
- L. R. Muir and A. H. EL-Shaarawi, “On the Calculation of Extreme Wave Height: A Review,” Ocean Engineering, Vol. 13, No. 1, 1986, pp. 93-118. doi:10.1016/0029-8018(86)90006-5
- W. H. Kirby and M. E. Moss, “Summary of Flood-Frequency Analysis in the United States,” Journal of Hydrology, Vol. 96, No. 1-4, 1987, pp. 5-14. doi:10.1016/0022-1694(87)90139-9
- A. G. Chowdhury and P. Huang E., “Novel Full-Scale Wind-Structure Interaction Experimentation for Mitigating Hurricane Induced Coastal Disasters,” Far East Journal of Ocean Research, Vol. 2, 2009, pp. 1-27.
- R. W. Schwerdt, F. P. Ho and R. R. Wakins, “Meteorological Criteria for Standard Project Hurricane and Probable Maximum Hurricane Wind Fields, Gulf and East Coasts of the United States,” NOAA Technical Report NWS-23, 1979, pp. 309-316.
- R. Bea, “Reliability Assessment and Management Lessons from Hurricane Katrina,” ASME 2007 26th International Conference on Offshore Mechanics and Arctic Engineering, San Diego, 10-15 June 2007, pp. 467-478.
- D. T. Resio, et al., “White Paper on Estimation Hurricane Inundation Probabilities,” US Army Corps of Engineering Report, 2007, pp. 1-10.
- Army Corps of Engineers, “History of Lake Pontchartrain and Vicinity Hurricane Protection Project,” Report of US Government Accountability Office GAO-06-244T, 2005, pp. 1-4.
- S. Coles and E. Simiu, “Estimating Uncertainty in the Extreme Value Analysis of Data Generated by a Hurricane Simulation Model,” Journal of Engineering Mechanics, Vol. 129, No. 11, 2003, pp. 1288-1294. doi:10.1061/(ASCE)0733-9399(2003)129:11(1288)
- E. Casson and S. Coles, “Simulation and Extremenal Analysis of Hurricane Events,” Applied Statistics, Vol. 49, No. 2, 2000, pp. 227-245. doi:10.1111/1467-9876.00189
- P. N. Georgiou, A. G. Davenport and P. J. Vickery, “Design Wind Speeds in Regions Dominated by Tropical Cyclones,” Journal of Wind Engineering & Industrial Aerodynamics, Vol. 13, No. 1-3, 1983, pp. 139-152. doi:10.1016/0167-6105(83)90136-8
- S. Tarantola, N. Giglioli, N. J. Jesinghaus and A. Saltelli, “Can Global Sensitivity Analysis Steer the Implementation of Models for Environmental Assessments and Decision-Making?” Stochastic Environmental Research and Risk Assessment, Vol. 16, No. 1, 2002, pp. 63-76. doi:10.1007/s00477-001-0085-x
- S. L. Xie, “Design Criteria for Coastal Engineering Works for Nuclear Power Plant,” China Harbour Engineering, Vol. 1, 2000, pp. 6-9.
- L. M. Wang and J. L. Liu, “Research into PMSS of Coastal Nuclear Power Station,” Electric Power Survey, Vol. 2, 1999, pp. 49-53.
- D. F. Liu, G. L. Liu, H. J. Li and F. G. Wang, “Risk Assessment of Coastal Defense against Typhoon Attacks for Nuclear Power Plant in China,” Proceedings of ICAPP 2011, Nice, 2-5 May 2011, pp. 2484-2492.
- D. F. Liu and L. S. Kong, “Stochastic-Numerical Model of Tidal Current Field for Jiaozhou Bay of Yellow Sea,” Proceedings of the 7th International Offshore and Polar Engineering Conference, Stavanger, Vol. 3, 17-22 June 2001, pp. 682-686.
- D. N. Veritas, “Marine Risk Assessment, for the Health and Safety Executive,” Offshore Technology Report, 2001, p. 3.
NOTES
*Corresponding author.