International Journal of Organic Chemistry
Vol.3 No.4(2013), Article ID:41535,6 pages DOI:10.4236/ijoc.2013.34037
Synthesis of a Fluorophore with Improved Optical Brightness
1Chemistry Department, Doane College, Crete, USA
2Novel Chemical Solutions, Crete, USA
Email: andrea.holmes@doane.edu
Copyright © 2013 Macduff Okuom et al. This is an open access article distributed under the Creative Commons Attribution License, which permits unrestricted use, distribution, and reproduction in any medium, provided the original work is properly cited.
Received November 12, 2013; revised December 16, 2013; accepted December 25, 2013
Keywords: Optical Brightener; Fluorophore; Diaminostilbene; Cyanuric Chloride; Optical Brightness
ABSTRACT
The synthesis and characterization of a novel fluorophore(1), with potential application as an optical brightener are reported. This compound was prepared by reacting 4,4-diaminostilbene-2,2-disulfonic acid with cyanuric chloride in the presence of Na2CO3 followed by the addition of trityl aniline. Solution and solid state fluorescence demonstrated a strong blue/purple emission centered at 450 nm. 1H-NMR spectroscopy, mass spectrometry analysis, elemental analysis, and DOSY-NMR were used for the characterization of the fluorophore.
1. Introduction
Optical brighteners are chromophores that typically absorb UV light (340 - 370 nm) and emit blue light in the visible spectrum (420 - 470 nm). Optical brighteners are often derivatives of stilbene, biphenyl, naphthalene, anthracene and structurally related compounds [1]. Optical brighteners are used in cosmetics, detergents, and paints for changing the hue from yellow or grey to white [2,3]. This paper reports the synthesis of a new fluorophore that could have a potential application as an optical brightener.
The optical properties of these brighteners influence [2] the visual appearance and perception of skin imperfections, such as shadows, skin discolorations, wrinkles, and cellulite. Powders used to add pigment to colored cosmetics often employ optical brighteners exhibiting fluorescence in the solid state in addition to non-fluorescent additives. These additional components can be either organic or inorganic including iron oxides (yellow, red, brown, or black), ferric ammonium ferrocyanide (blue), manganese violet, ultramarine blue, chrome oxide (green), talc, lecithin modified talc, zeolite, kaolin, lecithin modified kaolin, titanium dioxide (white), and mixtures thereof [4,5]. Pearlants such as mica, bismuth, oxychloride and treated micas, such as titanated micas and lecithin modified micas, can also be used [4,5].
Desiring to create a new optical brightener with application in cosmetics, we synthesized compound 1 (Figure 1).
2. Materials and Methods
2.1. Synthesis of 1
1) A mixture of 25 mL of acetone and 20 g of ice were added to a 2-neck, 250 mL round bottom flask. 3.69 g of cyanuric chloride (2 equivalents) was added to the flask, and it was cooled to 0˚C using an ice bath. The pH of the solution was increased to 4.5 - 5.5 by the drop-wise addition of 10% Na2CO3 solution (2 equivalents). 50 mL of water and 2.12 g of Na2CO3 were added slowly to 3.7 g of 4,4-diaminostilbene 2,2-disulfonic acid. The stilbene solution was then mixed with the cyanuric chloride solution while maintaining a temperature between 0˚C and 5˚C. The solution was stirred for two hours at 0˚C - 5˚C. The resulting solution was filtered using a glass fritted filter and washed with ethyl acetate. The solid was dried under high vacuum overnight.
2) Diisopropylethylamine (DIPEA) (2.1 equivalents) was added to a 50 mL round bottom flask. THF, the intermediate from step 1, and 4-tritylaniline (2 equivalents)
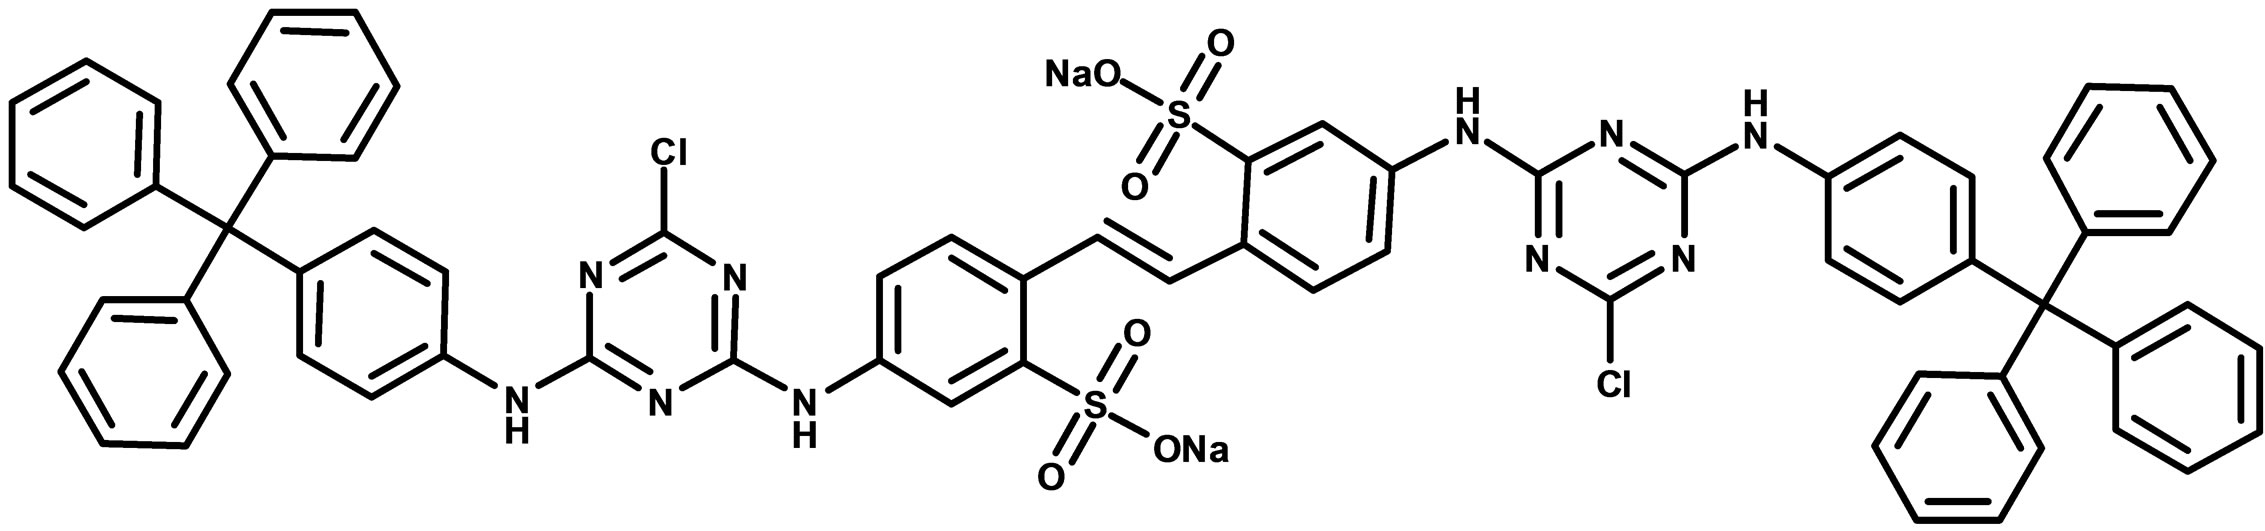
Figure 1. Chemical structure of bis-tritylaniline substituted compound with the IUPAC name bis-4,4-[6-Chloro-N-(4-tritylphenyl)-[1,3,5]triazine-2,4-diamine]-[2,2-disulfonic acid]-stilbene (1).
were added to the flask. The mixture was then refluxed overnight and filtered while still hot using a glass fritted filter. The product was washed with acetone and water, and then dried overnight.
2.2. Characterization of 1
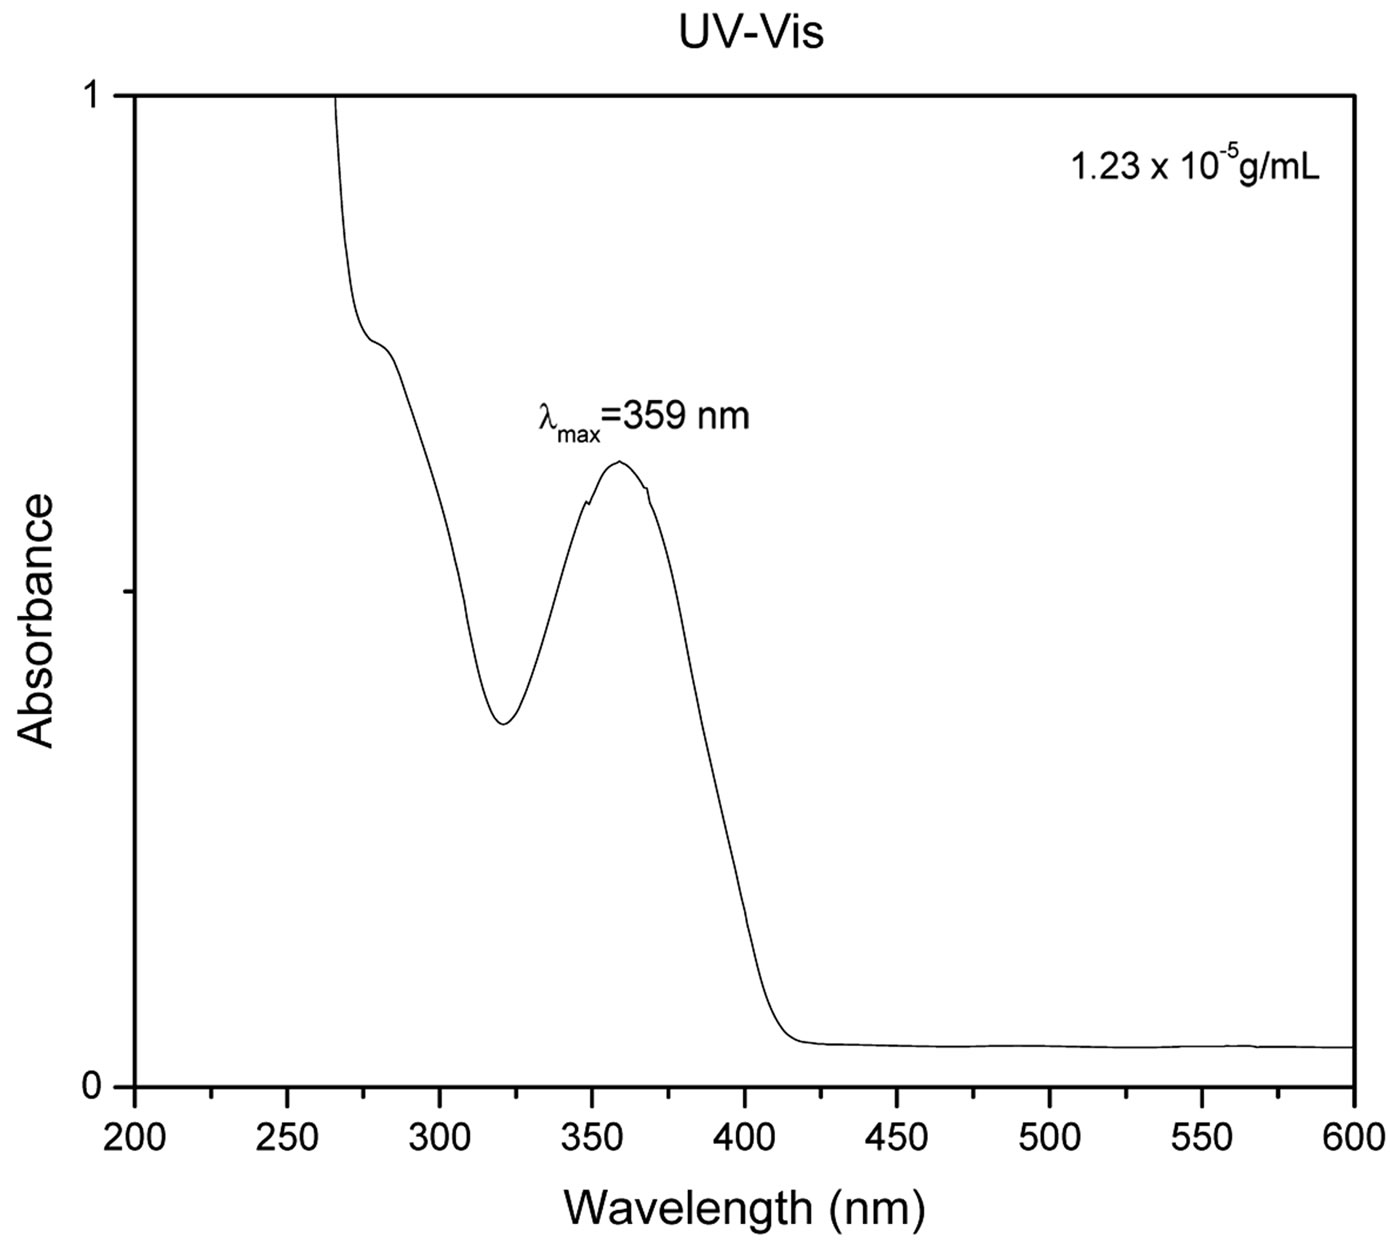
For UV-Vis spectroscopy, 0.01 g of 1 was dissolved in 3 mL DMSO and diluted to 1.23 × 10⁻⁵ g/mL. UV-Vis measurements were performed on a Varian Cary 50 Bio UV-Visible Spectrometer and absorbance data was collected from 200 nm - 800 nm wavelengths. For fluorescence spectrometry, 0.01 g of 1 was dissolved in 3 mL of DMSO and diluted to a concentration of 1.23 × 10⁻⁶ g/mL. Fluorescence measurements were performed on a Shimadzu RF-5301PC Fluorescence Spectrometer. The maximum absorption wavelength from the UV-Vis data was found to be 359 nm and was used as the excitation wavelength for the fluorescence spectroscopy experiments. Emission fluorescence data was collected from 400 nm - 600 nm. The excitation and emission slit widths were both set to 3 mm. Solid state fluorescence of 1 was collected using a custom made fiber optic probe (Prizmatix Ltd., ModiinIlite, Israel). The excitation wavelength used in both solid state and solution fluorescence was 359 nm with excitation and emission slit width of 5 mm and data collected from 400 - 600 nm. NMR data was collected using a Bruker Avance III 400 MHz NMR Spectrometer. The NMR solvent used for the intermediate and the final product was deuterated DMSO. DOSY experiments were performed using a two-dimensional stimulated echo pulse sequence with bipolar gradient pulses for diffusion. MALDI mass spectra were obtained from the University of Nebraska-Lincoln using positive mode and α-cyano-4-hydroxycinnamic matrix. Elemental analysis data was obtained from Micro-Analysis INC.
3. Results and Discussion
Our synthetic approach was based on previously reported schemes for polydentate ligands prepared in high yield by chloride substitution of 2,4,6-trichloro-1,3,5-triazine (cyanuric chloride) [6]. The synthesis of 1 (Scheme 1) proceeded at 0˚C by the reaction of cyanuric chloride with diaminostilbene for two hours. After filtration and
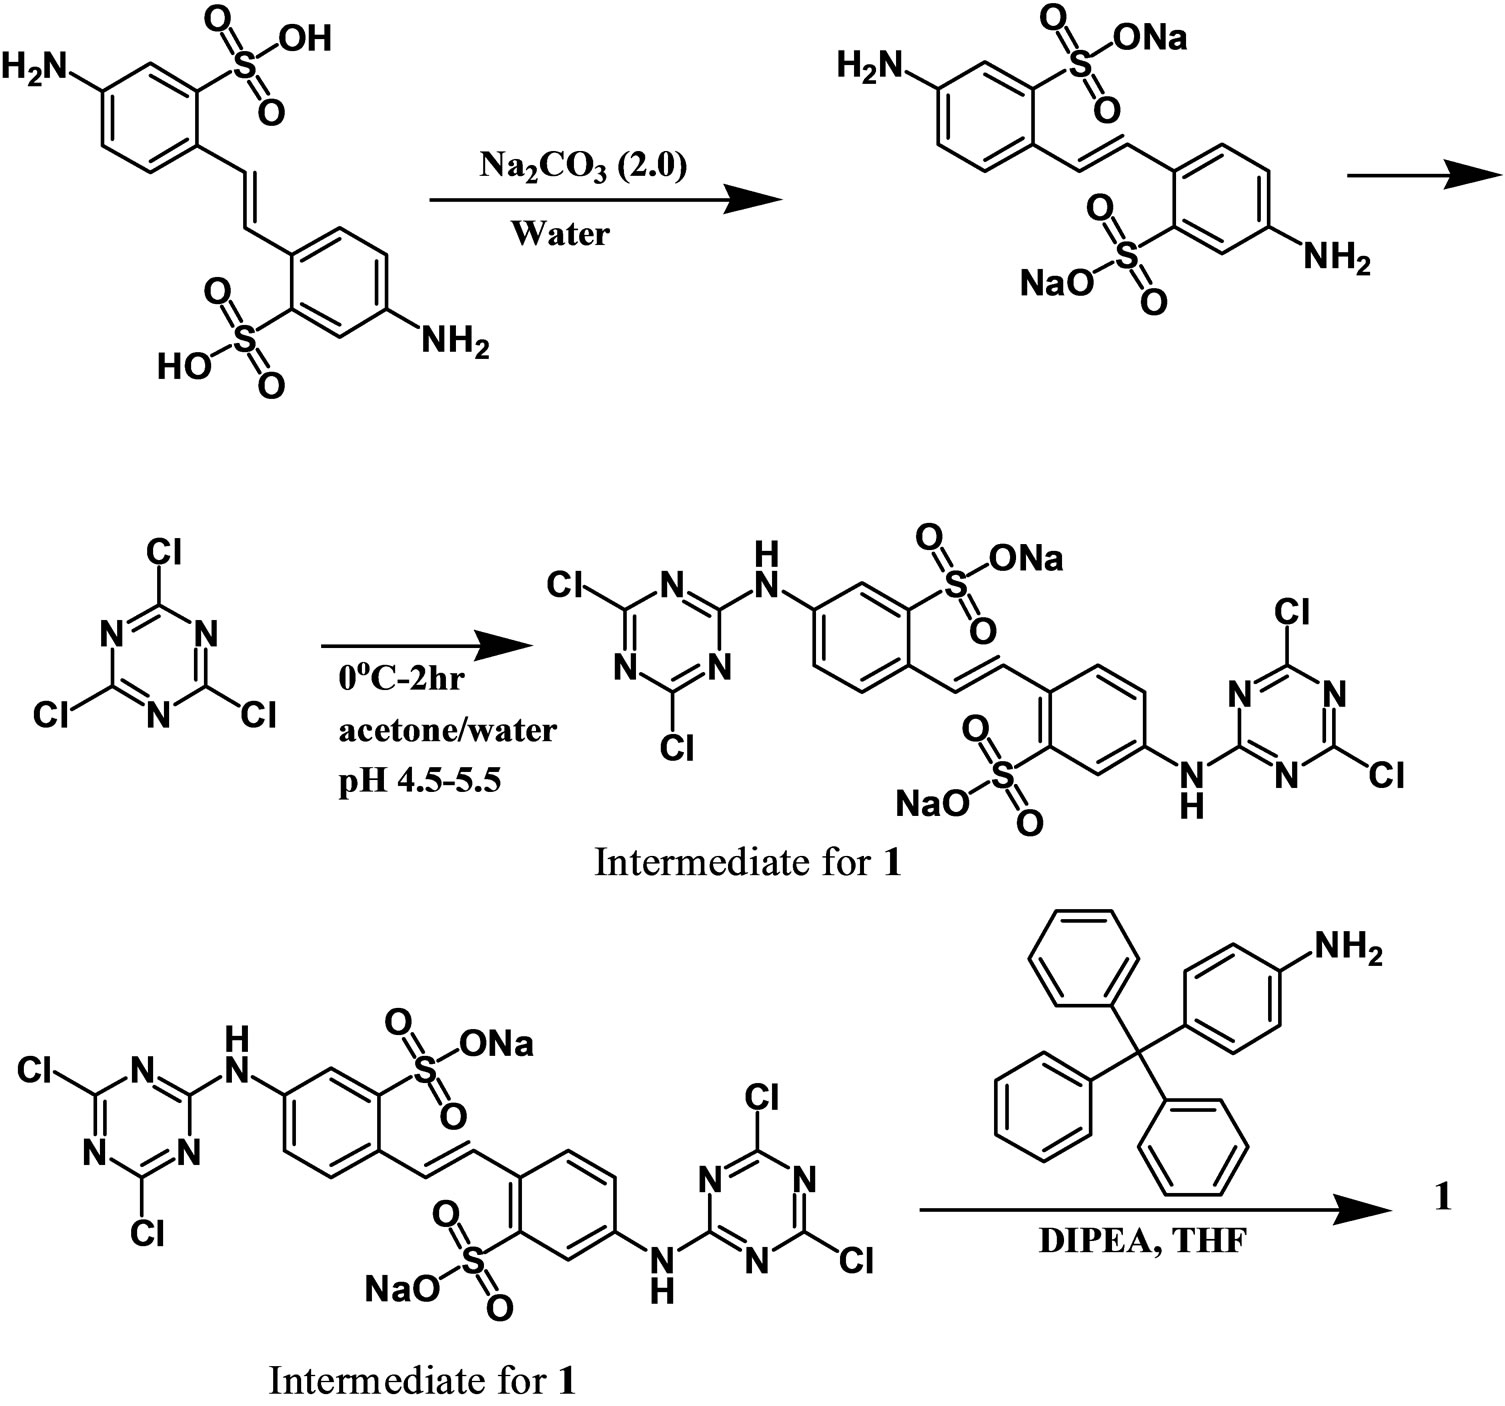
Scheme 1.Synthesis of 1. First, diamino stilbene was treated with base (2 equivalents) to yield to diaminostilbene sodium salt. Next, cyanuric chloride was added to the solution at 0˚C for two hours. The intermediate was isolated and washed with water. The intermediate was refluxed overnight with tritylaniline in the presence of DIPEA to give product 1 in 81% yield.
washing of the intermediate product, tritylaniline and DIPEA were added and refluxed overnight. The product was isolated in 81% yield.
Figure 2 shows the UV-Vis spectrum (Figure 2(a)), solution, and solid state fluorescence spectra of 1 (Figures 2(c) and (d)). Fluorescence spectroscopy and visual observation of blue fluorescence when the solid was exposed to a hand-held UV light demonstrated that the solid had strong fluorescent properties (Figure 2(b)). The lmax of absorbance of 1 was 359 nm. This wavelength allows 1 to fluoresce under sunlight conditions because the sun emits electromagnetic radiation across most of the electromagnetic spectrum (Figure 3). Furthermore, many incandescent light bulbs emit radiation starting at 300 nm (Figure 3), meaning that 1 can be excited to fluoresce by regular incandescent light bulbs and in sunlight. As seen in Figure 2(b), the fluorescence under UV-light conditions (364 nm) of 1increases dramatically as the concentration of 1 increases from 0.02% to 2%.
 (a)
(a)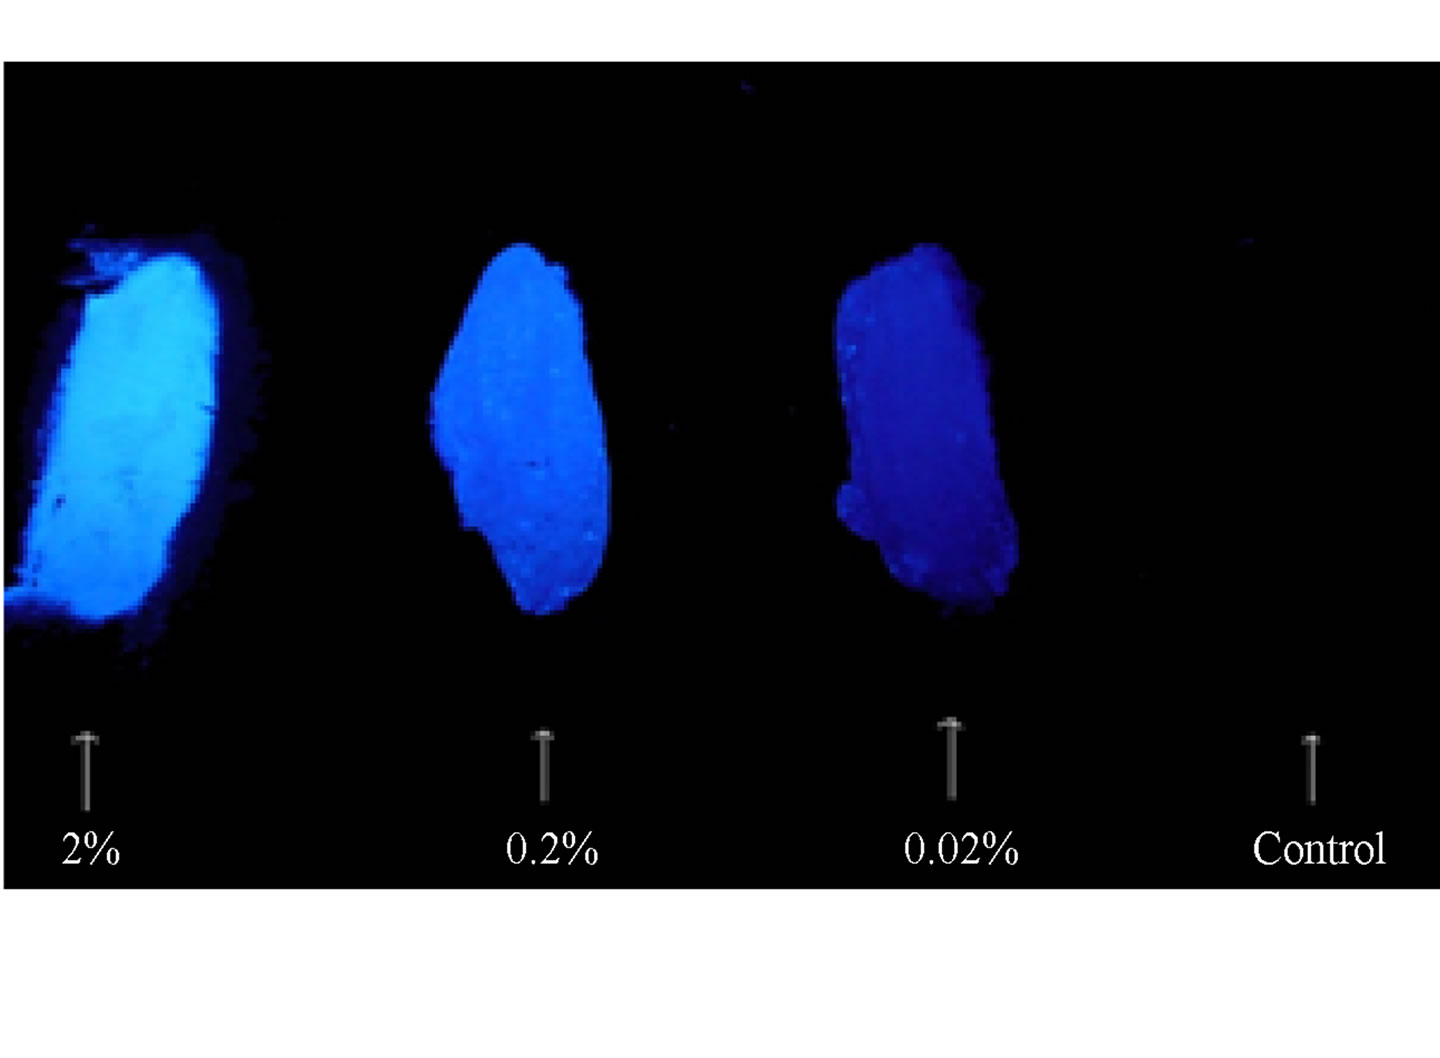 (b)
(b)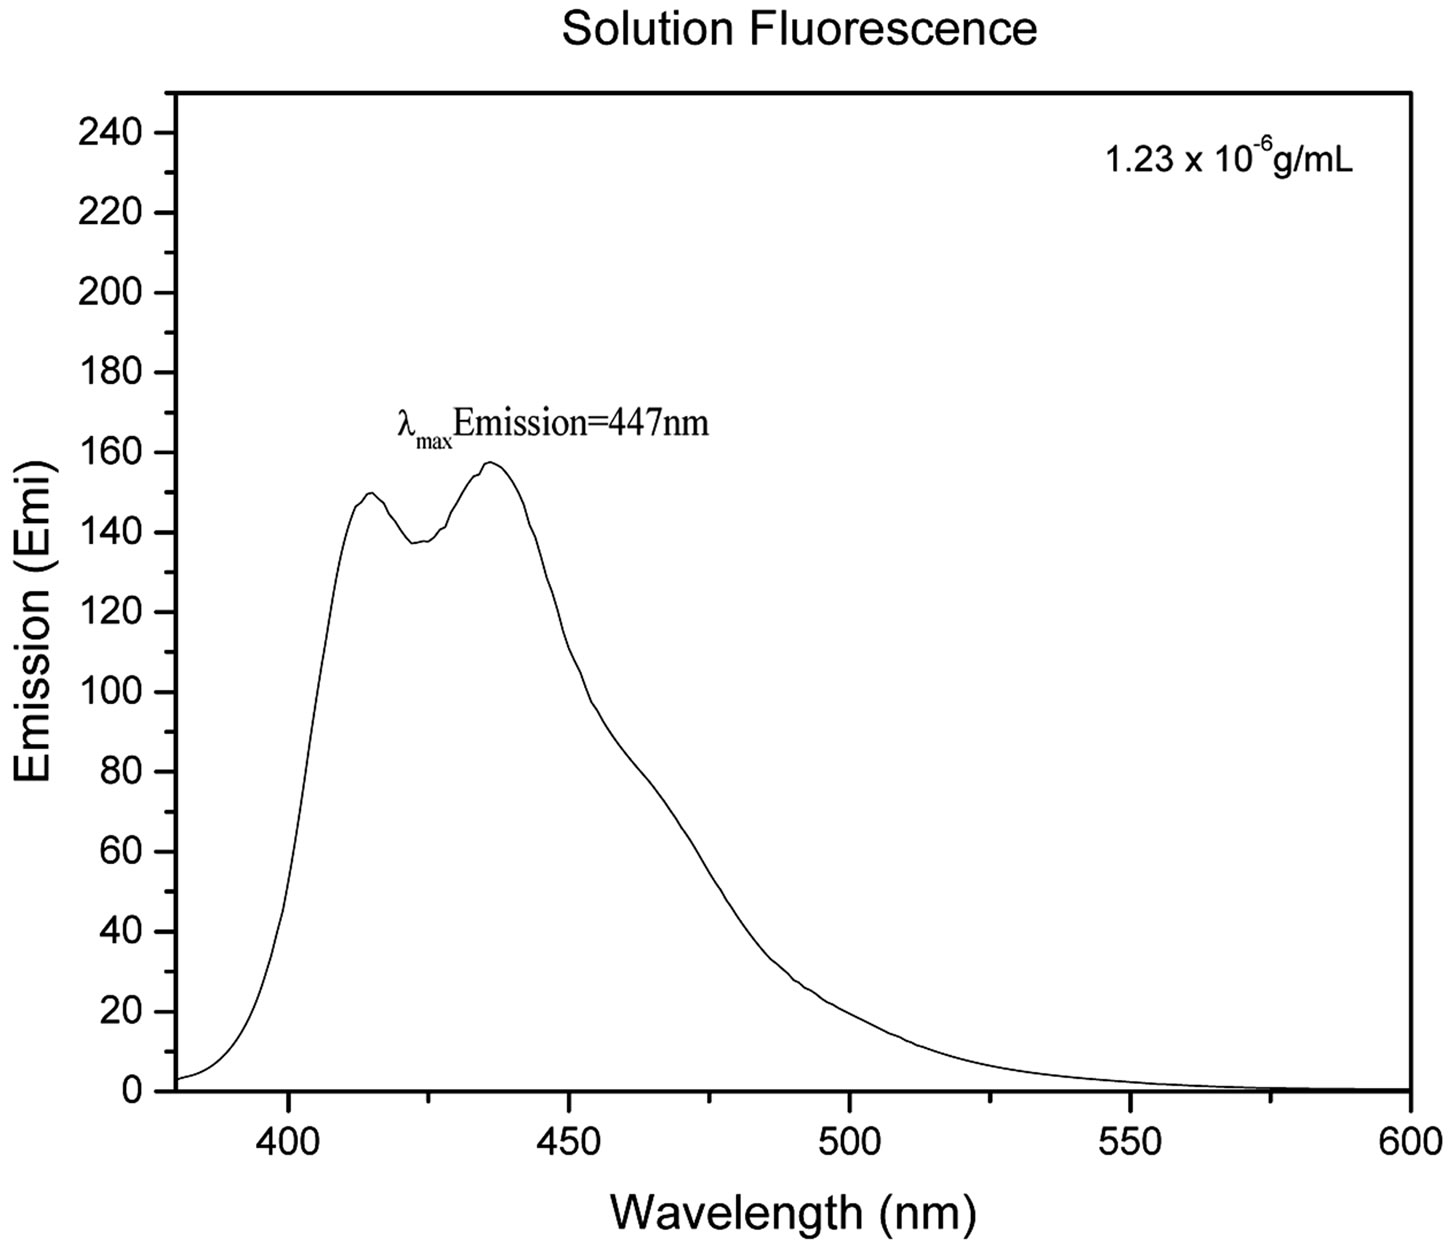 (c)
(c)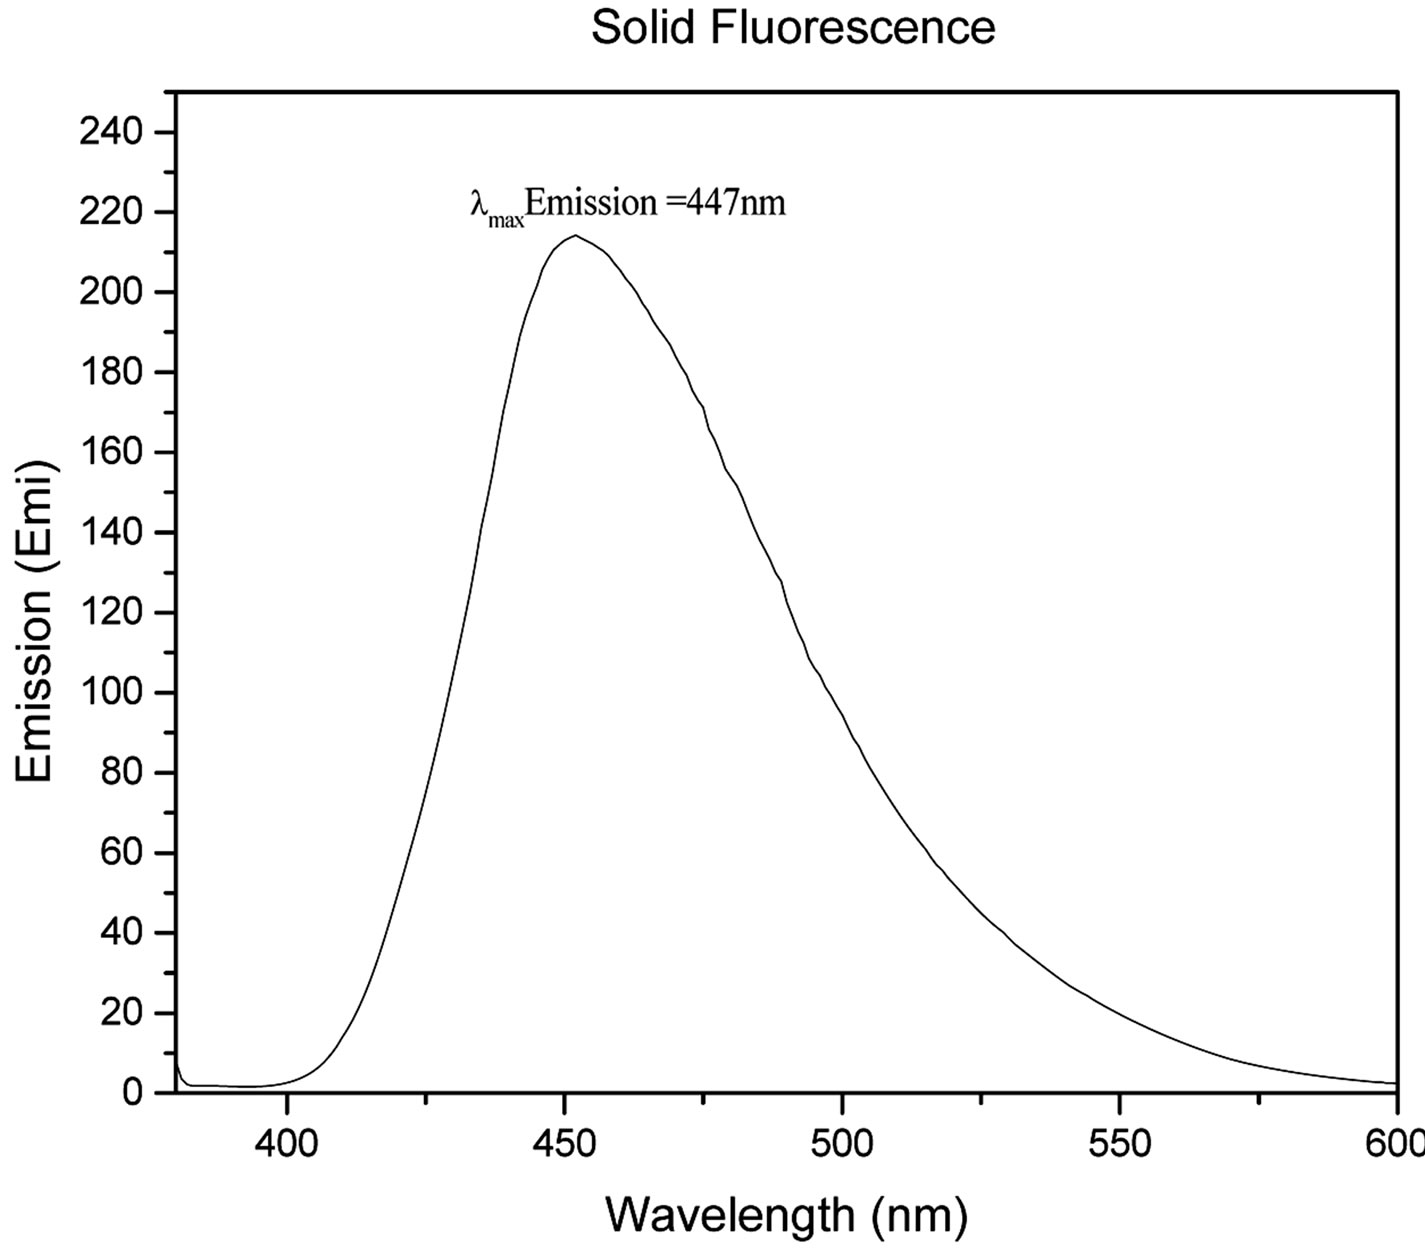 (d)
(d)
Figure 2. (a) UV-Vis of 1 1.23 × 10⁻⁵ g/mL in DMSO. The maximum absorbance is 359 nm; (b) 1 formulated into liquid foundation at 2%, 0.2%, and 0.02% and 0% (control) by weight under a hand-held UV lamp. The fluorescent properties of 1 are visible even at very low concentrations like 0.02%; (c) Solution fluorescence spectrum of 1 in DMSO at 1.23 × 10⁻⁶ g/mL; (d) Solid fluorescence spectrum of 1. 1 is highly fluorescent in the purple region as shown in the fluorescence spectra.
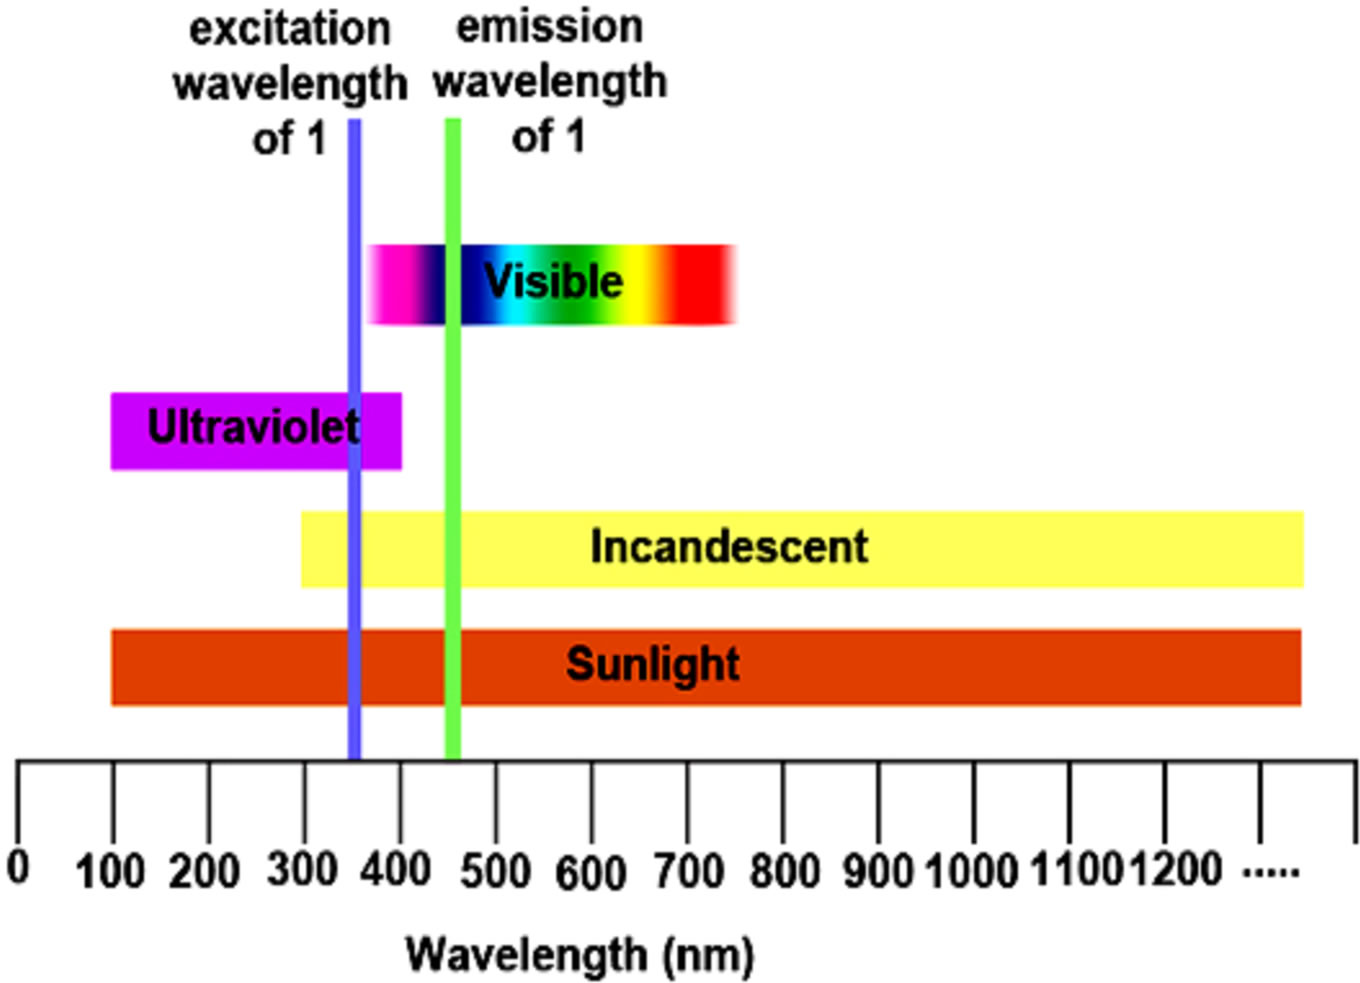
Figure 3. Chart of different light wavelengths compared to the excitation wavelength of 1 showing it can be excited under most types of lighting.
That means that if 1 would be used as a cosmetic additive, the formulation should only contain 0.02% or less in order to prevent a blue hue similar to what is seen when one wears a white T-shirt under black light conditions. The low percent loading of (0.02%) 1 in cosmetic products is actually very advantageous as this composition would allow for a large amount of product formulation. Even at a concentration as low as 1.23 × 10⁻⁶ g/mL, 1 gives significant fluorescence emission, and is even more fluorescent in the solid state (Figure 2(d)). Fluorescence that is visible in both liquid and solid products make 1 very practical for cosmetic applications.
The relative formula mass of 1 was determined using mass spectrometry. Figure 4 shows the MALDI mass spectrum of 1. The peak with the highest intensity has
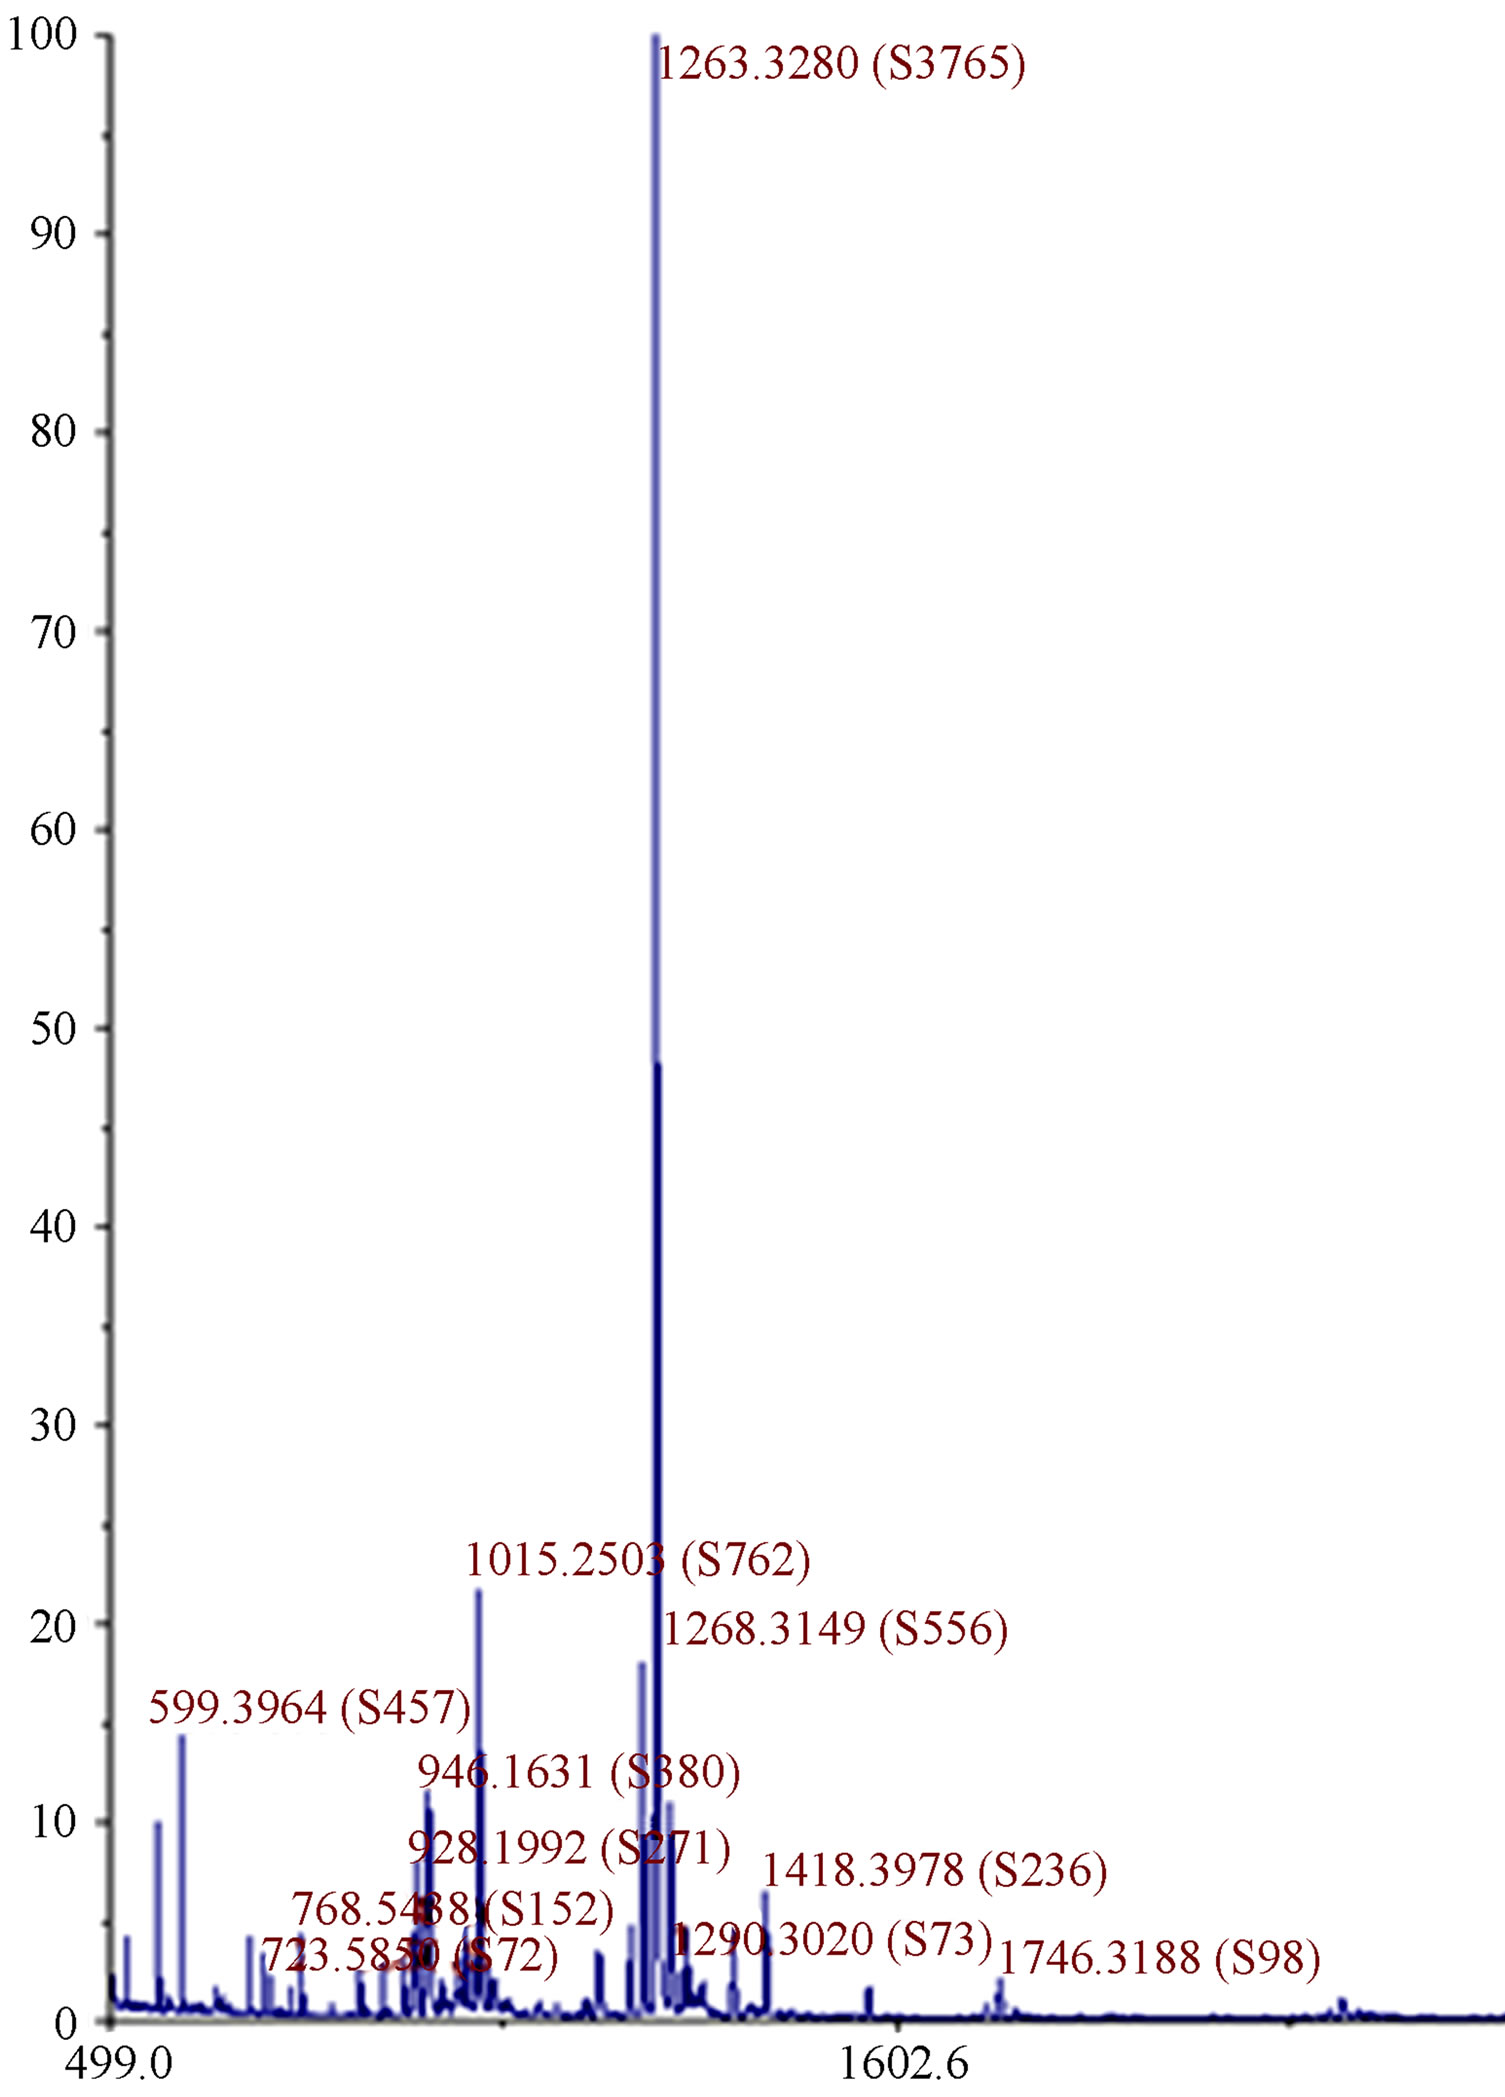
Figure 4. MALDI mass spectrum of 1 with a major peak at 1263 (the molar mass of 1) confirming 1 was synthesized in majority. Small impurities are also visible at lower and higher molecular masses.
mass to charge ratio of 1263 which corresponds to the molecular weight of 1. The mass spectrum shows the presence of small impurities of lower and higher molecular masses. These impurities were also confirmed in elemental analysis (Table 1) and 1H-NMR (Figure 5). The elemental analysis data of 1 is shown in Table 1. The expected elemental analysis was fitted by including water and DIPEA in the percent composition. DIPEA was used in the second step of the reaction (Scheme 1) and water was used for washing. It seems that 1 traps molecular impurities due to its “polar” properties. 1 is very hydrophilic due to its charged  groups, and water may adhere via intermolecular forces. 1 is also very hydrophobic due to its large and bulky tritylaniline groups. 1H-NMR of 1 is shown in Figure 5. The suggested proton assignments of 1 are demonstrated within the figure. It is evident from the spectrum that several peaks in the aromatic region (7.5 - 8.5 ppm) are very broad. This indicates that 1 may form aggregates in solution that result in poor peak resolution. The doublet at 7.1 ppm may arise from the ethylene protons overlapping with two protons at the meta position of the first aromatic ring of the tritylaniline. Figure 6 shows the 1H-NMR of
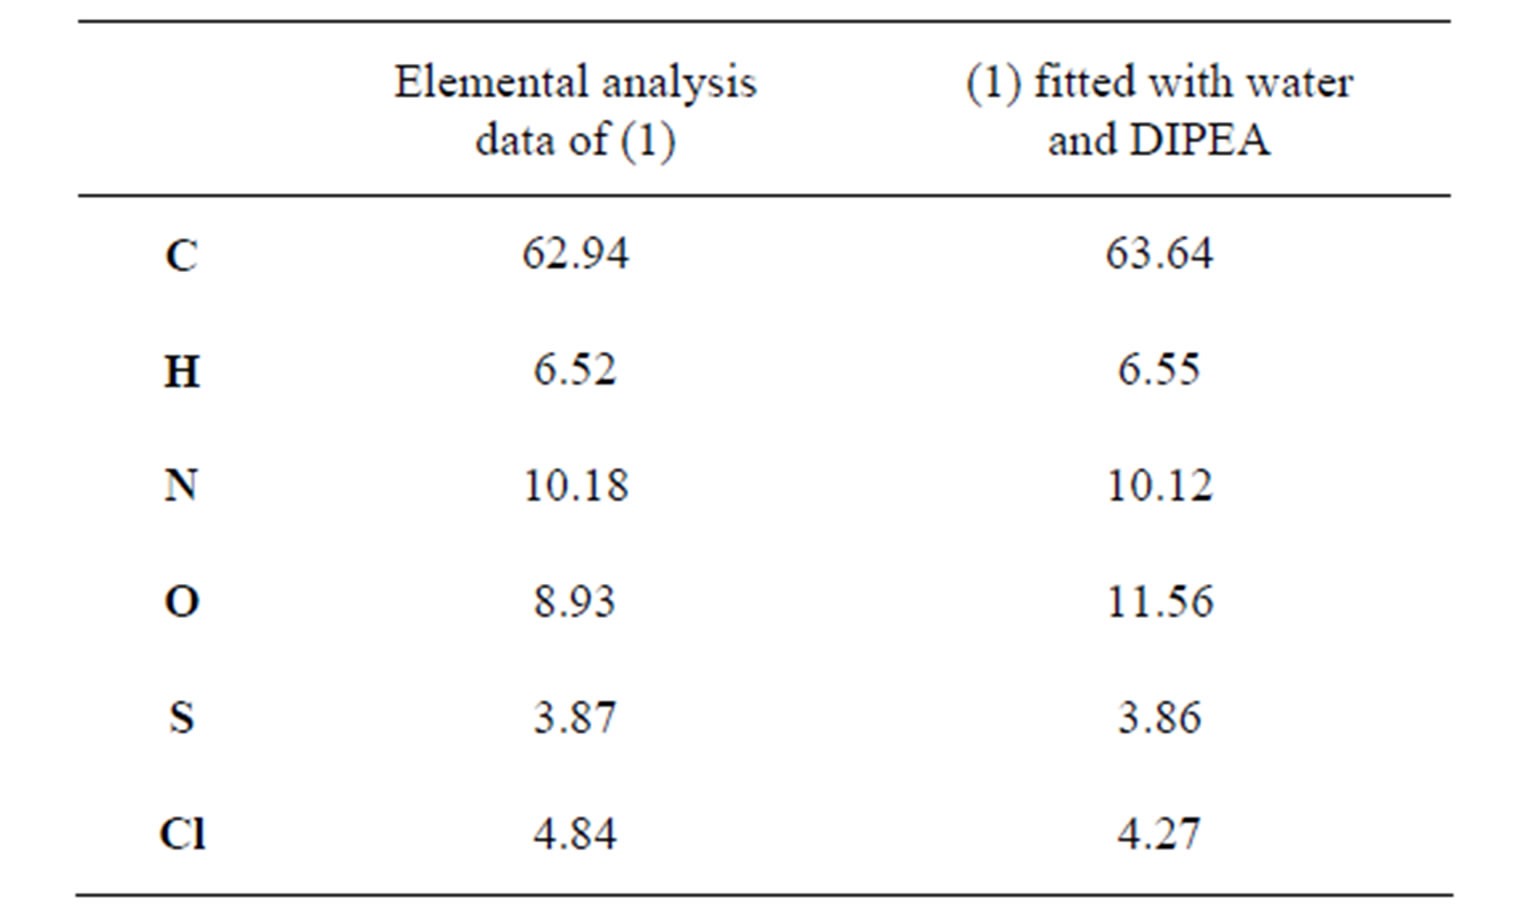
Table 1. Elemental Analysis data of 1 obtained from MicroAnalysis, Inc. fitted with water and DIPEA.
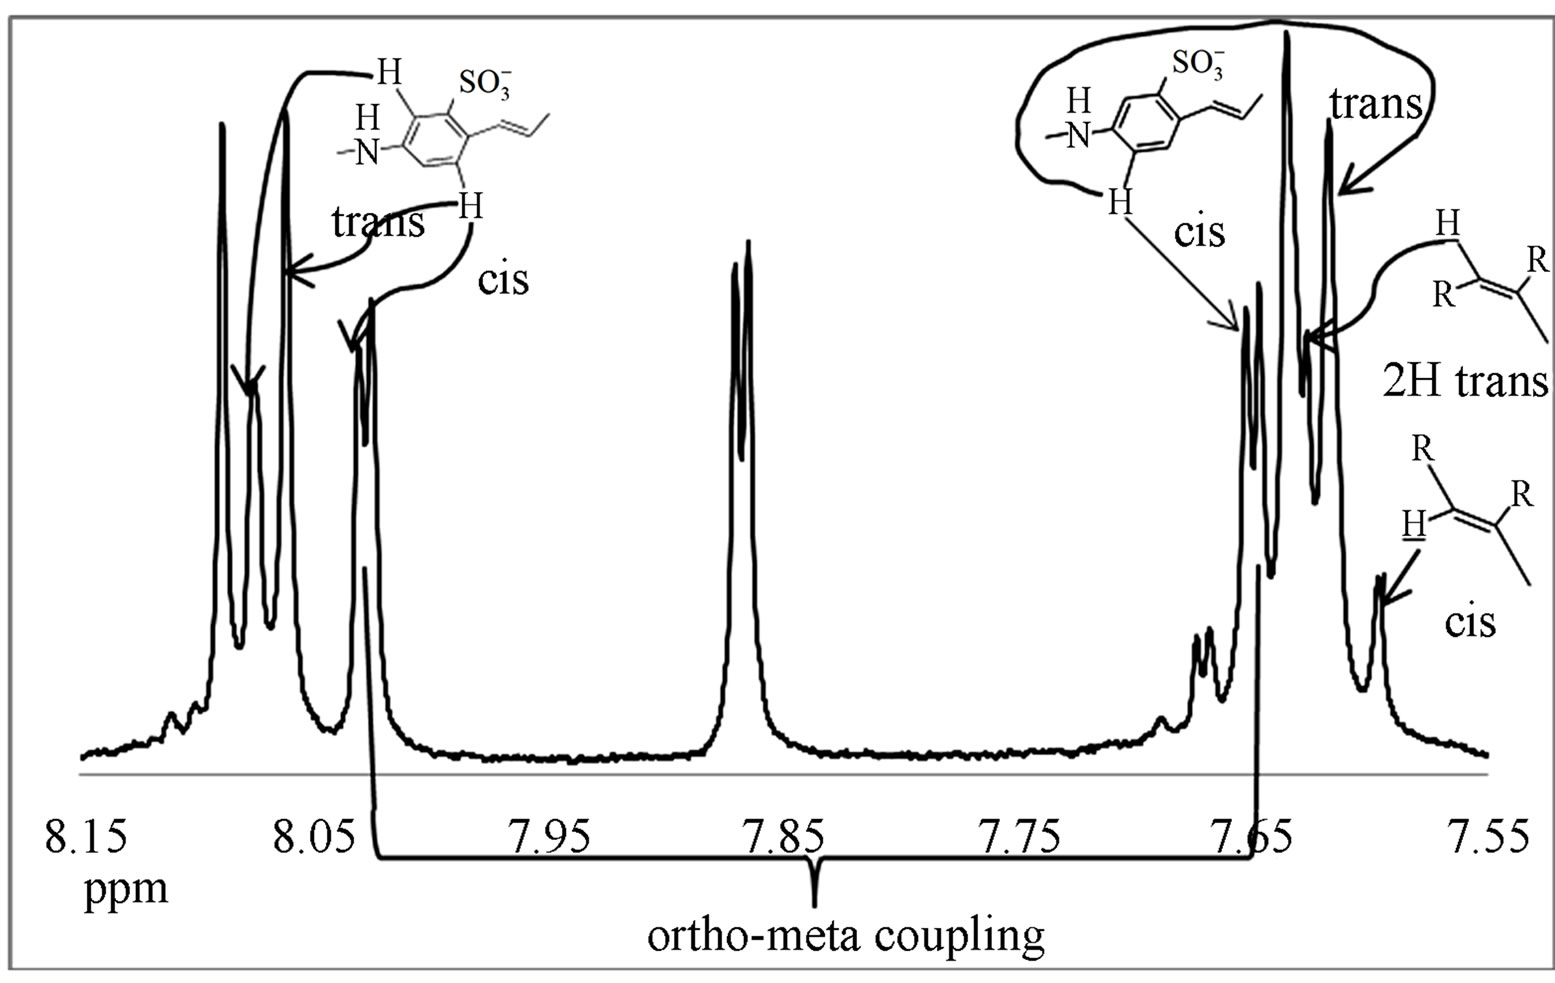
the intermediate obtained from step 1 (Scheme 1). The resolution and multiplicity of the peaks are much better due to the fact that tritylaniline is not yet attached to cause aggregation in the solvent.
The spectrum shows several interesting features and the proton assignment was complicated due to the complexity of the final product in the presence of impurities. First, there are doublets at 7.6 ppm, 7.8 ppm, and 8.07 ppm. These doublets may arise from structural cis-trans isomerism. The starting material diaminostilbene was only 85% pure and consequently the intermediate contains two isomers in 85:15 ratio (trans versus cis). More overlapping peaks from 7.2 to 7.3 ppm are assigned to the aromatic stilbene and aromatic ortho positions of tritylaniline. Six para protons of tritylaniline are located at 7.4 ppm. Two downfield peaks are present, one at 10.1 ppm and the other at 11.6 ppm. The peak at 11.6 ppm indicates that the nitrogen on the tritylaniline must be protonated. Protons on ammonium ions can occur as far downfield as 11.6 ppm [7]. The protonation of the nitrogen is due to the fact that when diaminostilbene is reacted with cyanuric chloride, HCl is formed as a side product and protonates the secondary nitrogen to form the HCl salt. The other downfield peak at 10.1 ppm is due to either nitrogen protonation of unreacted starting material or intermediate, or  groups on the aromatic rings becoming protonated at low pH. In addition to conventional characterization techniques such as 1HNMR, to determine purity, we also examined the products by diffusion ordered spectroscopy (DOSY) [8] as shown in Figure 7.
A 1H-NMR spectrum is obtained in the horizontal axis, while the diffusion coefficient (D) is obtained in the vertical axis. Since the diffusion constant depends on molecular size, the vertical axis provides an estimate for the number of components that are present in a mixture [8,9]. The measurement of diffusion is carried out by observing the attenuation of the NMR signals during a pulsed field gradient experiment.
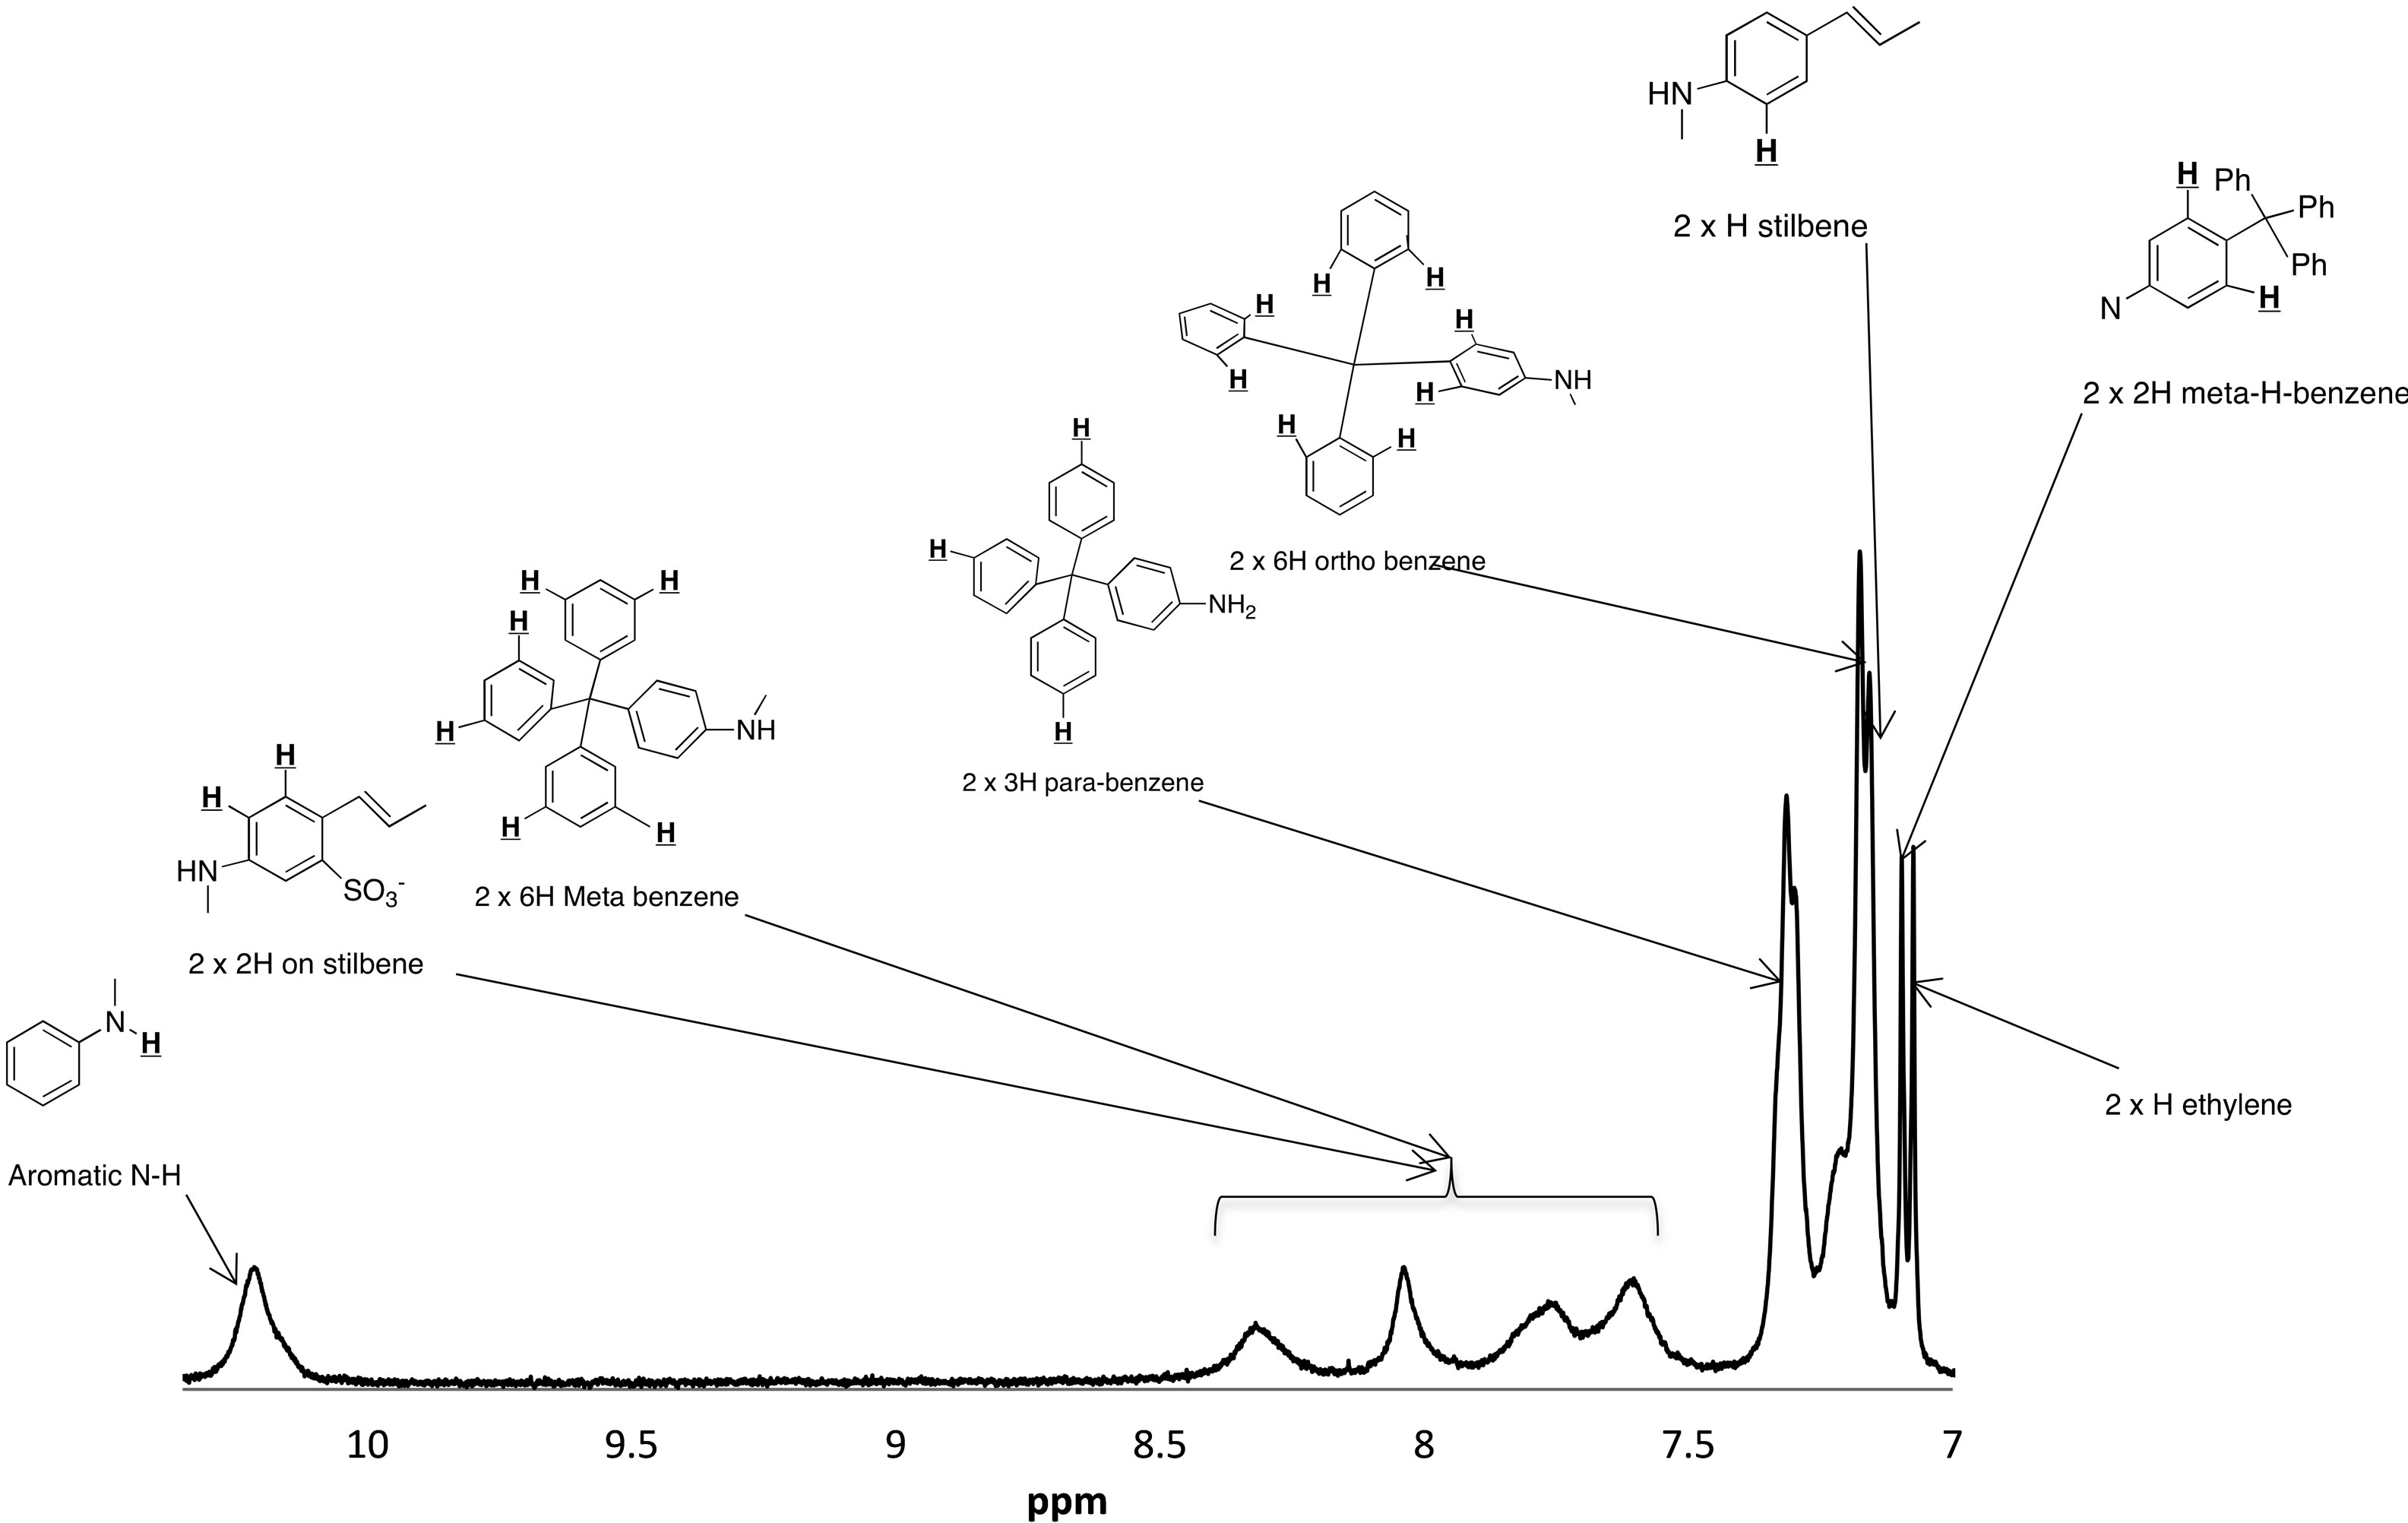
Figure 5. The aromatic region of the 1H-NMR spectrum of 1 in DMSO showing the proton peak assignment. The broad peaks from 7.5 to 8.5 ppm indicate that 1 forms aggregates in DMSO.
 (a)
(a)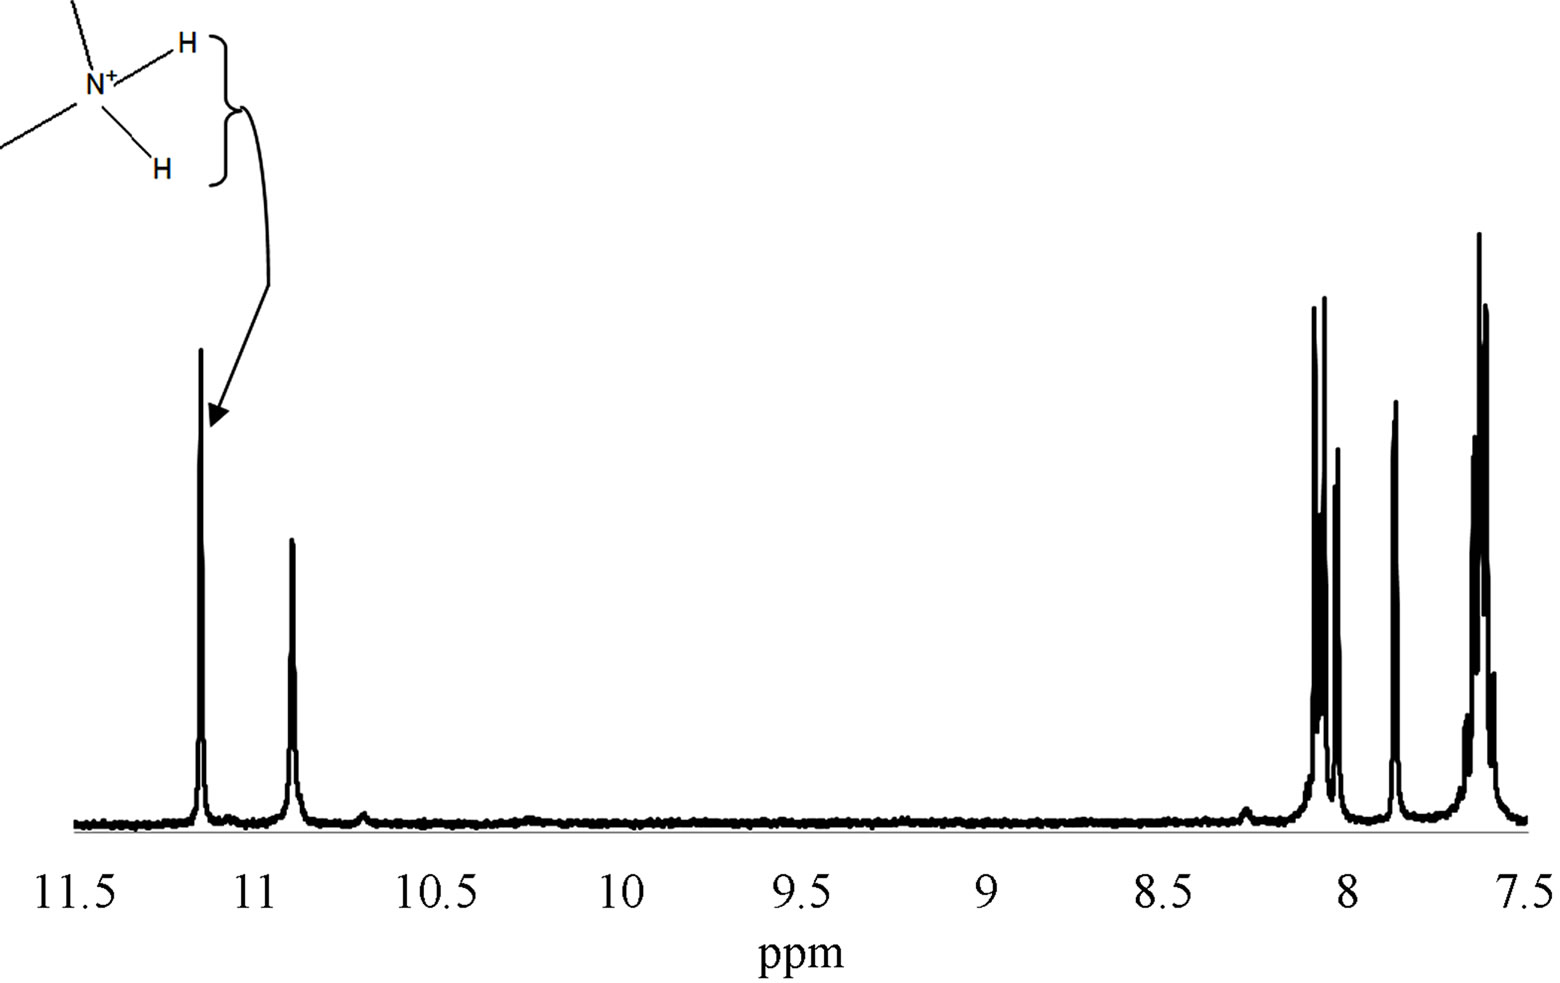 (b)
(b)
Figure 6. (a) 1H-NMR spectrum of wild-plum intermediate, showing the amine proton peak assignment; (b) 1H-NMR spectrum of wild-plum intermediate showing the peak assignment for the aromatic region.
Figure 7 shows that the aromatic region demonstrated the highest signal intensity which is attributed to the protons in the aromatic 1. Residual solvent (THF and DIPEA) peaks are also visible in small quantities at 3.1, 3.5, and 3.6 ppm.
4. Conclusion
1 was synthesized with reasonably high purity and yield (~81%). Characterization of 1 by 1H-NMR, mass spectrometry, elemental analysis, and DOSY-NMR confirmed the structure of 1 (as shown in Figure 1). 1 is highly fluorescent in the purple region in both the solid and dissolved state. It is able to fluoresce under normal lighting conditions, which makes it a viable candidate as an optical brightener in cosmetics, paper, paints, or detergents.
5. Acknowledgements
The authors are grateful to the National Science Founda
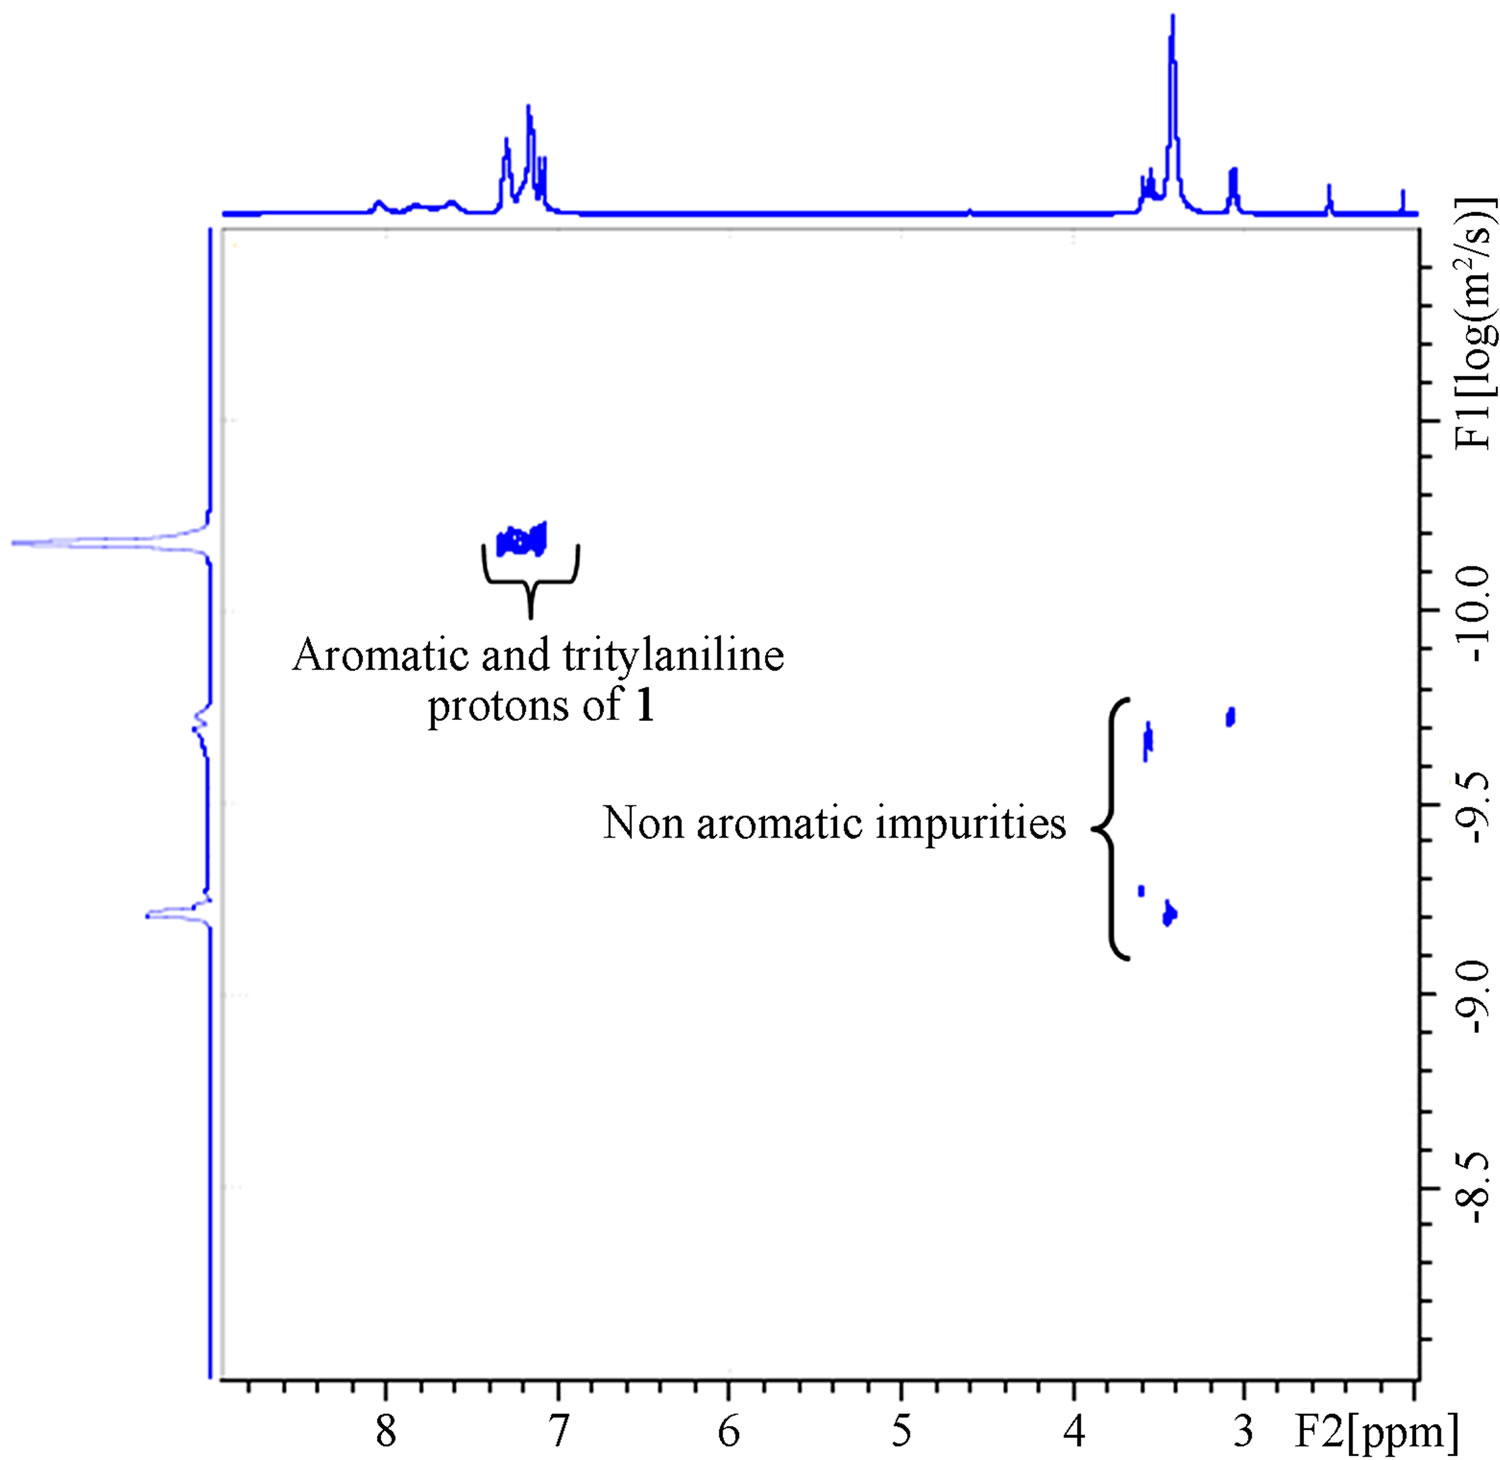
Figure 7. DOSY NMR spectrum of 1. The highest signal intensity was found for 1 in the aromatic region between 7 - 8 ppm. Aliphatic impurities, solvents, and residual DIPEA are seen in small quantities in the aliphatic region.
tion (NSF) for providing funds for this project through Nebraska Center for Nanohybrid Functional Materials (CNFM) grant NSF–EPSCoR-EPS-1004094 and NSFCHE1040402 and The National Institutes of Health (NIH) for grant Nos. P20 RR016474 (M.B.) and P20 RR016469 (A.E.H.).
REFERENCES
- S. Dufresne, M. Gaultois and W. G. Skene, “Disodium 5,5’-Diamino-2,2’-ethylenedibenzenesulfonate Tetrahydrate,” Acta Crystallographica, Vol. 63, 2007, p. E63.
- M. A. Hubbe, J. J. Pawlak and A. A. Koukoulas, “Paper’s Appearance: A Review,” BioResources, Vol. 3, No. 2, 2008, pp. 627-665.
- I. D. Cohen, “Cosmetic Compositions Containing Optical Brighteners,” US Patent No: 09/320153, 1999.
- US Food and Drug Administration, “Color Additives Inventory.” http://www.fda.gov/forindustry/coloradditives/coloradditiveinventories/ucm115641.htm
- “Cosmetics Info.” http://www.cosmeticsinfo.org/products.php?category_id=7
- P. de Hoog, P. Gamez, W. L. Driessen and J. Reedijk, “New Polydentate and Polynucleating N-Donor Ligands from Amines and 2,4,6-Trichloro-1,3,5-triazine,” Tetrahedron Letters, Vol. 43, No. 38, 2002, pp. 6783-6786. http://dx.doi.org/10.1016/S0040-4039(02)01498-3
- “Proton Chemical Shifts.” http://www.chemwisc.edu/areas/reich/handouts/nmr-h/hdata{31}.gif
- G. Morris, “Diffusion-Ordered Spectroscopy,” John Wiley & Sons Ltd., Chinchester, 2009.
- D. Fujita, K. Suzuki, S. Sato and M. E. A. Yagi-Utsumi, “Protein Encapsulation within Synthetic Molecular Hosts,” Nature Commications, Vol. 3, 2012, p. 1093. http://dx.doi.org/10.1038/ncomms2093