Engineering
Vol. 2 No. 11 (2010) , Article ID: 3168 , 4 pages DOI:10.4236/eng.2010.211112
Temperature Effects on the Electrical Performance of Large Area Multicrystalline Silicon Solar Cells Using the Current Shunt Measuring Technique
1National Institute for Standards, Giza, Egypt
2Brunel University, West London, UK
3Cairo University, Cairo, Egypt
E-mail: halaabdelmegeed@yahoo.com
Received September 3, 2010; revised October 15, 2010; accepted October 29, 2010
Keywords: Large Area Multicrystalline Silicon Solar Cell, Current Shunt Measuring Technique, Temperature Effects, Short Circuit Current, Open Circuit Voltage, Accumulated Power, Incident Radiation
ABSTRACT
The temperature effects on the electrical performance of a large area multicrystalline silicon solar cell with back-contact technology have been studied in a desert area under ambient conditions using the current shunt measuring technique. Therefore, most of the problems encountered with traditional measuring techniques are avoided. The temper-ature dependency of the current shunt from 5ºC up to 50ºC has been investigated. Its temperature coefficient proves to be negligible which means that the temperature dependency of the solar cell is completely independent of the current shunt. The solar module installed in a tilted position at the optimum angle of the location, has been tested in two different seasons (winter and summer). The obtained solar cell short circuit current, open circuit voltage and output power are correlated with the measured incident radiation in both seasons and all results are discussed.
1. Introduction
It is known that photovoltaic devices such as solar cells generate electrical current when photons with sufficient energy penetrate the semiconductor and excite electrons into the conduction band [1]. However, due to the great need for these cells in massive applications, the solar cell industry has grown rapidly in recent years [2]. There is no doubt that due to low production costs and readily abundance multicrystalline silicon (mc-Si) is a very attractive substrate for solar cells [3,4]. Therefore, it is currently the dominant solar cell material for commercial applications [5,6]. Moreover, according to predictions, it will remain an important and dominant material in photovoltaics over the next 10-30 years, owing to its well recognized properties and its established production technology [7,8].
In fact, back-contact solar cells hold significant promise for increased performance in photovoltaics for the near future. They have several advantages over conventional solar cells [9-13]. Furthermore, characteristics of these back-contact solar cells were studied to improve their performance [14,15].
Short circuit current and open circuit voltage are the two major electrical parameters generally used to characterise the solar cells. Typically, these parameters are traditionally measured by digital multimeters (DMMs). However, as the big sizes of solar cells produce high current intensity with low output voltage; some troubles would appear from the usage of multimeters. Although, in a previous study [16], the hall sensor technique was applied in order to overcome these problems this technique also suffered from some limitations and needed a lot of precautions [17].
Nevertheless, due to the actual need of measuring the solar cells’ high output currents in the desert area; the current shunt measuring technique played an essential role in achieving this task. Nowadays, current shunts are used in such applications to measure current by measuring the voltage developed across their known very low resistance [17,18].
In our application, the current shunt is used in the desert area under different ambient temper-atures. The major factor to be considered is the heat generated by the shunt itself, along with the ambient temperature. Therefore, it is essential to study its behaviour under different temperatures.
In this paper, the calibrated (Holt HCS-1) current shunt 20 Ampere range was used to study the temperature effects on the electrical performance of large solar cell with back-contact technology. It was tested under different temperatures ranging from 5ºC to 50ºC in a temperature test chamber to evaluate its temperature coefficient effect on its characteristics. Then, it was applied in the realistic application to get the short circuit current of a mc-Si solar cell of area 21 cm × 21 cm with back contact technology in two different seasons (winter and summer). The cell short circuit current, open circuit voltage and output power were accurately measured and correlated.
2. Tested mc-Si Solar Cell
The tested mc-Si solar cell with back contact technology is shown in Figure 1. It has a large area of 21 cm × 21 cm. The module was installed in a tilted position at the optimum tilt angles for both seasons that were previously investigated [19].
The cell current was collected by the fine finger grid which is led to the back side through 25 holes. On the back side there are 25 soldering pads for each polarity. The outdoor cell electrical performance was studied by measuring both short circuit current and open circuit voltage in the tilted position.
3. (Holt HCS-1) Current Shunt
In order to measure high currents with best accuracy, Kelvin Four-terminal current shunts are commonly used in the metrology community and in the industrial mea-
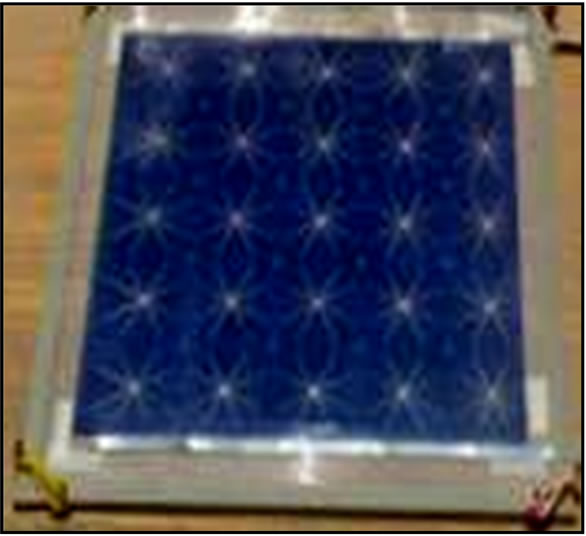
Figure 1. Tested mc-Si solar cell.
surement applications, specially, in high current low voltage applications [20].
A (Holt HCS-1) current shunt set consists of seven separate calibrated shunt modules having current ranges from 10 milliamps up to 20 Ampere. Each range can be used for 50% up to 130% of its rated current. In this work, the 20 Ampere range current shunt shown in Figure 2 was preferably used to measure the high short circuit current (ISC) of our tested solar cell.
This shunt resistor has a coaxial design; where, the resistor being a web of wire arranged coaxially about the axis of the shunt. Actually, it is the most cost effective current sensing elements, having compact package profiles, suitable for current measurements. It has as their major design goal adequate power dissipation and minimal resistance changes with temperature (low temperature coefficient of resistance). Eventually, one of the most important features of this current shunt is that it converts the applied current to voltage drop across its terminals in a linear manner [21-24].
3.1. Temperature Effect on the Current Shunt
Temperature testing aims to prove the resistance capability of test specimens to the environmental influences of the temperature combined with the humidity. The (Votsch-VCL) temperature test chambers are ideally suited to the environmental simulation applications. This type of chambers provides an optimum solution where space is limited. In addition, it is visually attractive with large windows, compact, easy handling, suitable for a broad range of applications involving temperature and relative humidity (RH). Besides, it has touch panel and independent adjustable temperature limiter with standard humidity diagram.
The described 20A current shunt was tested at different temperatures of 5ºC, 10ºC, 20ºC, 30ºC, 40ºC, and 50ºC at RH 50%. Its output voltage was recorded by the 8.5 digit DMM (Fluke 8508A) when the current was applied through it from the (Wavetek 9100) calibrator. Both the DMM and the calibrator used in this test were recently calibrated.
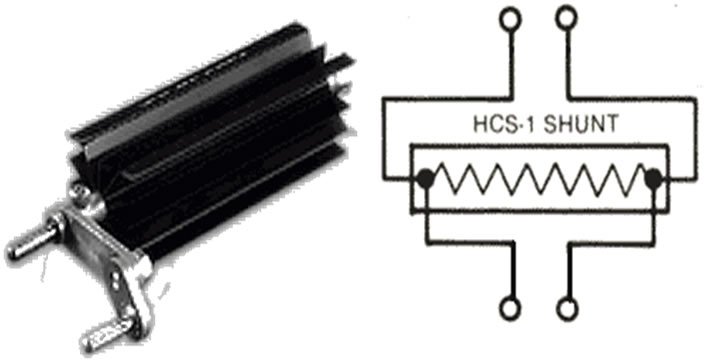
Figure 2. (Holt HCS-1) Current shunt 20 ampere range.
Tables 1, 2 and Figure 3 demonstrate the input-output relation of the 20 Ampere current shunt at different temperatures from 5ºC up to 50ºC respectively.
Figure 3 illustrates the experimentally investigated input-output curve of the 20A (HCS-1) current shunt at the temperatures from 5ºC to 50ºC, which clearly shows that its output voltage is linearly proportional to its input current with approximately the same linearity equation at all temperatures. Eventually, the investigated linearity equation that relates the input current to the output voltage is:
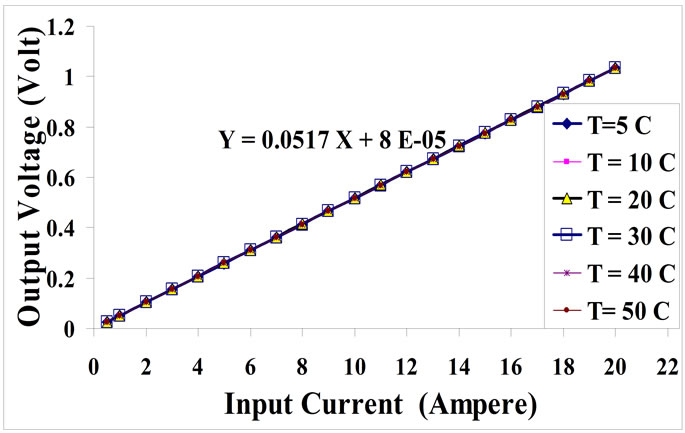
Figure 3. Input-output curve at different temperatures from 5ºC up to 50ºC.
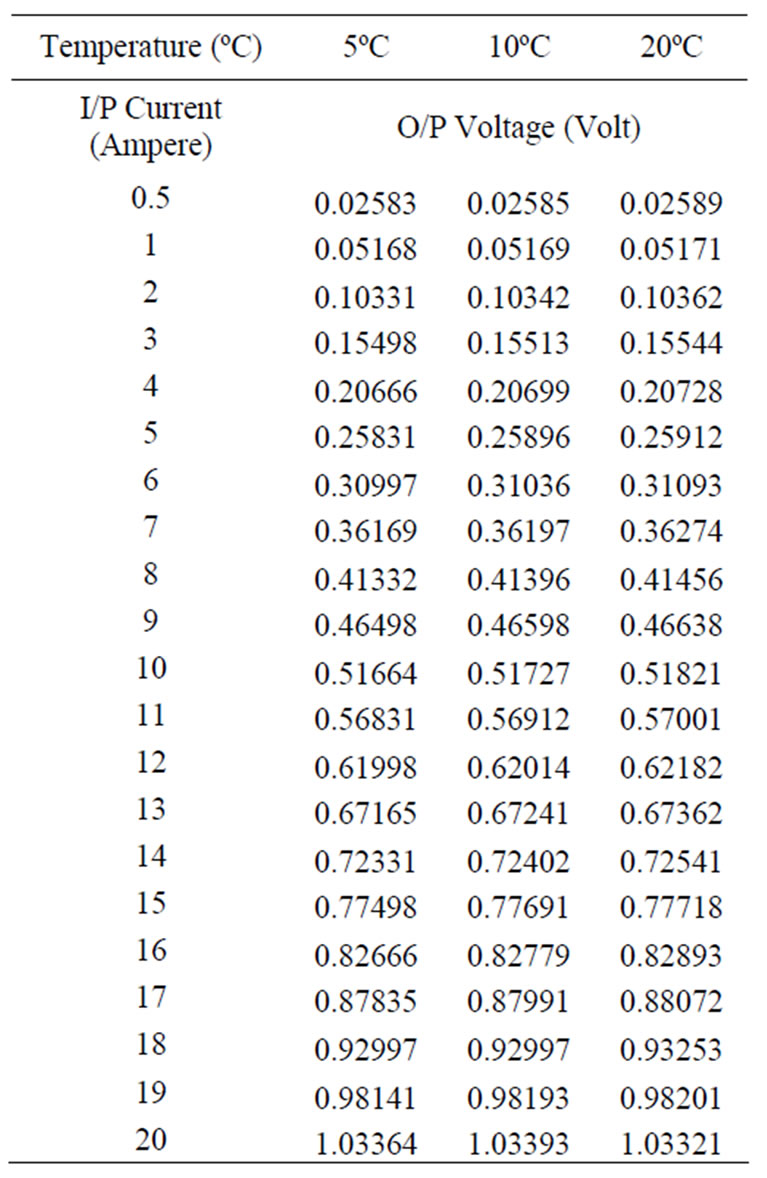
Table 1. Input-output relation of the 20 ampere current shunt at 5ºC, 10ºC, 20ºC.
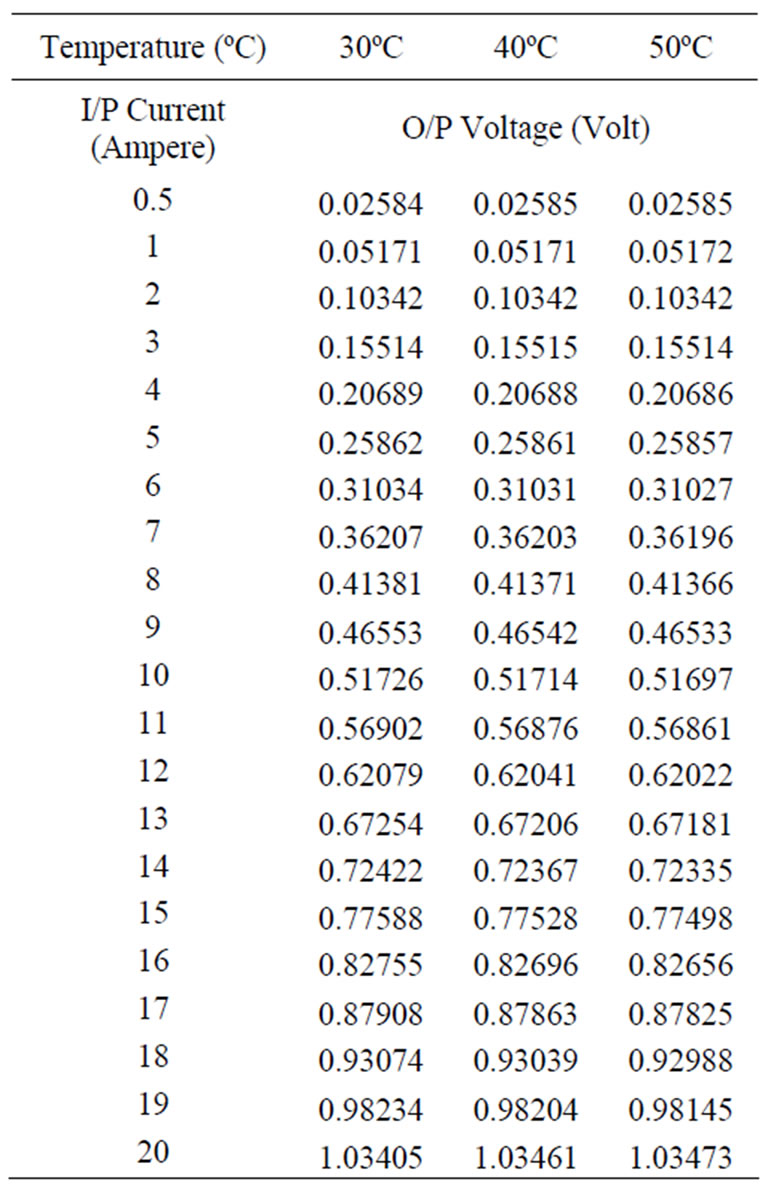
Table 2. Input-output relation of the 20 A current shunt at 30ºC, 40ºC, 50ºC.
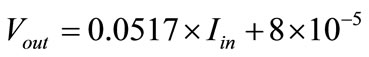 (1)
(1)
where Vout is the output voltage drop across the current shunt resulted from applying input current source Iin.
This means that our tested current shunt is not only very stable under a wide range of temper-atures from 5ºC up to 50ºC but also it has a unique linearity equation at all tested temperatures. Therefore, it can be safely used in the desert area and the cell short circuit current (ISC) could be computed from the investigated linearity equation when the voltage drop across the current shunt (Vout) is applied as an input data to the equation and the current (Iin) is considered for (ISC). Furthermore, the admirable advantage of this shunt is that, its temperature coefficient is negligible and would never affect the solar cell output results.
4. Electrical Measurements of the Tested Solar Cell in Different Seasons
As an application of the current shunt for the outdoor measurements, the large solar cell had been installed in a tilted position at the optimum angle of the location and it had been tested in two different seasons (winter and summer).
The data was recorded on 9th March and on 19th July.
The ambient temperatures of these two days were recorded which representing the surrounding temperature around the cell. Figure 4 shows the ambient temperature variations during these two days.
As shown in Figure 4, the temperature around true noon relatively increases rather than the two wings (sun rise and sun set) for the two days. The recorded temperatures on 19th July are higher than the temperatures on 9th March by about 10ºC, which represent the attainable heat particularly acquired by the solar cell around true noon.
In our concept, the 20 Ampere current shunt was simply used as an accurate sensor to obtain the equivalent voltage drop across its known resistance when the short circuit current was passed through it. Afterwards, this equivalent voltage was applied to a 14 bit data logger. It is directly connected to a PC to compute the corresponding current using the shunt input-output linearity curve according to Equation (1).
The solar cell open circuit voltage signals were received by the data logger to be transferred to the PC through the prepared software. This software was designed to accurately give the output electrical power of the solar cell. The incident radiation was recorded by using CMP3 Kipp&Zonen pyranometer which measures the solar radiation with a high quality blackened thermopile. The measured data of short circuit current ISC, open circuit voltage VOC and output electrical power of the tested solar cell for both seasons are carried out. The plotted curves of ISC, VOC and power of two selected days in these seasons are illustrated in Figures 5 and 6 respectively.
5. Results Correlation
To correlate the obtained measurements of the investigated cell for both seasons, the current-voltage, the power and the radiation characteristics were presented. Strictly speaking, temperature affects the current-voltage
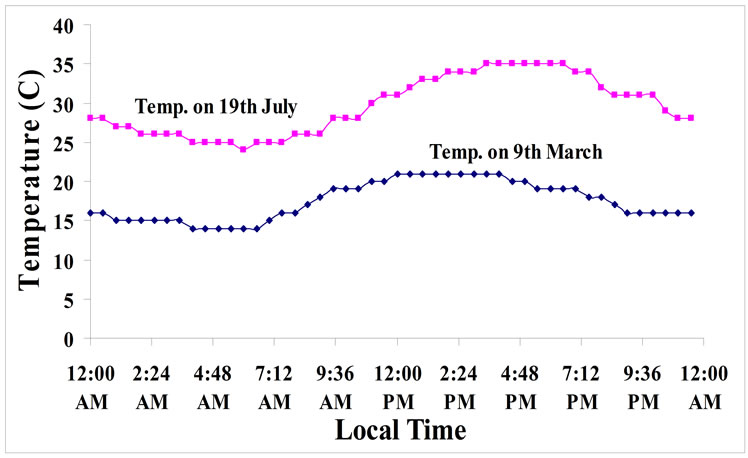
Figure 4. Ambient Temperatures on 9th March and 19th July.
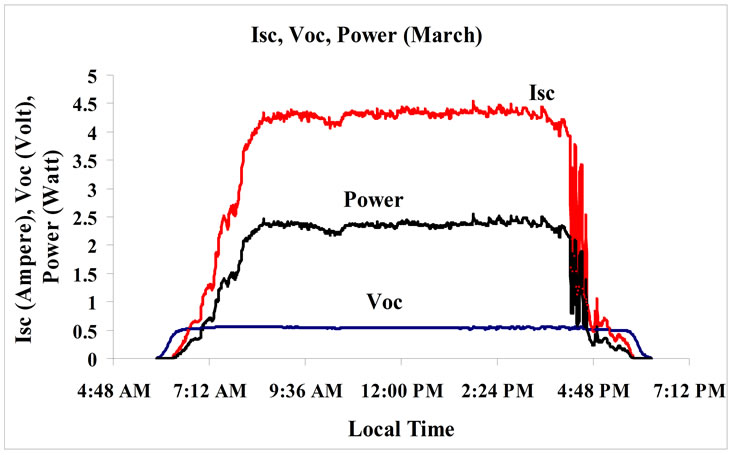
Figure 5. (ISC), (VOC) and electrical power of the cell in winter.
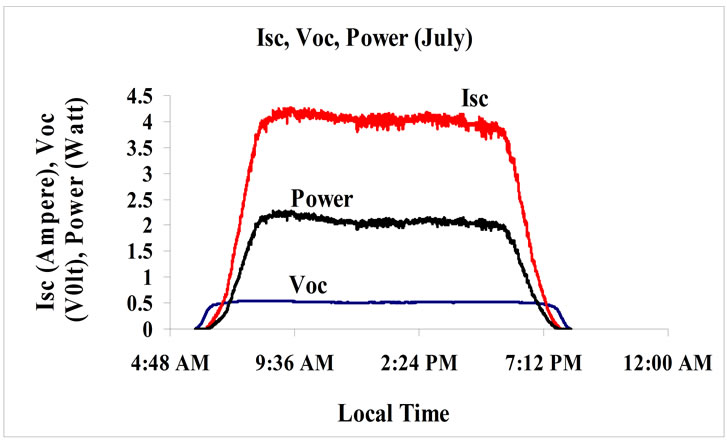
Figure 6. (ISC), (VOC) and electrical power of the cell in summer.
characteristics of the silicon solar cells [7]. Physical aspects of deterioration of the output power and the conversion efficiency of solar cell with increasing temperature are: increase of the thermal lattice vibrations, leading to electron-photon scattering, decrease of charge carriers mobility, and reduction of the p–n junction built-in voltage and junction ability to separate electrons from holes in the photogenerated pairs [7].
Therefore, the short circuit current (ISC) is reduced with the increasing of the temperature of the cell connections and bars. Also, the open circuit voltage (VOC) is linearly reduced with increasing temperature. The magnitude of this reduction is inversely proportional to VOC. The change in VOC with temperature is about (–0.50%/°C). The daily profiles of ISC and VOC in March and July are depicted in Figures 7 and 8.
It is clearly shown that the cell ISC and VOC in July are slightly lower than ones in March due to the increasing of temperature during summer as shown in Figure 4. The cell short circuit current and open circuit voltage values in summer are slightly lower than in winter around the noon time, however the collected radiation values in summer per day are higher than in winter. This is mainly attributed to the long time of sun shine. Con-
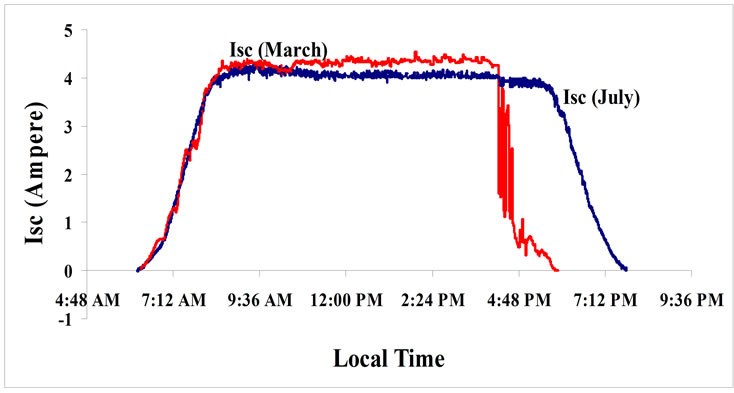
Figure 7. Cell short circuit current in winter and summer.
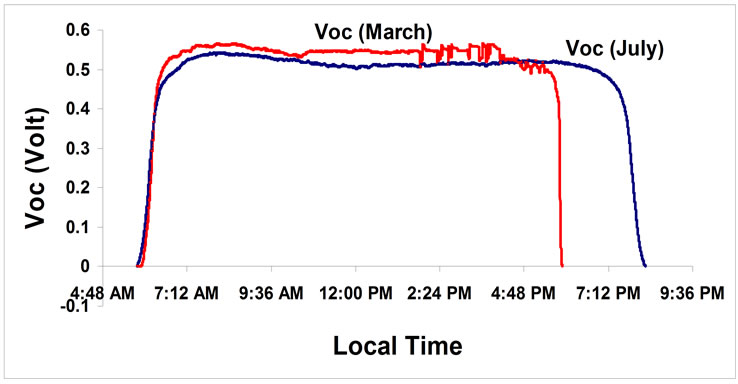
Figure 8. Cell open circuit voltage in winter and summer.
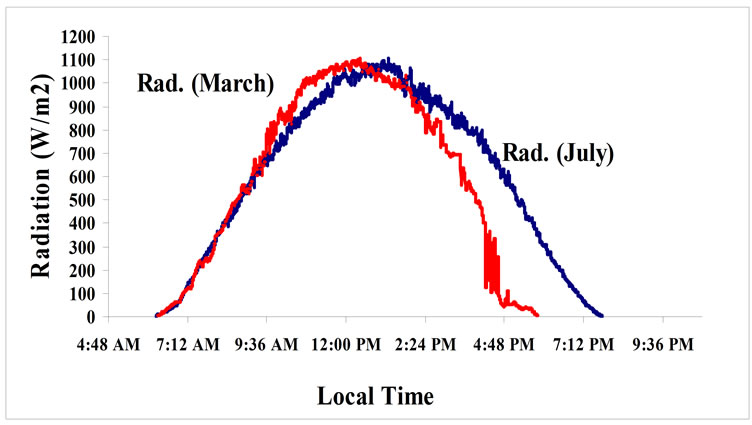
Figure 9. Solar radiation intensity for two selected days of March and July.
sequently, the cell has been exposed to the sun rays for longer interval. Figure 9 demonstrates the cell solar radiation intensity incident on its surface in case of the optimum tilted angle of two selected days.
The cell total incident solar radiation value per day on 19 July in summer was about (6.9 kWh/m2.day) while its value on 9 March in winter was about (6.3 kWh/m2.day). This means that, the amount of the solar energy falling on the cell surface in summer is greater than it in winter. Accordingly, the electricity converted by the solar cell during the summer is higher than it in winter.
Figure 10 illustrates the cell output power for both seasons. The cell output electrical power values in winter are slightly higher than them in summer. The largest peak values of 9th March lie around local time 3:30 which corresponding to lower values of 19th July, this due to the maximum attainable heat to the cell from the surrounding adding to the incident radiation around this time.
The total accumulated output cell power value per day in summer is about 505 W/m2.day which higher than its value in winter (431 W/m2.day).
The percentage conversion efficiency of the cell has been evaluated in summer and in winter from the following equation:
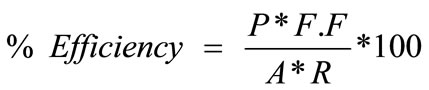 (2)
(2)
where,
P: Cell output power
F.F.: Fill Factor (equals to 0.61)
A: Cell areaand R: Input radiation.
Figure 11 illustrates the percentage conversion efficiency of the cell in both seasons. It is clearly shown that the higher temperature in summer reduces the cell conversion efficiency.
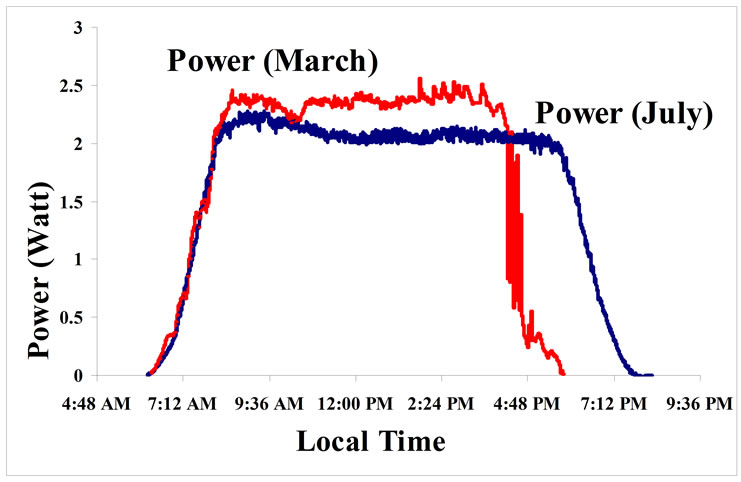
Figure 10. Cell output power in winter and summer.
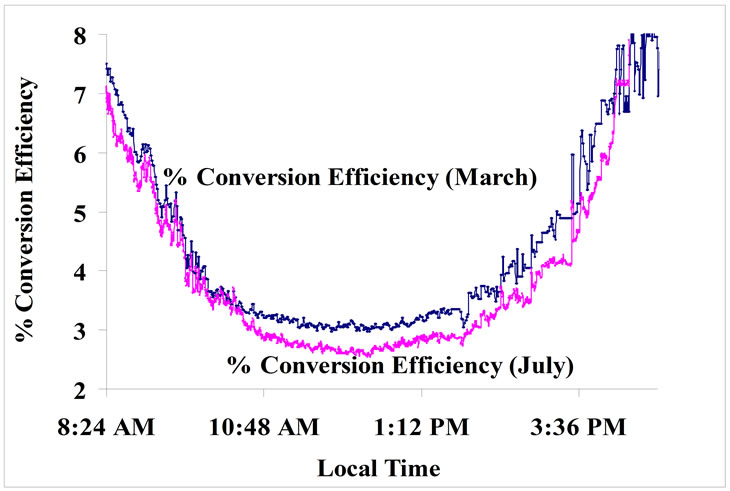
Figure 11. Cell % conversion efficiency in winter and summer.
6. Conclusions
It is concluded that, using the 20 Ampere (Holt HCS-1) current shunt measuring technique prove to be very satisfactory. It is not only very stable under a wide range of ambient temperatures from 5ºC up to 50ºC but also it has an identical linearity equation for all tested temperatures. Therefore, it can be safely used in the desert area to get the solar cell high short circuit currents from its investigated linearity equation. Moreover, applying it in the solar cell measuring circuit does not affect the cell temperature dependency due to its negligible temperature coefficient.
The correlation between the cell winter and summer results is clearly shows that, the cell short circuit current and open circuit voltage values in winter are slightly higher than ones in summer specially around the noon time. In addition, the cell collected radiation values in summer per day are higher than in winter. This means that, the amount of electricity converted by the solar cell during the summer is higher than in winter. Furthermore, it is demonstrated that the conversion efficiency are affected by the ambient temperature.
7. Acknowledgements
The authors would like to thank Dr. A. Ghitas, Dr. M. Sabry from National Research Institute of Astronomy and Geophysics (NRIAG), Egypt and Dr. Y. A. Aziz, Dr. F. Megahed from National Institute for Standards (NIS), Egypt for their cooperation and discussions.
8. REFERENCES
- B. G. Prevo, E. W. Hon and O. D. Velev, “Assembly and Characterization of Colloid Based Antireflective Coatings on Multicrystalline Silicon Solar Cells,” Journal of Materials Chemistry, Vol. 17, No. 8, 2007, pp. 791-799.
- B. Sopori, “Silicon Solar-Cell Processing for Minimizing the Influence of Impurities and Defects,” Journal of Electronic Materials, Vol. 31, No. 10, 2002, pp. 972-980.
- L. A. Dobrzański and A. Drygała, “Surface Texturing of Multicrystalline Silicon Solar Cells,” Journal of Achievements in Materials and Manufacturing Engineering, Vol. 31, No. 1, November 2008, pp. 77-82.
- A. A. Istratov, T. Buonassisi, R. J. McDonald, A. R. Smith, R. Schindler, J. A. Rand, J. P. Kalejs and E. R. Weber, “Metal Content of Multicrystalline Silicon for Solar Cells and Its Impact on Minority Carrier Diffusion Length,” Journal of Applied Physics, Vol. 94, No. 10, November 2003, pp. 6552-6559.
- L. A. Dobrzañski, A. Drygta, P. Panek, M. Lipiñski and P. Ziêba, “Development of the Laser Method of Multicrystalline Silicon Surface Texturization,” Archives of Materials Science and Engineering, Vol. 38, No. 1, July 2009, pp. 5-11.
- P. Panek, M. Lipinski and J. Dutkiewicz, “Texturization of Multicrystalline Silicon by Wet Chemical Etching for Silicon Solar Cells,” Journal of Materials Science, Vol. 40, No. 6, 2005, pp. 1459-1463.
- E. Radziemska, “The Effect of Temperature on the Power Drop in Crystalline Silicon Solar Cells,” Renewable Energy, Vol. 28, No. 1, 2003, pp. 1-12.
- M. Lipiski, P. Ziba and A. Kamiski, “Crystalline Silicon Solar Cells, in Foundation of Materials Design,” Research Signpost Publishers, Kerala, 2006, pp. 285-308.
- W. Jooss, K. Blaschek, R. Toelle, T. M. Bruton, P. Fath and E. Bucher, “17% Back Contact Buried Contact Solar Cells,” Proceedings of 16th European Photovoltaic Solar Energy Conference, Glasgow, 1-5 May 2000, pp. 1124-1127.
- D. L. Meier, H. P. Dabis, A. Shibata, T. Abe, K. Kinoshita, C. Bishop, S. Mahajan, A. Rohatgi, P. Doshi and M. Finnegan, “Self Doping Contacts and Associated Solar Cell Structures,” Proceedings of the 2nd World Conference on Photovoltaic Solar Energy Conversion, Vienna, 6-10 July 1998, pp. 1491-1494.
- K. Faika, M. Wagner, P. Fath and E. Bucher, “Simplification of EWT (Emitter-Wrap Through) Solar Cell Fabrication Using Al-P-Codiffusion,” Proceedings of the 28th IEEE Photovoltaic Specialists Conference, Anchorage, 15-20 September 2000, pp. 260-263.
- A. Kress, P. Fath, G. Willeke and E. Bucher, “Low-Cost Back Contact Silicon Solar Cells Applying the Emitter-Wrap Through (EWT) Concept,” Proceedings of the 2nd World Conference on Photovoltaic Solar Energy Conversion, Vienna, 6-10 July 1998, pp. 1547-1550.
- W. Neu, A. Kress, W. Jooss, P. Fath and E. Bucher, “Low-Cost Multicrystalline Back-Contact Silicon Solar Cells with Screen Printed Metallization,” Solar Energy Materials & Solar Cells, Vol. 74, No. 1, 2002, pp. 139- 146.
- J. H. Bultman, A. W. Weeber, M. W. Brieko, J. Hoonstra, J. A. Dijkstra, A. C. Tip and F. M. Schuurmans, “Pin up Module: A Design for Higher Efficiency, Easy Module Fabrication and Attractive Appearance,” Proceedings of 16th European Photovoltaic Solar Energy Conference, Glasgow, 1-5 May 2000, pp. 1210-1213.
- A. Schonecker, A. Weeber, W. Sinke, C. Zechner, A. Kress and P. Fath, “Attacking Limiting Factors in 10 × 10 cm2 Multicrystalline Silicon, Emitter Wrap-through Solar Cell Design and Processing,” Proceedings of the 2nd World Conference on Photovoltaic Solar Energy Conversion, Vienna, 6-10 July 1998, pp. 1677-1680.
- A. Ghitas and M. Sabry, “Performance of a Large Area Back Contact Silicon Solar Cell in a Desert Zone,” Proceedings of Cairo 11th International Conference on Energy and Environment, Hurghada, 15-18 March 2009.
- H. A. Mageed, A. Zobaa, A. Ghitas, M. Helmy, M. Sabry, A. A. Rahman and M. M. A. Aziz, “Electrical Performance Study of a Large Area Multicrystalline Silicon Solar Cell Using a Current Shunt and a Micropotentiometer,” Engineering, Vol. 2, No. 4, April 2010, pp. 263-269.
- R. G. Jones, P. Clarkson and A. J. Wheaton, “Calibration of AC Current Shunts,” Precision Electromagnetic Measurements Conference Digest, Sydney, 14-19 May 2000, pp. 492-493.
- H. K. Elminir, A. E. Ghitas, F. El-Hussainy, R. Hamid, M. M. Beheary and K. M. Abdel-Moneim, “Optimum Solar Flat-Plate Collector Slope: Case Study for Helwan, Egypt,” Energy Conversion & Management, Vol. 47, No. 5, 2006, pp. 624-637.
- D. E. Destefan and R. S. Stant, “AC and DC Shunts-Can You Believe Their Specs?” Proceedings of the 20th IEEE Instrumentation and Measurement Technology Conference, Vail, Vol. 2, 20-22 May 2003, pp. 1577-1582.
- C. Xiao, L. Zhao, T. Asada, W. G. Odendaal and J. D. van Wyk, “An Overview of Integratable Current Sensor Technologies,” Conference Record of the 38th IEEE Industry Applications Society Annual Meeting, Salt Lake City, Vol. 2, 12-16 October 2003, pp. 1251-1258.
- American Society for Metals International, “Metals Handbook: StainlessStecls.001 Materials and Special Purpose Metals,” 9th Edition, Vol. 3, ASM International, Metals Park, pp. 640-645.
- T. E. Lipe, “Operation and Reference Manual for the NIST Automated AC-DC Calibration Systems and Software,” National Institute of Standards and Technology Special Publication 250-61, National Institute of Standards and Technology, Fort Collins, May 2004.
- K. Lind, T. Sorsdal and H. Slinde, “Design, Modeling, and Verification of High-Performance AC-DC Current Shunts from Inexpensive Components,” IEEE Transactions on Instrumentation Measurement, Vol. 57, No. 1, January 2008, pp. 176-181.