Paper Menu >>
Journal Menu >>
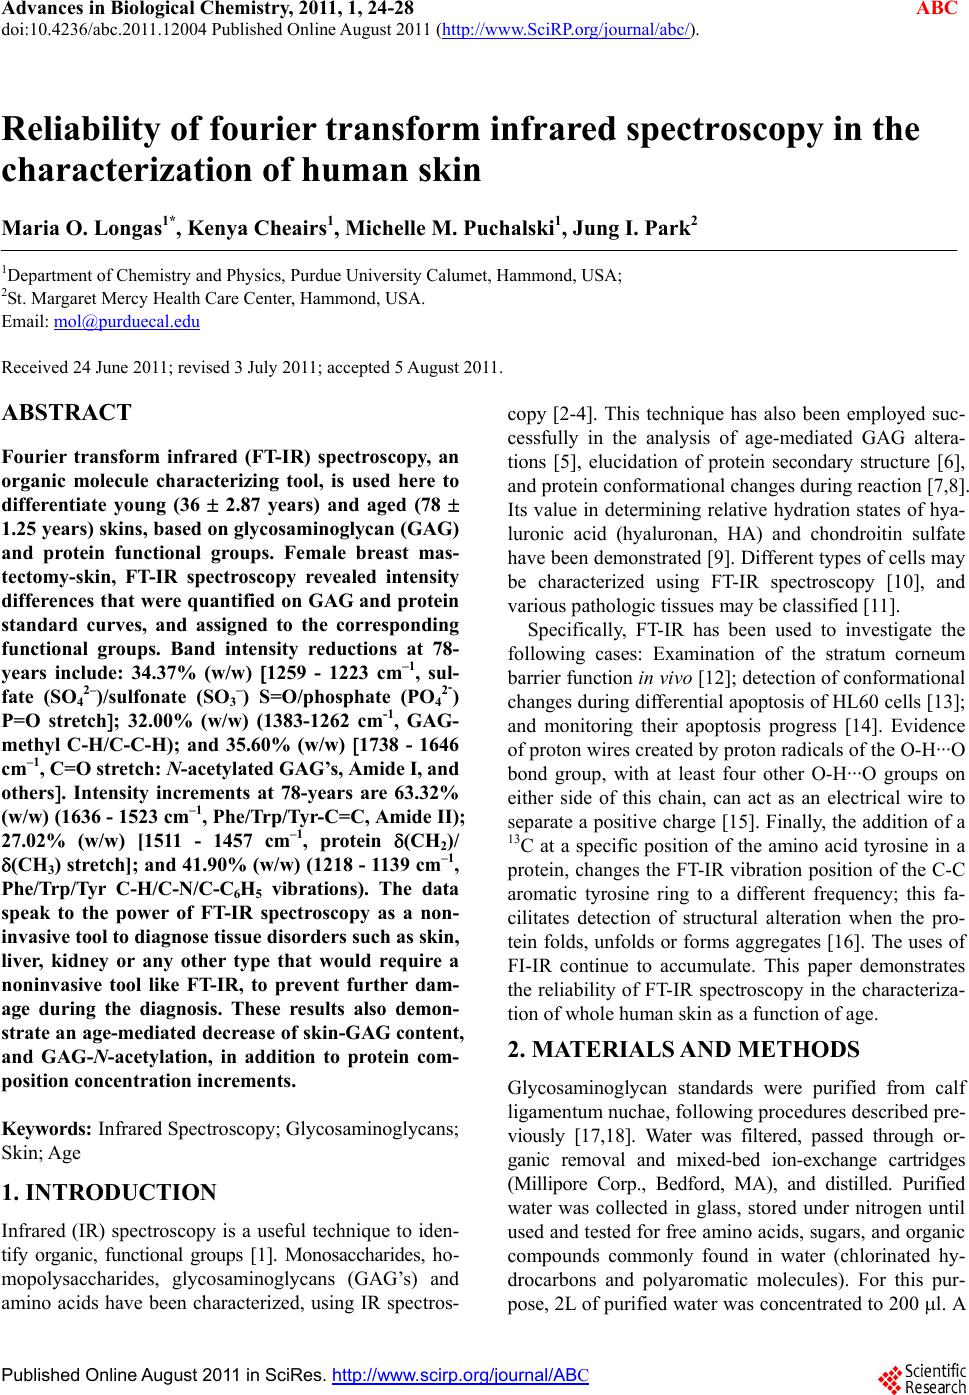 Advances in Biological Chemistry, 2011, 1, 24-28 ABC doi:10.4236/abc.2011.12004 Published Online August 2011 (http://www.SciRP.org/journal/abc/). Published Online August 2011 in SciRes. http://www.scirp.org/journal/ABC Reliability of fourier transform infrared spectroscopy in the characterization of human skin Maria O. Longas1*, Kenya Cheairs1, Michelle M. Puchalski1, Jung I. Park2 1Department of Chemistry and Physics, Purdue University Calumet, Hammond, USA; 2St. Margaret Mercy Health Care Center, Hammond, USA. Email: mol@purduecal.edu Received 24 June 2011; revised 3 July 2011; accepted 5 August 2011. ABSTRACT Fourier transform infrared (FT-IR) spectroscopy, an organic molecule characterizing tool, is used here to differentiate young (36 2.87 years) and aged (78 1.25 years) skins, based on glycosaminoglycan (GAG) and protein functional groups. Female breast mas- tectomy-skin, FT-IR spectroscopy revealed intensity differences that were quantified on GAG and protein standard curves, and assigned to the corresponding functional groups. Band intensity reductions at 78- years include: 34.37% (w/w) 1259 - 1223 cm–1, sul- fate (SO42–)/sulfonate (SO3–) S=O/phosphate (PO42־) P=O stretch; 32.00% (w/w) (1383-1262 cm-1, GAG- methyl C-H/C-C-H); and 35.60% (w/w) 1738 - 1646 cm–1, C=O stretch: N-acetylated GAG’ s, Amide I , and others. Intensity increments at 78-years are 63.32% (w/w) (1636 - 1523 cm–1, Phe/Trp/ Tyr -C=C, Amide II); 27.02% (w/w) [1511 - 1457 cm–1, protein (CH2)/ (CH3) stretch]; and 41.90% (w/w) (1218 - 1139 cm–1, Phe/Trp/Tyr C-H/C-N/C-C6H5 vibrations). The data speak to the power of FT-IR spectroscopy as a non- invasive tool to diagnose tissue disorders such as skin, liver, kidney or any other type that would require a noninvasive tool like FT-IR, to prevent further dam- age during the diagnosis. These results also demon- strate an age-mediated decrease of skin-GAG content, and GAG-N-acetylation, in addition to protein com- position concentration increments. Keywords: Infrared Spectroscopy; Glycosaminoglycans; Skin; Age 1. INTRODUCTION Infrared (IR) spectroscopy is a useful technique to iden- tify organic, functional groups [1]. Monosaccharides, ho- mopolysaccharides, glycosaminoglycans (GAG’s) and amino acids have been characterized, using IR spectros- copy [2-4]. This technique has also been employed suc- cessfully in the analysis of age-mediated GAG altera- tions [5], elucidation of protein secondary structure [6], and protein conformational changes during reaction [7,8]. Its value in determining relative hydration states of hya- luronic acid (hyaluronan, HA) and chondroitin sulfate have been demonstrated [9]. Different types of cells may be characterized using FT-IR spectroscopy [10], and various pathologic tissues may be classified [11]. Specifically, FT-IR has been used to investigate the following cases: Examination of the stratum corneum barrier function in vivo [12]; detection of conformational changes during differential apoptosis of HL60 cells [13]; and monitoring their apoptosis progress [14]. Evidence of proton wires created by proton radicals of the O-H···O bond group, with at least four other O-H···O groups on either side of this chain, can act as an electrical wire to separate a positive charge [15]. Finally, the addition of a 13C at a specific position of the amino acid tyrosine in a protein, changes the FT-IR vibration position of the C-C aromatic tyrosine ring to a different frequency; this fa- cilitates detection of structural alteration when the pro- tein folds, unfolds or forms aggregates [16]. The uses of FI-IR continue to accumulate. This paper demonstrates the reliability of FT-IR spectroscopy in the characteriza- tion of whole human skin as a function of age. 2. MATERIALS AND METHODS Glycosaminoglycan standards were purified from calf ligamentum nuchae, following procedures described pre- viously [17,18]. Water was filtered, passed through or- ganic removal and mixed-bed ion-exchange cartridges (Millipore Corp., Bedford, MA), and distilled. Purified water was collected in glass, stored under nitrogen until used and tested for free amino acids, sugars, and organic compounds commonly found in water (chlorinated hy- drocarbons and polyaromatic molecules). For this pur- pose, 2L of purified water was concentrated to 200 l. A 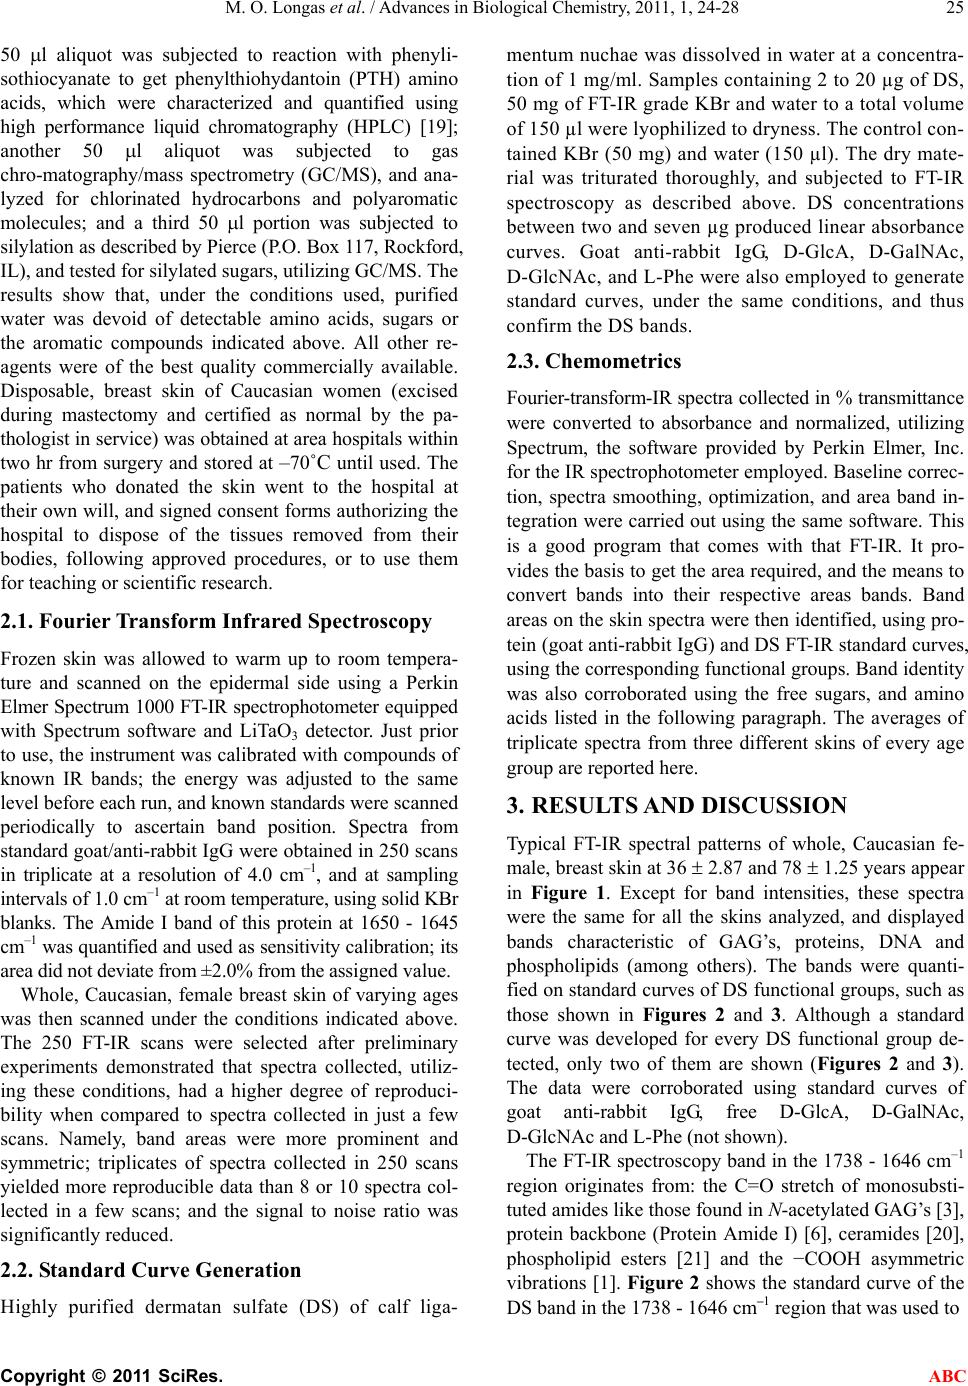 M. O. Longas et al. / Advances in Biological Chemistry, 2011, 1, 24-28 Copyright © 2011 SciRes. ABC 25 50 l aliquot was subjected to reaction with phenyli- sothiocyanate to get phenylthiohydantoin (PTH) amino acids, which were characterized and quantified using high performance liquid chromatography (HPLC) [19]; another 50 l aliquot was subjected to gas chro-matography/mass spectrometry (GC/MS), and ana- lyzed for chlorinated hydrocarbons and polyaromatic molecules; and a third 50 l portion was subjected to silylation as described by Pierce (P.O. Box 117, Rockford, IL), and tested for silylated sugars, utilizing GC/MS. The results show that, under the conditions used, purified water was devoid of detectable amino acids, sugars or the aromatic compounds indicated above. All other re- agents were of the best quality commercially available. Disposable, breast skin of Caucasian women (excised during mastectomy and certified as normal by the pa- thologist in service) was obtained at area hospitals within two hr from surgery and stored at –70˚C until used. The patients who donated the skin went to the hospital at their own will, and signed consent forms authorizing the hospital to dispose of the tissues removed from their bodies, following approved procedures, or to use them for teaching or scientific research. 2.1. Fourier Transform Infrared Spectroscopy Frozen skin was allowed to warm up to room tempera- ture and scanned on the epidermal side using a Perkin Elmer Spectrum 1000 FT-IR spectrophotometer equipped with Spectrum software and LiTaO3 detector. Just prior to use, the instrument was calibrated with compounds of known IR bands; the energy was adjusted to the same level before each run, and known standards were scanned periodically to ascertain band position. Spectra from standard goat/anti-rabbit IgG were obtained in 250 scans in triplicate at a resolution of 4.0 cm–1, and at sampling intervals of 1.0 cm–1 at room temperature, using solid KBr blanks. The Amide I band of this protein at 1650 - 1645 cm–1 was quantified and used as sensitivity calibration; its area did not deviate from ±2.0% from the assigned value. Whole, Caucasian, female breast skin of varying ages was then scanned under the conditions indicated above. The 250 FT-IR scans were selected after preliminary experiments demonstrated that spectra collected, utiliz- ing these conditions, had a higher degree of reproduci- bility when compared to spectra collected in just a few scans. Namely, band areas were more prominent and symmetric; triplicates of spectra collected in 250 scans yielded more reproducible data than 8 or 10 spectra col- lected in a few scans; and the signal to noise ratio was significantly reduced. 2.2. Standard Curve Generation Highly purified dermatan sulfate (DS) of calf liga- mentum nuchae was dissolved in water at a concentra- tion of 1 mg/ml. Samples containing 2 to 20 µg of DS, 50 mg of FT-IR grade KBr and water to a total volume of 150 µl were lyophilized to dryness. The control con- tained KBr (50 mg) and water (150 µl). The dry mate- rial was triturated thoroughly, and subjected to FT-IR spectroscopy as described above. DS concentrations between two and seven µg produced linear absorbance curves. Goat anti-rabbit IgG, D-GlcA, D-GalNAc, D-GlcNAc, and L-Phe were also employed to generate standard curves, under the same conditions, and thus confirm the DS bands. 2.3. Chemometrics Fourier-transform-IR spectra collected in % transmittance were converted to absorbance and normalized, utilizing Spectrum, the software provided by Perkin Elmer, Inc. for the IR spectrophotometer employed. Baseline correc- tion, spectra smoothing, optimization, and area band in- tegration were carried out using the same software. This is a good program that comes with that FT-IR. It pro- vides the basis to get the area required, and the means to convert bands into their respective areas bands. Band areas on the skin spectra were then identified, using pro- tein (goat anti-rabbit IgG) and DS FT-IR standard curves, using the corresponding functional groups. Band identity was also corroborated using the free sugars, and amino acids listed in the following paragraph. The averages of triplicate spectra from three different skins of every age group are reported here. 3. RESULTS AND DISCUSSION Typical FT-IR spectral patterns of whole, Caucasian fe- male, breast skin at 36 2.87 and 78 1.25 years appear in Figure 1. Except for band intensities, these spectra were the same for all the skins analyzed, and displayed bands characteristic of GAG’s, proteins, DNA and phospholipids (among others). The bands were quanti- fied on standard curves of DS functional groups, such as those shown in Figures 2 and 3. Although a standard curve was developed for every DS functional group de- tected, only two of them are shown (Figures 2 and 3). The data were corroborated using standard curves of goat anti-rabbit IgG, free D-GlcA, D-GalNAc, D-GlcNAc and L-Phe (not shown). The FT-IR spectroscopy band in the 1738 - 1646 cm–1 region originates from: the C=O stretch of monosubsti- tuted amides like those found in N-acetylated GAG’s [3], protein backbone (Protein Amide I) [6], ceramides [20], phospholipid esters [21] and the −COOH asymmetric vibrations [1]. Figure 2 shows the standard curve of the DS band in the 1738 - 1646 cm–1 region that was used to 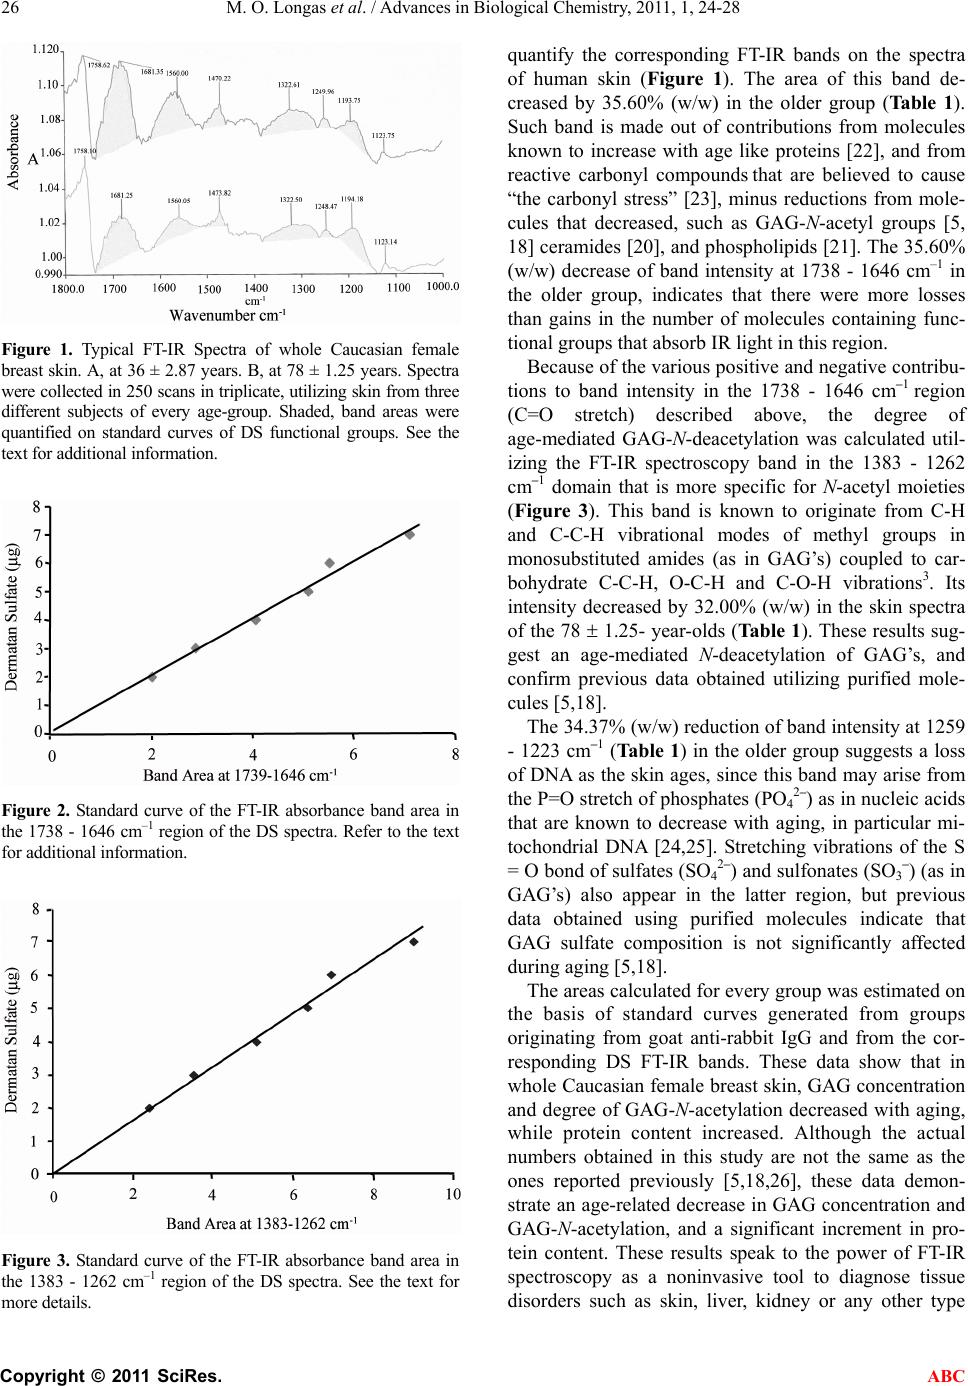 M. O. Longas et al. / Advances in Biological Chemistry, 2011, 1, 24-28 Copyright © 2011 SciRes. ABC 26 Figure 1. Typical FT-IR Spectra of whole Caucasian female breast skin. A, at 36 ± 2.87 years. B, at 78 ± 1.25 years. Spectra were collected in 250 scans in triplicate, utilizing skin from three different subjects of every age-group. Shaded, band areas were quantified on standard curves of DS functional groups. See the text for additional information. Figure 2. Standard curve of the FT-IR absorbance band area in the 1738 - 1646 cm–1 region of the DS spectra. Refer to the text for additional information. Figure 3. Standard curve of the FT-IR absorbance band area in the 1383 - 1262 cm–1 region of the DS spectra. See the text for more details. quantify the corresponding FT-IR bands on the spectra of human skin (Figure 1). The area of this band de- creased by 35.60% (w/w) in the older group (Ta bl e 1 ). Such band is made out of contributions from molecules known to increase with age like proteins [22], and from reactive carbonyl compounds that are believed to cause “the carbonyl stress” [23], minus reductions from mole- cules that decreased, such as GAG-N-acetyl groups [5, 18] ceramides [20], and phospholipids [21]. The 35.60% (w/w) decrease of band intensity at 1738 - 1646 cm–1 in the older group, indicates that there were more losses than gains in the number of molecules containing func- tional groups that absorb IR light in this region. Because of the various positive and negative contribu- tions to band intensity in the 1738 - 1646 cm–1 region (C=O stretch) described above, the degree of age-mediated GAG-N-deacetylation was calculated util- izing the FT-IR spectroscopy band in the 1383 - 1262 cm–1 domain that is more specific for N-acetyl moieties (Figure 3). This band is known to originate from C-H and C-C-H vibrational modes of methyl groups in monosubstituted amides (as in GAG’s) coupled to car- bohydrate C-C-H, O-C-H and C-O-H vibrations3. Its intensity decreased by 32.00% (w/w) in the skin spectra of the 78 1.25- year-olds (Table 1). These results sug- gest an age-mediated N-deacetylation of GAG’s, and confirm previous data obtained utilizing purified mole- cules [5,18]. The 34.37% (w/w) reduction of band intensity at 1259 - 1223 cm–1 (Ta ble 1) in the older group suggests a loss of DNA as the skin ages, since this band may arise from the P=O stretch of phosphates (PO4 2–) as in nucleic acids that are known to decrease with aging, in particular mi- tochondrial DNA [24,25]. Stretching vibrations of the S = O bond of sulfates (SO4 2–) and sulfonates (SO3–) (as in GAG’s) also appear in the latter region, but previous data obtained using purified molecules indicate that GAG sulfate composition is not significantly affected during aging [5,18]. The areas calculated for every group was estimated on the basis of standard curves generated from groups originating from goat anti-rabbit IgG and from the cor- responding DS FT-IR bands. These data show that in whole Caucasian female breast skin, GAG concentration and degree of GAG-N-acetylation decreased with aging, while protein content increased. Although the actual numbers obtained in this study are not the same as the ones reported previously [5,18,26], these data demon- strate an age-related decrease in GAG concentration and GAG-N-acetylation, and a significant increment in pro- tein content. These results speak to the power of FT-IR spectroscopy as a noninvasive tool to diagnose tissue disorders such as skin, liver, kidney or any other type 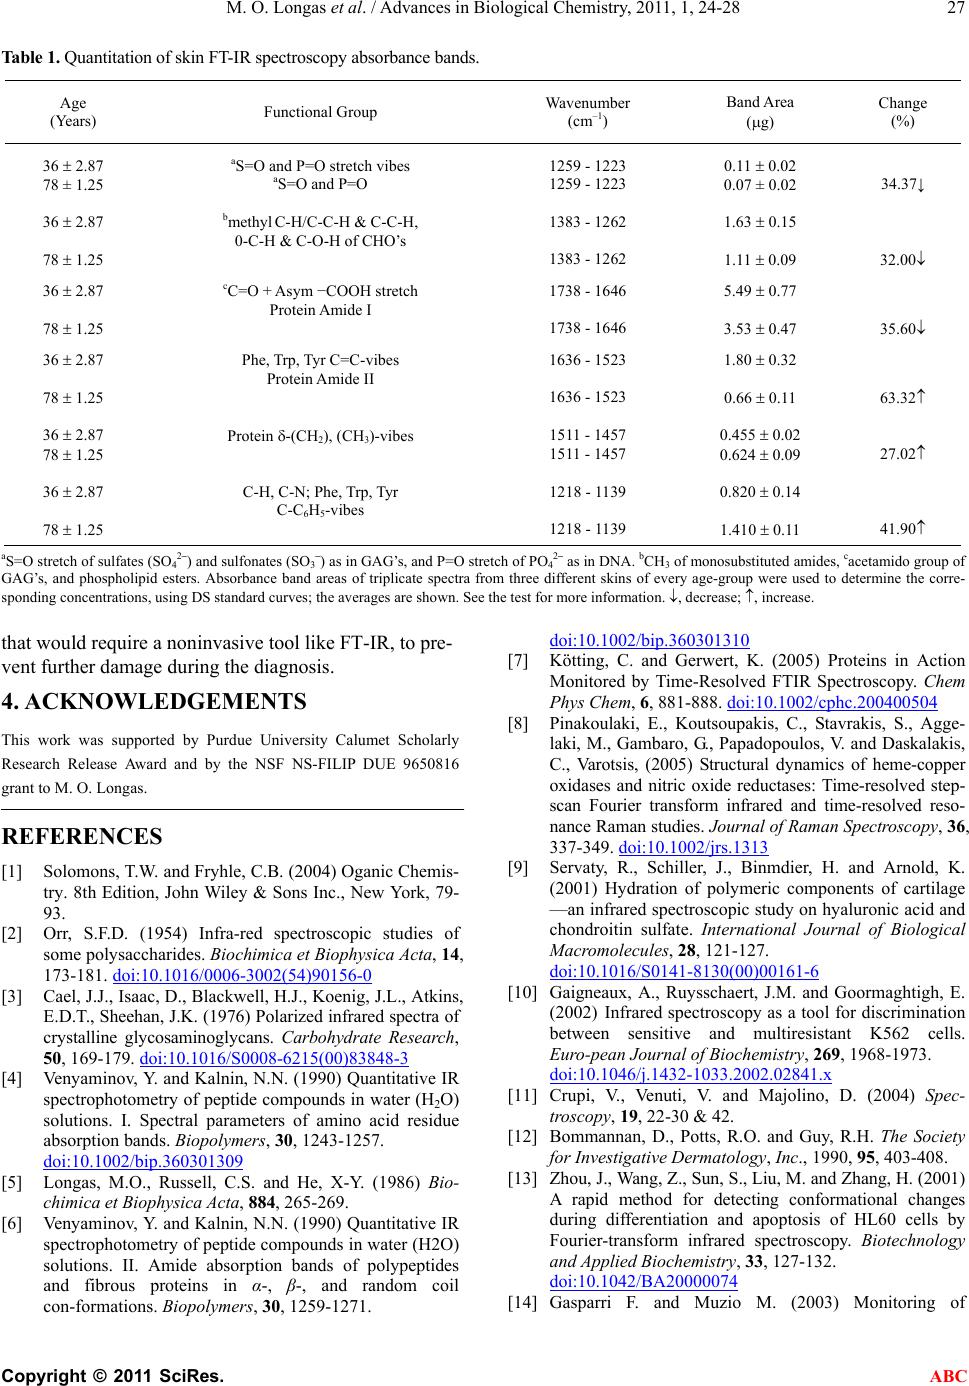 M. O. Longas et al. / Advances in Biological Chemistry, 2011, 1, 24-28 Copyright © 2011 SciRes. ABC 27 Table 1. Quantitation of skin FT-IR spectroscopy absorbance bands. Age (Years) Functional Group Wavenumber (cm–1) Band Area (g) Change (%) 36 2.87 78 ± 1.25 aS=O and P=O stretch vibes aS=O and P=O 1259 - 1223 1259 - 1223 0.11 0.02 0.07 ± 0.02 34.37↓ 36 2.87 78 1.25 bmethyl C-H/C-C-H & C-C-H, 0-C-H & C-O-H of CHO’s 1383 - 1262 1383 - 1262 1.63 0.15 1.11 0.09 32.00 36 2.87 78 1.25 cC=O + Asym −COOH stretch Protein Amide I 1738 - 1646 1738 - 1646 5.49 0.77 3.53 0.47 35.60 36 2.87 78 1.25 Phe, Trp, Tyr C=C-vibes Protein Amide II 1636 - 1523 1636 - 1523 1.80 0.32 0.66 0.11 63.32 36 2.87 78 1.25 Protein -(CH2), (CH3)-vibes 1511 - 1457 1511 - 1457 0.455 0.02 0.624 0.09 27.02 36 2.87 78 1.25 C-H, C-N; Phe, Trp, Tyr C-C6H5-vibes 1218 - 1139 1218 - 1139 0.820 0.14 1.410 0.11 41.90 aS=O stretch of sulfates (SO42–) and sulfonates (SO3–) as in GAG’s, and P=O stretch of PO42– as in DNA. bCH3 of monosubstituted amides, cacetamido group of GAG’s, and phospholipid esters. Absorbance band areas of triplicate spectra from three different skins of every age-group were used to determine the corre- sponding concentrations, using DS standard curves; the averages are shown. See the test for more information. , decrease; , increase. that would require a noninvasive tool like FT-IR, to pre- vent further damage during the diagnosis. 4. ACKNOWLEDGEMENTS This work was supported by Purdue University Calumet Scholarly Research Release Award and by the NSF NS-FILIP DUE 9650816 grant to M. O. Longas. REFERENCES [1] Solomons, T.W. and Fryhle, C.B. (2004) Oganic Chemis- try. 8th Edition, John Wiley & Sons Inc., New York, 79- 93. [2] Orr, S.F.D. (1954) Infra-red spectroscopic studies of some polysaccharides. Biochimica et Biophysica Acta, 14, 173-181. doi:10.1016/0006-3002(54)90156-0 [3] Cael, J.J., Isaac, D., Blackwell, H.J., Koenig, J.L., Atkins, E.D.T., Sheehan, J.K. (1976) Polarized infrared spectra of crystalline glycosaminoglycans. Carbohydrate Research, 50, 169-179. doi:10.1016/S0008-6215(00)83848-3 [4] Venyaminov, Y. and Kalnin, N.N. (1990) Quantitative IR spectrophotometry of peptide compounds in water (H2O) solutions. I. Spectral parameters of amino acid residue absorption bands. Biopolymers, 30, 1243-1257. doi:10.1002/bip.360301309 [5] Longas, M.O., Russell, C.S. and He, X-Y. (1986) Bio- chimica et Biophysica Acta, 884, 265-269. [6] Venyaminov, Y. and Kalnin, N.N. (1990) Quantitative IR spectrophotometry of peptide compounds in water (H2O) solutions. II. Amide absorption bands of polypeptides and fibrous proteins in α-, β-, and random coil con-formations. Biopolymers, 30, 1259-1271. doi:10.1002/bip.360301310 [7] Kötting, C. and Gerwert, K. (2005) Proteins in Action Monitored by Time-Resolved FTIR Spectroscopy. Chem Phys Chem, 6, 881-888. doi:10.1002/cphc.200400504 [8] Pinakoulaki, E., Koutsoupakis, C., Stavrakis, S., Agge- laki, M., Gambaro, G., Papadopoulos, V. and Daskalakis, C., Varotsis, (2005) Structural dynamics of heme-copper oxidases and nitric oxide reductases: Time-resolved step- scan Fourier transform infrared and time-resolved reso- nance Raman studies. Journal of Raman Spectroscopy, 36, 337-349. doi:10.1002/jrs.1313 [9] Servaty, R., Schiller, J., Binmdier, H. and Arnold, K. (2001) Hydration of polymeric components of cartilage —an infrared spectroscopic study on hyaluronic acid and chondroitin sulfate. International Journal of Biological Macromolecules, 28, 121-127. doi:10.1016/S0141-8130(00)00161-6 [10] Gaigneaux, A., Ruysschaert, J.M. and Goormaghtigh, E. (2002) Infrared spectroscopy as a tool for discrimination between sensitive and multiresistant K562 cells. Euro-pean Journal of Biochemistry, 269, 1968-1973. doi:10.1046/j.1432-1033.2002.02841.x [11] Crupi, V., Venuti, V. and Majolino, D. (2004) Spec- troscopy, 19, 22-30 & 42. [12] Bommannan, D., Potts, R.O. and Guy, R.H. The Society for Investigative Dermatology, Inc., 1990, 95, 403-408. [13] Zhou, J., Wang, Z., Sun, S., Liu, M. and Zhang, H. (2001) A rapid method for detecting conformational changes during differentiation and apoptosis of HL60 cells by Fourier-transform infrared spectroscopy. Biotechnology and Applied Biochemistry, 33, 127-132. doi:10.1042/BA20000074 [14] Gasparri F. and Muzio M. (2003) Monitoring of  M. O. Longas et al. / Advances in Biological Chemistry, 2011, 1, 24-28 Copyright © 2011 SciRes. ABC 28 apoptosis of HL60 cells by Fourier-transform infrared spectroscopy. Biochemical Journal, 369, 239-248. doi:10.1042/BJ20021021 [15] Stoyanov, E.S., Stoyankova, I.V. and Reed C.A. (2008) IR Spectroscopic Properties of H(MeOH)n + Clusters in the Liquid Phase: Evidence for a Proton Wire. European Journal of Chemistry, 14, 3596-3604. doi:10.1002/chem.200701746 [16] Beyermannn, M., Tremmel, S., Oschkinat, H., Bienert, M. and Hainz, F. (2005) spectroscopyNOW.com [17] Meyer, K. (1958) Fed Proc. 17, 1075-1077. [18] Longas, M.O., Russell, C.S., He, X-Y. (1987) Evidence for structural changes in dermatan sulfate and hyaluronic acid with aging. Carbohydrate Research, 159, 127-136. doi:10.1016/S0008-6215(00)90010-7 [19] Tsunasawa, S., Kondo, J. and Sakiyama, F.J. (1985) Biochemistry, 97, 701-704. [20] Coderch, L., López, O., Maza, A. and Parra, J.L. (2003) Ceramides and Skin, 4,107-129. [21] Schroeder, F., Goetz, I. and Roberts, E. (1984) Age-related alterations in cultured human fibroblast membrane structure and function. Mechanisms of Ageing and Development, 25, 365-389. doi:10.1016/0047-6374(84)90010-1 [22] Gniadecka, M.,Nielsen, O.F., Christensen, D.H. and Wulf, H. (1998) Structure of water, proteins, and lipids in intact human skin, hair, and nail. Journal of Investigative Der- matology, 110, 393-398. doi:10.1046/j.1523-1747.1998.00146.x [23] Schleicher, E.D., Bierhaus, A., Häring, H-U., Nawroth, P.P. and Lehmann, R. (2001) In: D’Angelo, A., Favaro, S. and Gambaro, G. Eds., Chemistry and Pathology of Ad- vanced Glycation End Products, Advanced Glycation End Products in Nephrology, Contrib. Nephrol., Basel, 139, 1-9. [24] Proksch, E., Feingold, K.R., Man, M.Q. and Elias, P.M. (1991) Journal of Clinical Investigation, 87, 1668-1673. doi:10.1172/JCI115183 [25] Alexeyev, M.F., LeDoux, S.P. and Wilson, G.L. (2004) Barrier function regulates epidermal DNA synthesis. Clinical Science, 107, 355-364. doi:10.1042/CS20040148 [26] Rocquet, C. and Bonté, F. (2002) Acta Derma- tovenerologica Alpina, Pannonica Et Adriatica, 11, 1-59. Abbreviations DS: dermatan sulphate; DNA: deoxyribonucleic acid; FT-IR: Fourier transform infrared; GC/MS: gas chromatography/mass spectrometry; GAG: glycosaminoglycan; HA: hyaluronic acid, hyaluronan |