 Materials Sciences and Application, 2011, 2, 1083-1089 doi:10.4236/msa.2011.28146 Published Online August 2011 (http://www.SciRP.org/journal/msa) Copyright © 2011 SciRes. MSA 1083 Electrical Transport Properties of Bi2O3-Doped CoFe2O4 and CoHo0.02Fe1.98O4 Ferrites Hasan Mehmood Khan*, Misbah-ul-Islam, Irshad Ali, Mazhar-ud-din Rana Department of Physics, Bahauddin Zakariya University Multan, Multan, Pakistan. Email: *hasan_bzu@yahoo.com Received March 19th, 2011; revised April 26th, 2011; accepted May 6th, 2011. ABSTRACT Two series of CoHoxFe2-x O4 (x = 0.0, 0.02) ferrites with Bismuth oxide doping from (0.1 - 0.3)% were prepared by Co-precipitation technique. X-ray diffraction analysis revealed fcc structure. The lattice constants were found to de- crease as the doping of Bi2O3 increases in both series. An increase in Bismuth oxide concentration from (0.1 - 0.3%) in CoFe2O4, and CoHo0.02Fe1.98O4 ferrites leads to an increase in room temperature resistivity. Temperature dependent re- sistivity decreases as the temperature increases following the Arrhenius equation. The activation energy increases with the increase of Bi2O3-concentration for both CoFe2O4 and CoHo0.02Fe1.98O4 series. The frequency dependant dielectric constant follows the Maxwell-Wagner type interfacial polarization. The dielectric loss indicates the normal behavior of these ferrites. SEM analysis shows an increase in grain size with increasing Bismuth concentration. Keywords: Cobalt Ferrites, Co-Precipitation, Bi Doping, Electrical Properties 1. Introduction The miniaturization of electrical and electronic gadgets demands new materials with nano-size particles for high frequency applications and high density recording. Bi2O3 is a potential dopant for improving the magnetic and electrical properties of ferrites. The properties of ferrite materials are known to be strongly influenced by their composition and microstructure which are sensitive to the processing methods used to synthesize them. Over the last decade, the magnetostrictive materials for smart sensors have attracted a great interest due to their wide range of applications in the automotive industry. The cobalt ferrites are well known for its highest magne- tostrictive coefficient amongst the oxide-based magne- tostrictive materials. Cobalt ferrite nanoparticles have recently become the subject of research interest from the point of view of the synthesis, the magnetic characteriza- tion, and the applications [1-4]. Among the various fer- rite materials for magnetic recording applications, cobalt ferrite (CoFe2O4) has been widely studied [5]. Cobalt ferrite (CoFe2O4) possesses excellent chemical stability, good mechanical hardness and a large positive first-order crystalline anisotropy constant, which made this ferrite a promising candidate for magneto-optical recording media [6]. High electrical resistivity and low eddy current losses make these ferrites an excellent core material for power transformers in electrical and electronic industry, recording heads, antenna rods, loading coils, microwave devices and telecommunication applications [7,8].The magnetic properties of ferrites can be modified by intro- ducing suitable divalent and trivalent oxides as dopants [9]. It is reported [10] the dc electrical conductivity of the Bi2O3-doped ferrites was increased. Bi2O3 is an alterna- tive sintering aid for lowering sintering temperature of magnesium ferrites. The addition of Bi2O3 has significant effect on the resistivity and dielectric properties of fer- rites. Moreover the advantageous effect of Bi2O3 is at- tributed to the formation of liquid phase layer due to the low melting point of Bi2O3 [11] which enhances the re- sistivity of the ferrites. Due to the presence of Bi2O3 the properties of grain boundaries of ferrite were changed and three dimensional network grain boundary structure formed at grain boundaries [12-15]. Since Bi2O3 doping enhances the magnetic and electrical properties of the ferrites, the purpose of this study is to investigate the influence of the Bi2O3 doping from 0.1-0.3% by weight on the microstructure, electrical and magnetic properties of CoFe2O4 and CoHo0.02Fe1.98O4 ferrites. The CoHo0.02- Fe1.98O4 was chosen for comparison between CoFe2O4 and the Rare earth substituted CoHo0.02Fe1.98O4 ferrites after doping Bi2O3 . 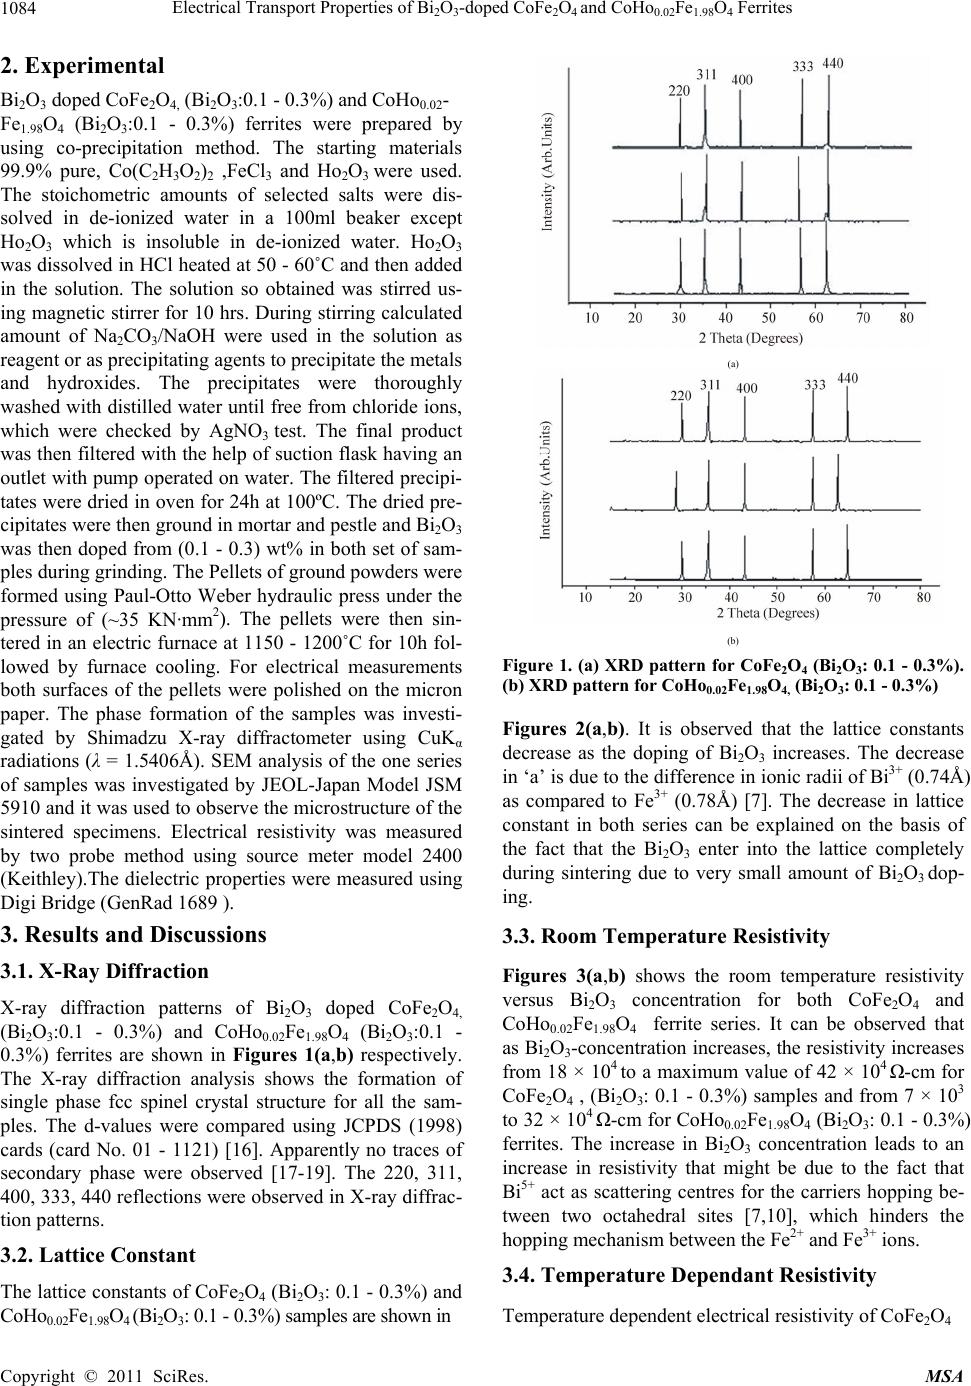 Electrical Transport Properties of BiO-doped CoFeOand CoHoFe O Ferrites 1084 2324 0.021.984 2. Experimental Bi2O3 doped CoFe2O4, (Bi2O3:0.1 - 0.3%) and CoHo0.02- Fe1.98O4 (Bi2O3:0.1 - 0.3%) ferrites were prepared by using co-precipitation method. The starting materials 99.9% pure, Co(C2H3O2)2 ,FeCl3 and Ho2O3 were used. The stoichometric amounts of selected salts were dis- solved in de-ionized water in a 100ml beaker except Ho2O3 which is insoluble in de-ionized water. Ho2O3 was dissolved in HCl heated at 50 - 60˚C and then added in the solution. The solution so obtained was stirred us- ing magnetic stirrer for 10 hrs. During stirring calculated amount of Na2CO3/NaOH were used in the solution as reagent or as precipitating agents to precipitate the metals and hydroxides. The precipitates were thoroughly washed with distilled water until free from chloride ions, which were checked by AgNO3 test. The final product was then filtered with the help of suction flask having an outlet with pump operated on water. The filtered precipi- tates were dried in oven for 24h at 100ºC. The dried pre- cipitates were then ground in mortar and pestle and Bi2O3 was then doped from (0.1 - 0.3) wt% in both set of sam- ples during grinding. The Pellets of ground powders were formed using Paul-Otto Weber hydraulic press under the pressure of (~35 KN·mm2). The pellets were then sin- tered in an electric furnace at 1150 - 1200˚C for 10h fol- lowed by furnace cooling. For electrical measurements both surfaces of the pellets were polished on the micron paper. The phase formation of the samples was investi- gated by Shimadzu X-ray diffractometer using CuKα radiations (λ = 1.5406Å). SEM analysis of the one series of samples was investigated by JEOL-Japan Model JSM 5910 and it was used to observe the microstructure of the sintered specimens. Electrical resistivity was measured by two probe method using source meter model 2400 (Keithley).The dielectric properties were measured using Digi Bridge (GenRad 1689 ). 3. Results and Discussions 3.1. X-Ray Diffraction X-ray diffraction patterns of Bi2O3 doped CoFe2O4, (Bi2O3:0.1 - 0.3%) and CoHo0.02Fe1.98O4 (Bi2O3:0.1 - 0.3%) ferrites are shown in Figures 1(a,b) respectively. The X-ray diffraction analysis shows the formation of single phase fcc spinel crystal structure for all the sam- ples. The d-values were compared using JCPDS (1998) cards (card No. 01 - 1121) [16]. Apparently no traces of secondary phase were observed [17-19]. The 220, 311, 400, 333, 440 reflections were observed in X-ray diffrac- tion patterns. 3.2. Lattice Constant The lattice constants of CoFe2O4 (Bi2O3: 0.1 - 0.3%) and CoHo0.02Fe1.98O4 (Bi2O3: 0.1 - 0.3%) samples are shown in (a) (b) Figure 1. (a) XRD pattern for CoFe2O4 (Bi2O3: 0.1 - 0.3%). (b) XRD pattern for CoHo0.02Fe1.98O4, (Bi2O3: 0.1 - 0.3%) Figures 2(a,b). It is observed that the lattice constants decrease as the doping of Bi2O3 increases. The decrease in ‘a’ is due to the difference in ionic radii of Bi3+ (0.74Å) as compared to Fe3+ (0.78Å) [7]. The decrease in lattice constant in both series can be explained on the basis of the fact that the Bi2O3 enter into the lattice completely during sintering due to very small amount of Bi2O3 dop- ing. 3.3. Room Temperature Resistivity Figures 3(a,b) shows the room temperature resistivity versus Bi2O3 concentration for both CoFe2O4 and CoHo0.02Fe1.98O4 ferrite series. It can be observed that as Bi2O3-concentration increases, the resistivity increases from 18 × 104 to a maximum value of 42 × 104 Ω-cm for CoFe2O4 , (Bi2O3: 0.1 - 0.3%) samples and from 7 × 10³ to 32 × 104 Ω-cm for CoHo0.02Fe1.98O4 (Bi2O3: 0.1 - 0.3%) ferrites. The increase in Bi2O3 concentration leads to an increase in resistivity that might be due to the fact that Bi5+ act as scattering centres for the carriers hopping be- tween two octahedral sites [7,10], which hinders the hopping mechanism between the Fe2+ and Fe3+ ions. 3.4. Temperature Dependant Resistivity Temperature dependent electrical resistivity of CoFe2O4 Copyright © 2011 SciRes. MSA 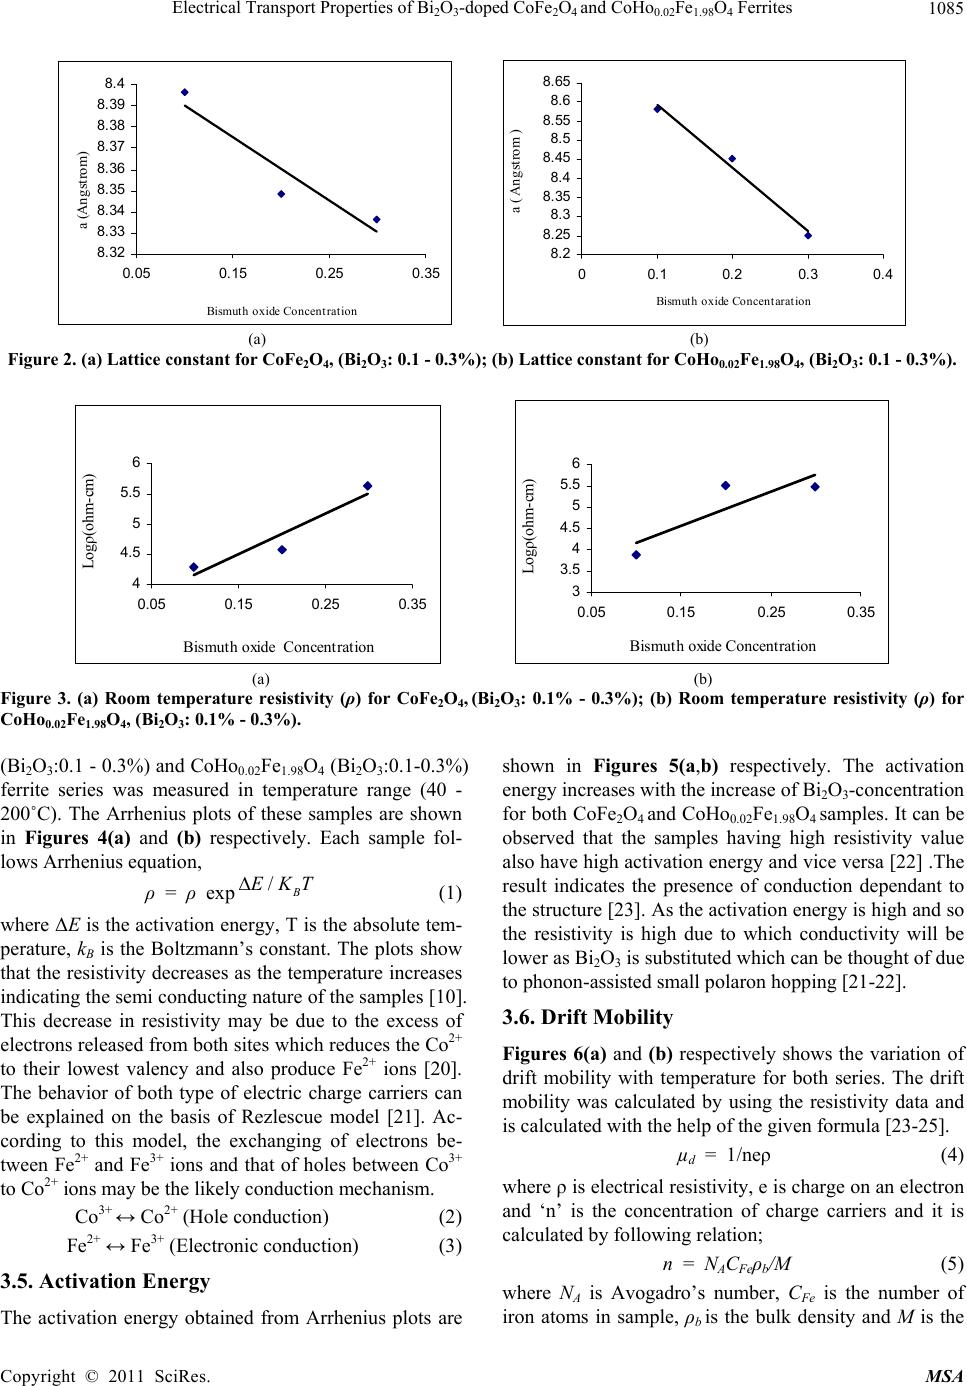 Electrical Transport Properties of BiO-doped CoFeOand CoHoFe O Ferrites 1085 2324 0.021.984 8. 32 8. 33 8. 34 8. 35 8. 36 8. 37 8. 38 8. 39 8.4 0.05 0.15 0.25 0.35 Bismuth oxide Concentration a (Angstrom) 8. 2 8.25 8. 3 8.35 8. 4 8.45 8. 5 8.55 8. 6 8.65 00.1 0.20.3 0.4 Bismuth oxide Concentaration a ( Angstrom ) (a) (b) Figure 2. (a) Lattice constant for CoFe2O4, (Bi2O3: 0.1 - 0.3%); (b) Lattice constant for CoHo0.02Fe1.98O4, (Bi2O3: 0.1 - 0.3%). 4 4.5 5 5.5 6 0.05 0.15 0.25 0.35 Bismuth oxide Concentration Logρ(ohm-cm) 3 3.5 4 4.5 5 5.5 6 0.05 0.150.25 0.35 Bismuth oxide Concentration Logρ(ohm-cm) (a) (b) Figure 3. (a) Room temperature resistivity (ρ) for CoFe2O4, (Bi2O3: 0.1% - 0.3%); (b) Room temperature resistivity (ρ) for CoHo0.02Fe1.98O4, (Bi2O3: 0.1% - 0.3%). (Bi2O3:0.1 - 0.3%) and CoHo0.02Fe1.98O4 (Bi2O3:0.1-0.3%) ferrite series was measured in temperature range (40 - 200˚C). The Arrhenius plots of these samples are shown in Figures 4(a) and (b) respectively. Each sample fol- lows Arrhenius equation, ρ = ρ exp/B EKT (1) where ΔE is the activation energy, T is the absolute tem- perature, kB is the Boltzmann’s constant. The plots show that the resistivity decreases as the temperature increases indicating the semi conducting nature of the samples [10]. This decrease in resistivity may be due to the excess of electrons released from both sites which reduces the Co2+ to their lowest valency and also produce Fe2+ ions [20]. The behavior of both type of electric charge carriers can be explained on the basis of Rezlescue model [21]. Ac- cording to this model, the exchanging of electrons be- tween Fe2+ and Fe3+ ions and that of holes between Co3+ to Co2+ ions may be the likely conduction mechanism. Co3+ ↔ Co2+ (Hole conduction) (2) Fe2+ ↔ Fe3+ (Electronic conduction) (3) 3.5. Activation Energy The activation energy obtained from Arrhenius plots are shown in Figures 5(a,b) respectively. The activation energy increases with the increase of Bi2O3-concentration for both CoFe2O4 and CoHo0.02Fe1.98O4 samples. It can be observed that the samples having high resistivity value also have high activation energy and vice versa [22] .The result indicates the presence of conduction dependant to the structure [23]. As the activation energy is high and so the resistivity is high due to which conductivity will be lower as Bi2O3 is substituted which can be thought of due to phonon-assisted small polaron hopping [21-22]. 3.6. Drift Mobility Figures 6(a) and (b) respectively shows the variation of drift mobility with temperature for both series. The drift mobility was calculated by using the resistivity data and is calculated with the help of the given formula [23-25]. µd = 1/neρ (4) where ρ is electrical resistivity, e is charge on an electron and ‘n’ is the concentration of charge carriers and it is calculated by following relation; n = NACFeρb/M (5) where NA is Avogadro’s number, CFe is the number of iron atoms in sample, ρb is the bulk density and M is the Copyright © 2011 SciRes. MSA 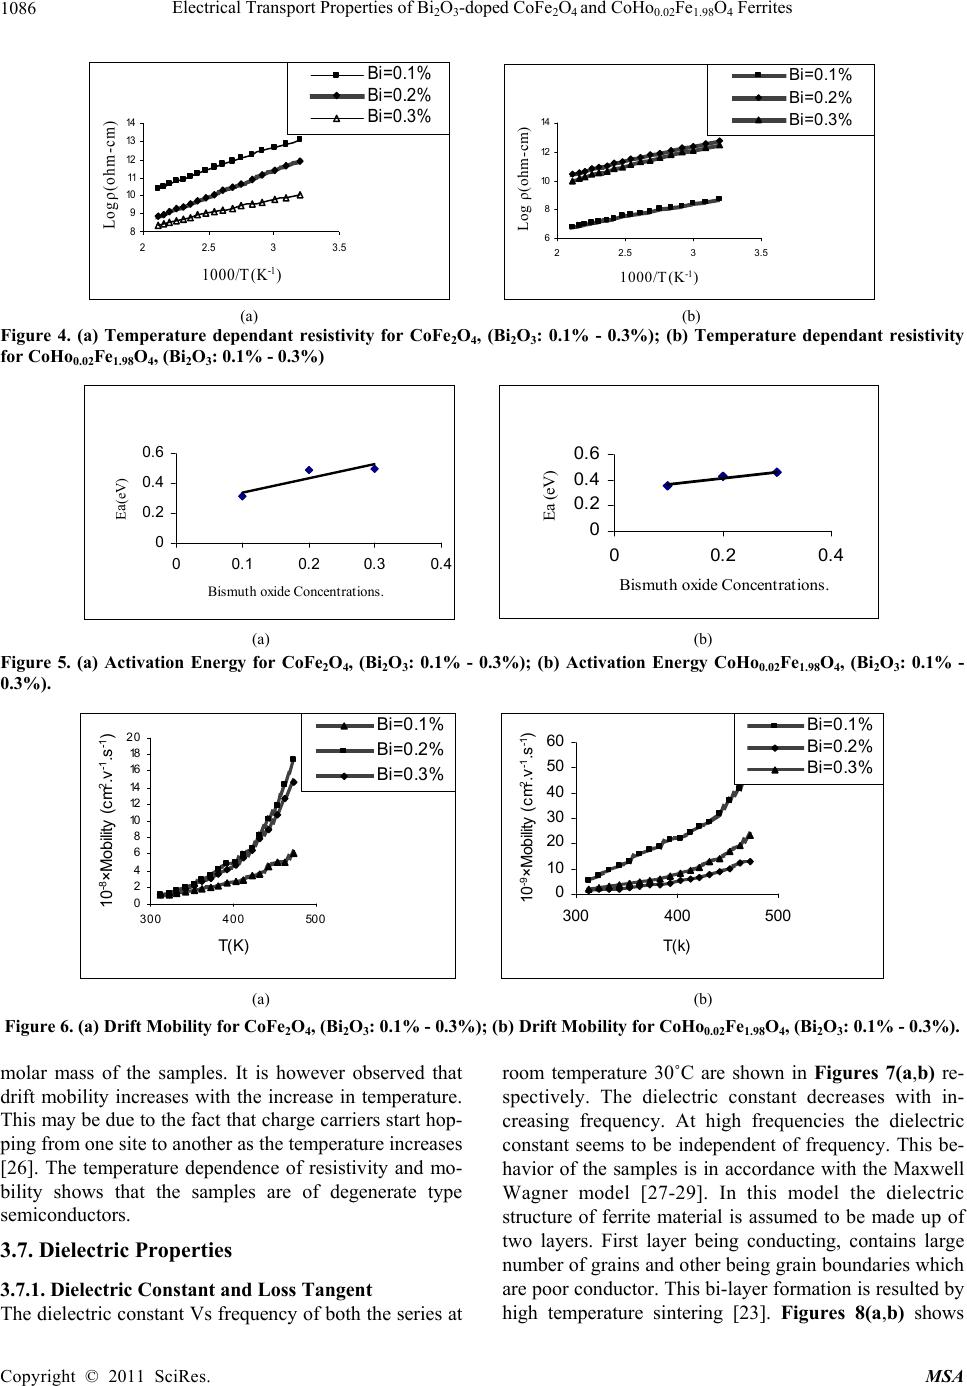 Electrical Transport Properties of BiO-doped CoFeOand CoHoFe O Ferrites 1086 2324 0.021.984 8 9 10 11 12 13 14 22.533.5 1000/T(K -1 ) Logρ(ohm-cm) Bi =0.1 % Bi =0.2 % Bi =0.3 % 6 8 10 12 14 22.533.5 1000/T (K -1 ) Log ρ(oh m -cm) Bi=0.1% Bi=0.2% Bi=0.3% (a) (b) Figure 4. (a) Temperature dependant resistivity for CoFe2O4, (Bi2O3: 0.1% - 0.3%); (b) Temperature dependant resistivity for CoHo0.02Fe1.98O4, (Bi2O3: 0.1% - 0.3%) 0 0. 2 0. 4 0. 6 00.10.20.30. Bismuth oxide Concentrations. E a (eV) 4 0 0.2 0.4 0.6 00.20.4 Bismuth oxide Concentrations. Ea (eV) (a) (b) Figure 5. (a) Activation Energy for CoFe2O4, (Bi2O3: 0.1% - 0.3%); (b) Activation Energy CoHo0.02Fe1.98O4, (Bi2O3: 0.1% - 0.3%). 0 2 4 6 8 10 12 14 16 18 20 300 400 500 T(K ) 10 -8 ×Mobility (cm 2 .v -1 .s -1 ) Bi=0.1% Bi=0.2% Bi=0.3% 0 10 20 30 40 50 60 300400 500 T(k) 10 -9 ×Mobility (cm 2 .v -1 .s -1 ) Bi=0.1% Bi=0.2% Bi=0.3% (a) (b) Figure 6. (a) Drift Mobility for CoFe2O4, (Bi2O3: 0.1% - 0.3%); (b) Drift Mobility for CoHo0.02Fe1.98O4, (Bi2O3: 0.1% - 0.3%). molar mass of the samples. It is however observed that drift mobility increases with the increase in temperature. This may be due to the fact that charge carriers start hop- ping from one site to another as the temperature increases [26]. The temperature dependence of resistivity and mo- bility shows that the samples are of degenerate type semiconductors. 3.7. Dielectric Properties 3.7.1. Dielectric Constant and Loss Tangent The dielectric constant Vs frequency of both the series at room temperature 30˚C are shown in Figures 7(a,b) re- spectively. The dielectric constant decreases with in- creasing frequency. At high frequencies the dielectric constant seems to be independent of frequency. This be- havior of the samples is in accordance with the Maxwell Wagner model [27-29]. In this model the dielectric structure of ferrite material is assumed to be made up of two layers. First layer being conducting, contains large number of grains and other being grain boundaries which are poor conductor. This bi-layer formation is resulted by high temperature sintering [23]. Figures 8(a,b) shows Copyright © 2011 SciRes. MSA 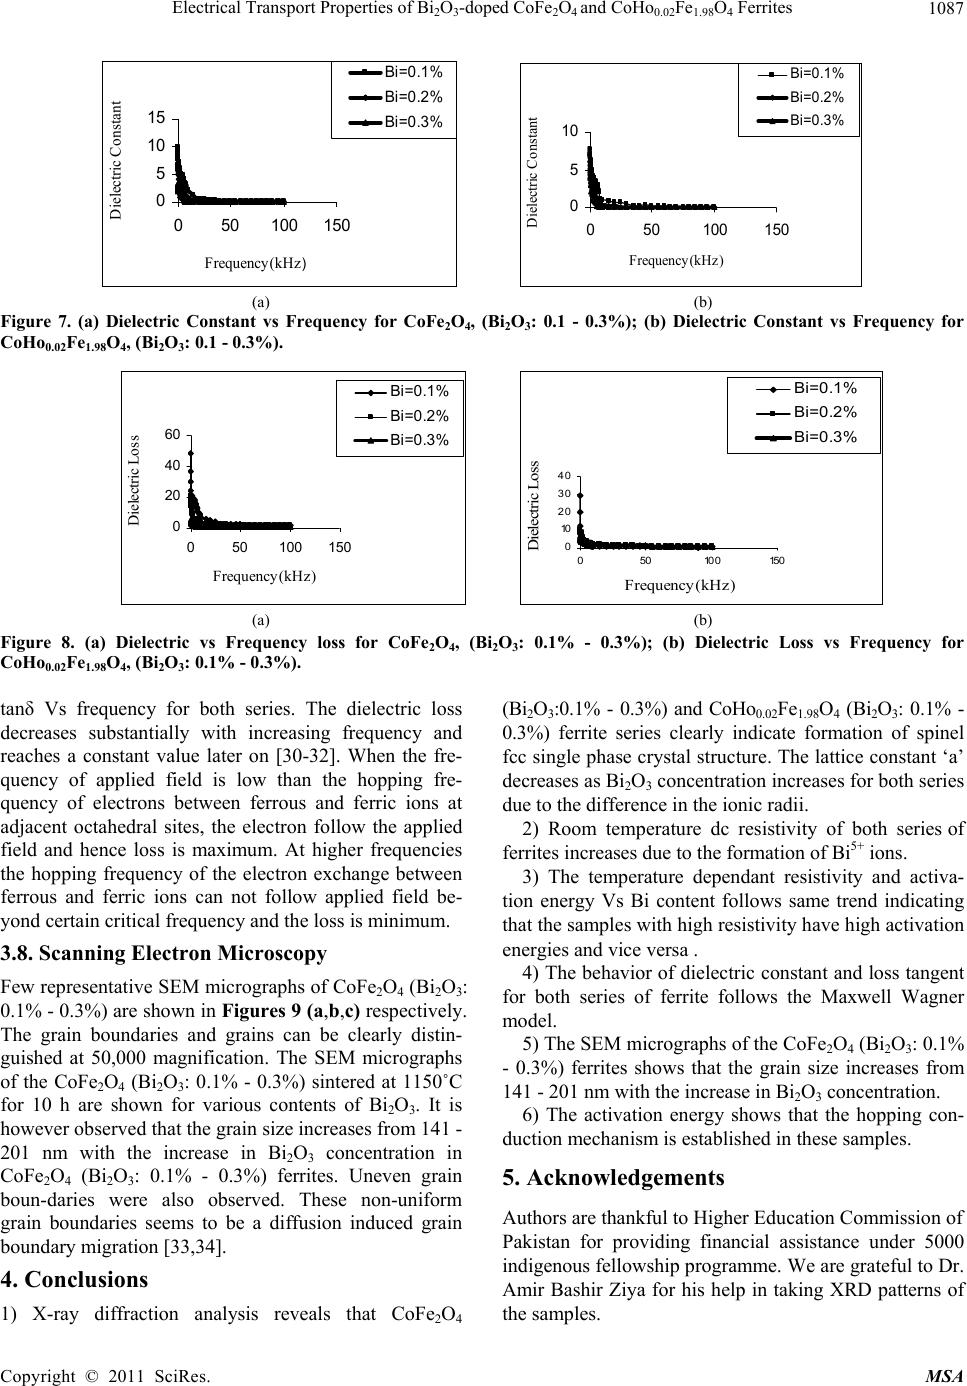 Electrical Transport Properties of BiO-doped CoFeOand CoHoFe O Ferrites 1087 2324 0.021.984 0 5 10 15 050100 150 Frequency (kH z ) Dielectric Constant Bi =0.1% Bi =0.2% Bi =0.3% 0 5 10 050100150 Frequency(kHz) Dielectric Constant Bi=0.1% Bi=0.2% Bi=0.3% (a) (b) Figure 7. (a) Dielectric Constant vs Frequency for CoFe2O4, (Bi2O3: 0.1 - 0.3%); (b) Dielectric Constant vs Frequency for CoHo0.02Fe1.98O4, (Bi2O3: 0.1 - 0.3%). 0 20 40 60 050100 150 Frequency(kHz ) Dielectric Loss Bi=0.1% Bi=0.2% Bi=0.3% 0 10 20 30 40 050100150 Frequency(kHz) Dielectric Loss Bi =0.1% Bi =0.2% Bi =0.3% (a) (b) Figure 8. (a) Dielectric vs Frequency loss for CoFe2O4, (Bi2O3: 0.1% - 0.3%); (b) Dielectric Loss vs Frequency for CoHo0.02Fe1.98O4, (Bi2O3: 0.1% - 0.3%). tanδ Vs frequency for both series. The dielectric loss decreases substantially with increasing frequency and reaches a constant value later on [30-32]. When the fre- quency of applied field is low than the hopping fre- quency of electrons between ferrous and ferric ions at adjacent octahedral sites, the electron follow the applied field and hence loss is maximum. At higher frequencies the hopping frequency of the electron exchange between ferrous and ferric ions can not follow applied field be- yond certain critical frequency and the loss is minimum. 3.8. Scanning Electron Microscopy Few representative SEM micrographs of CoFe2O4 (Bi2O3: 0.1% - 0.3%) are shown in Figures 9 (a,b,c) respectively. The grain boundaries and grains can be clearly distin- guished at 50,000 magnification. The SEM micrographs of the CoFe2O4 (Bi2O3: 0.1% - 0.3%) sintered at 1150˚C for 10 h are shown for various contents of Bi2O3. It is however observed that the grain size increases from 141 - 201 nm with the increase in Bi2O3 concentration in CoFe2O4 (Bi2O3: 0.1% - 0.3%) ferrites. Uneven grain boun-daries were also observed. These non-uniform grain boundaries seems to be a diffusion induced grain boundary migration [33,34]. 4. Conclusions 1) X-ray diffraction analysis reveals that CoFe2O4 (Bi2O3:0.1% - 0.3%) and CoHo0.02Fe1.98O4 (Bi2O3: 0.1% - 0.3%) ferrite series clearly indicate formation of spinel fcc single phase crystal structure. The lattice constant ‘a’ decreases as Bi2O3 concentration increases for both series due to the difference in the ionic radii. 2) Room temperature dc resistivity of both series of ferrites increases due to the formation of Bi5+ ions. 3) The temperature dependant resistivity and activa- tion energy Vs Bi content follows same trend indicating that the samples with high resistivity have high activation energies and vice versa . 4) The behavior of dielectric constant and loss tangent for both series of ferrite follows the Maxwell Wagner model. 5) The SEM micrographs of the CoFe2O4 (Bi2O3: 0.1% - 0.3%) ferrites shows that the grain size increases from 141 - 201 nm with the increase in Bi2O3 concentration. 6) The activation energy shows that the hopping con- duction mechanism is established in these samples. 5. Acknowledgements Authors are thankful to Higher Education Commission of Pakistan for providing financial assistance under 5000 indigenous fellowship programme. We are grateful to Dr. Amir Bashir Ziya for his help in taking XRD patterns of the samples. Copyright © 2011 SciRes. MSA 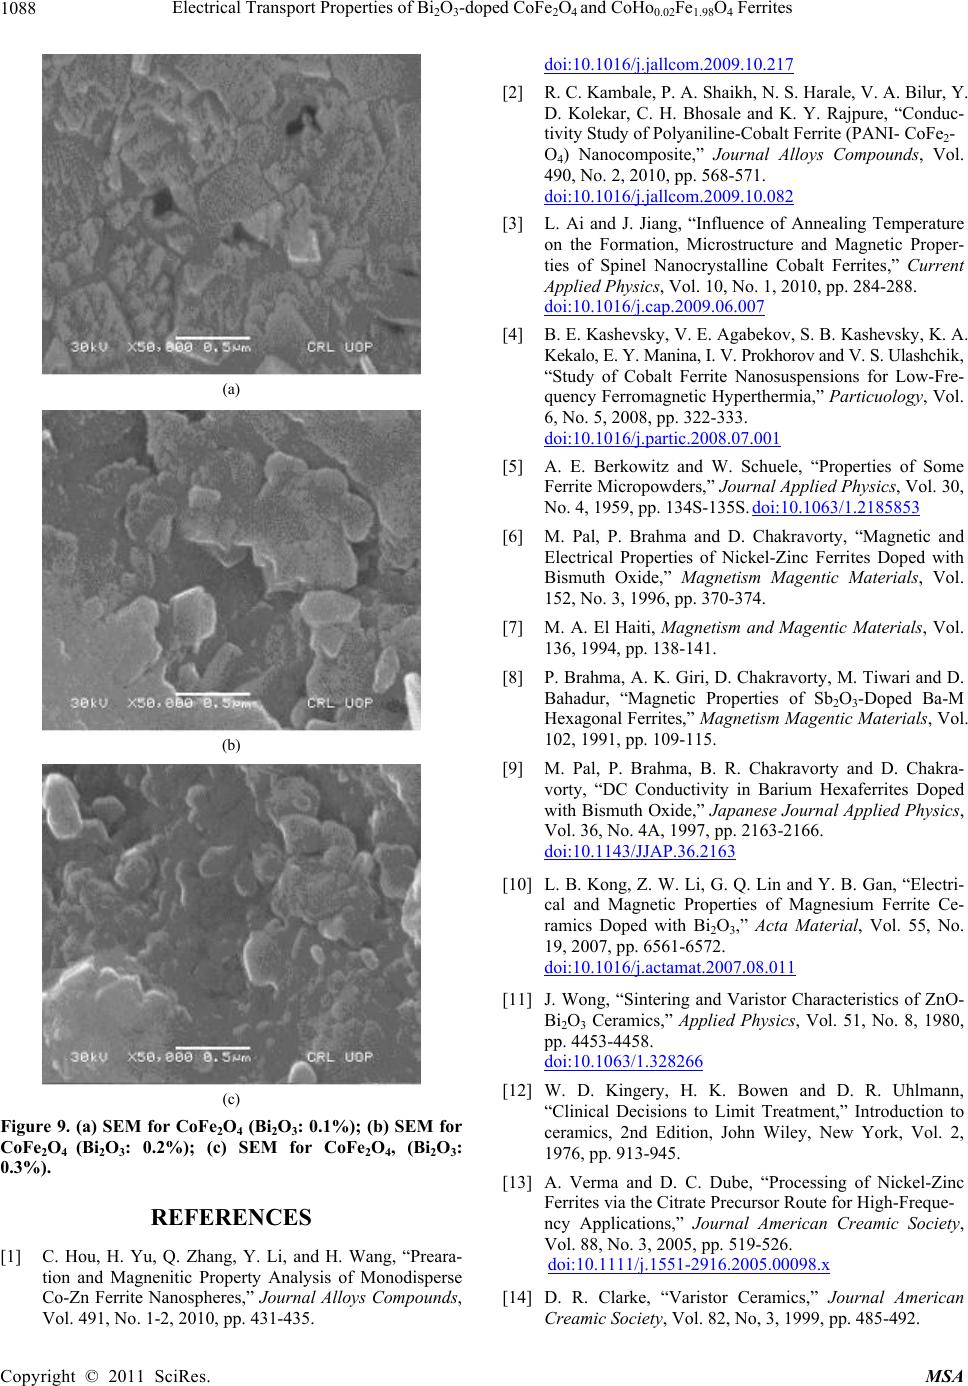 Electrical Transport Properties of BiO-doped CoFeOand CoHoFe O Ferrites 1088 2324 0.021.984 (a) (b) (c) Figure 9. (a) SEM for CoFe2O4 (Bi2O3: 0.1%); (b) SEM for CoFe2O4 (Bi2O3: 0.2%); (c) SEM for CoFe2O4, (Bi2O3: 0.3%). REFERENCES [1] C. Hou, H. Yu, Q. Zhang, Y. Li, and H. Wang, “Preara- tion and Magnenitic Property Analysis of Monodisperse Co-Zn Ferrite Nanospheres,” Journal Alloys Compounds, Vol. 491, No. 1-2, 2010, pp. 431-435. doi:10.1016/j.jallcom.2009.10.217 [2] R. C. Kambale, P. A. Shaikh, N. S. Harale, V. A. Bilur, Y. D. Kolekar, C. H. Bhosale and K. Y. Rajpure, “Conduc- tivity Study of Polyaniline-Cobalt Ferrite (PANI- CoFe2- O4) Nanocomposite,” Journal Alloys Compounds, Vol. 490, No. 2, 2010, pp. 568-571. doi:10.1016/j.jallcom.2009.10.082 [3] L. Ai and J. Jiang, “Influence of Annealing Temperature on the Formation, Microstructure and Magnetic Proper- ties of Spinel Nanocrystalline Cobalt Ferrites,” Current Applied Physics, Vol. 10, No. 1, 2010, pp. 284-288. doi:10.1016/j.cap.2009.06.007 [4] B. E. Kashevsky, V. E. Agabekov, S. B. Kashevsky, K. A. Kekalo, E. Y. Manina, I. V. Prokhorov and V. S. Ulashchik, “Study of Cobalt Ferrite Nanosuspensions for Low-Fre- quency Ferromagnetic Hyperthermia,” Particuology, Vol. 6, No. 5, 2008, pp. 322-333. doi:10.1016/j.partic.2008.07.001 [5] A. E. Berkowitz and W. Schuele, “Properties of Some Ferrite Micropowders,” Journal Applied Physics, Vol. 30, No. 4, 1959, pp. 134S-135S. doi:10.1063/1.2185853 [6] M. Pal, P. Brahma and D. Chakravorty, “Magnetic and Electrical Properties of Nickel-Zinc Ferrites Doped with Bismuth Oxide,” Magnetism Magentic Materials, Vol. 152, No. 3, 1996, pp. 370-374. [7] M. A. El Haiti, Magnetism and Magentic Materials, Vol. 136, 1994, pp. 138-141. [8] P. Brahma, A. K. Giri, D. Chakravorty, M. Tiwari and D. Bahadur, “Magnetic Properties of Sb2O3-Doped Ba-M Hexagonal Ferrites,” Magnetism Magentic Materials, Vol. 102, 1991, pp. 109-115. [9] M. Pal, P. Brahma, B. R. Chakravorty and D. Chakra- vorty, “DC Conductivity in Barium Hexaferrites Doped with Bismuth Oxide,” Japanese Journal Applied Physics, Vol. 36, No. 4A, 1997, pp. 2163-2166. doi:10.1143/JJAP.36.2163 [10] L. B. Kong, Z. W. Li, G. Q. Lin and Y. B. Gan, “Electri- cal and Magnetic Properties of Magnesium Ferrite Ce- ramics Doped with Bi2O3,” Acta Material, Vol. 55, No. 19, 2007, pp. 6561-6572. doi:10.1016/j.actamat.2007.08.011 [11] J. Wong, “Sintering and Varistor Characteristics of ZnO- Bi2O3 Ceramics,” Applied Physics, Vol. 51, No. 8, 1980, pp. 4453-4458. doi:10.1063/1.328266 [12] W. D. Kingery, H. K. Bowen and D. R. Uhlmann, “Clinical Decisions to Limit Treatment,” Introduction to ceramics, 2nd Edition, John Wiley, New York, Vol. 2, 1976, pp. 913-945. [13] A. Verma and D. C. Dube, “Processing of Nickel-Zinc Ferrites via the Citrate Precursor Route for High-Freque- ncy Applications,” Journal American Creamic Society, Vol. 88, No. 3, 2005, pp. 519-526. doi:10.1111/j.1551-2916.2005.00098.x [14] D. R. Clarke, “Varistor Ceramics,” Journal American Creamic Society, Vol. 82, No, 3, 1999, pp. 485-492. Copyright © 2011 SciRes. MSA  Electrical Transport Properties of Bi2O3-doped CoFe2O4 and CoHo0.02Fe1.98O4 Ferrites Copyright © 2011 SciRes. MSA 1089 doi:10.1111/j.1151-2916.1999.tb01793.x [15] JCPDS-International, “Centre for Diffraction,” Data PCPDFWIN, Vol. 2, No. 1, 1998, pp. 11-21. [16] S. T. Mahmud, A. K. M. Akhter Hussain, A. K. M. Abdul Hakim, M. Seki, T. Kawai and H. Tabata, “Influence of Microstructure on the Complex Permeability of Spinel Type Ni Zn Ferrite,” Magnetism Magentic Materials, Vol. 305, No. 1, 2006, pp. 269-274. [17] F. G. Chang, G. L. Song, K. Fang, P. Qin and Q. J. Zeng, “Effect of Gadolinium Substitution on Dielectric Proper- ties of Bismuth Ferrite,” Journal of Rare Earths, Special Issue, Vol. 24, 2006, pp. 273-276. doi:10.1016/S1002-0721(07)60379-2 [18] K. J. D. Mackenzie, T. Dougherty, and J. Barrel, “The Electronic Properties of Complex Oxides of Bismuth with the Mullite Structure,” Journal of the Euorpean Ceramic Society, Vol. 28, No. 2, 2008, pp. 499-504. doi:10.1016/j.jeurceramsoc.2007.03.012 [19] U. Ghazanfar, S. A. Siddiqi and G. Abbas, “Study of Room Temperature Dc Resistivity in Comparison with Activation Energy and Drift Mobility of NiZn Ferrites,” Materials Science and Engineering B, Vol. 118, No. 2, 2005, pp. 132-134. [20] N. Rezlescue and E. Rezllescue, “Study of Room Tem- perature Dc Resistivity in Comparison with Activation Energy and Drift Mobility of NiZn Ferrites,” Physics Status Solid A, Vol. 23, No. 2, 1974, pp. 575-579. doi:10.1002/pssa.2210230229 [21] N. F. Mott and J. Non-Cryst, “Dissertation,” Solids, Vol. 1, 1968, pp. 1-17. [22] D. S. Birajdar, D. R. Mane, S. S. More, V. B. Kawade, and K. M. Jadhav, “Structural and Magnetic Properties of ZnxCul4-xMn0.4Fel2O4 Ferities,” Journal Material, Vol. 59, No. 24-25, 2005, pp. 2981-2985. [23] L. Nalbandian, A. Delimitis, V. T. ZaspaliS, E. A. Deli- yani, D. N. Bakoyannakis, E. N. Pelek and A. J. Micropor, “Hydrothermally Prepared Nanocrystalline Mn-Zn Fer- rites: Synthesis and Characterization,” Mesoporous Mate- rial, Vol. 114, No. 1-2, 2008, pp. 465-473. [24] M. K. Shobanaa, S. Sankara, V. Rajendranb, M. K. Sho- banaa, S. Sankara and V. Rajendranb, “Shape and Direc- tor Field Deformation of Tactoids,” Masterial Chemistry Physics, Vol. 113, No. 12, 2009, pp. 10-13. doi:10.1016/j.matchemphys.2008.07.083 [25] M. N. Ashiq, N. Bibi and M. A. Malana, “Effect of Sn-Ni Substitution on the Structural, Electrical and Magnetic Properties of Mixed Spinel Ferrites,” Journal of Alloys and Compounds, Vol. 490, No. 1-2,4 February 2010, pp. 594-597. [26] K. C. Maxwell, “Electricity and Magnetism,” Oxford Unversity Press, London, Vol. 1, 1873, pp. 328-332. [27] K. W. Wagner, “A Biliography of Zimbabwean Archae- ology to 2005,” Journal American Creamic Society, Vol. 40, 1913, pp. 817-823. [28] L. T. Robinkin and Z. I. Novikova, “Ferrites,” IZV Aca- demics Nauk USSR, Minisik, 1960, pp. 146-152. [29] V. R. K. Murthy and J. Shobanadri, “Dielectric Properties of Some Nickel-Zinc Ferrites at Radio Frequency,” Phys- ics Status Solid A, Vol. 36, No. 2, 1976, pp. 133-140. doi:10.1002/pssa.2210360247 [30] N. Rezlescu and E. Rezlescue, “” Physics Status Solid A, Vol. 23, 1974, pp. 575-581. doi:10.1002/pssa.2210230229 [31] K. Iwauchi, “Dielectric Properties of Fine Particles of Fe3O4 and Some Ferrites,” Japanese Journal Applied Physics, Vol. 10, 1971, pp 1520-1528. doi:10.1143/JJAP.10.1520 [32] J. K. Park and D. Y. Kim, “Effect of Grain Size on Diffusion-Induced Grain-Boundary Migration in Ba(Zn1/3- Nb2/3)O3 Ceramics,” Journal American Ceramer Socienty, Vol. 79, No. 5, 1996, pp. 1405-1415. doi:10.1111/j.1151-2916.1996.tb08604.x [33] N. M. Burange, S. S. Chogule, D. R. Patil, R. S. Devan, Y. D. Koleka and B. K. Chougle, “Studies on Structural, Electrical and Magnetic Properties of y(Ni0.5Zn0.3Co0.2Fe2- O4)+(1−y)(BaTiO3) Composites,” Journal of Alloys and Compounds, Vol. 479, No. 1-2, 2009, pp. 569-573. doi:10.1016/j.jallcom.2009.01.004
|