 Vol.3, No.8, 694-701 (2011) Natural Science http://dx.doi.org/10.4236/ns.2011.38093 Copyright © 2011 SciRes. OPEN ACCESS Memory and relaxation time of biological systems. An analysis of the effect of abortion legalization in Italy Michele Caputo1, Fulvia Gloria-Bottini2 1Department of Physics, University of Rome La Sapienza, Rome; Italy and Department of Geology and Geophysics, Texas A&M University, Texas, USA; 2Department of Biopathology and Imaging Diagnostics, University of Rome Tor Vergata, Rome, Italy; *Corresponding Author: gloria@med.uniroma2.it Received 9 August 2010; revised 10 September 2010; accepted 25 September 2010. ABSTRACT When a population is affected by a new law there is a lag between the date of application of the law and the response of the population; moreover there is a relaxation time after which a steady state is reached. The time to maximum response and the relaxation time may be ap- proximately estimated from the raw data but the mathematical modeling of the data allows a better estimate. The model, when tested on real data, may be used for future laws or, when ap- propriately adapted, for other biological sys- tems also. In this note the memory based model is tested on the effects of the 1978 law which legalized the abortions in Italy finding the response and the relaxation time. It is shown that Italian population, after the abortion law, has required about 5 years to have the maximum effect and about 10 years to reach stability. The evolution of women life and the changes of the structure of society in Italy is also discussed. Keywords: Memory; Abortion; Mathematical Model; Live-Born Infant; Population Growth 1. INTRODUCTION The changes occurred in society and human life in the XXth century are enormous. Most changes seem a con- sequence of the political evolution and of the economic growth, the latter mostly due to technological innovation and to scientific discoveries. These changes have solved long standing problems but have generated many new ones. Among other problems, in the last three decades of the XXth century, the fertility of women, especially by Ital- ian population, had a steady and dramatic decrease. We might state that, concerning the Italian population, are present at least three events: the practice of abortion, the decrease of fertility and the increasing of the age of the mothers delivering infants. These problems are obvi- ously connected with the profound alterations in econ- omy, morality, in the culture and in structural changes of our society which shows limited interest for the new lives. Dramatic changes occurred during the life of fe- males favoured by the introduction of contraception and by the law that liberalized abortions. These new situa- tions have caused changes in the structure of families and in the rate of birth. The problem of the changes in fertility of the Italian women leads to discuss the effect of perturbations on a biological system. However, the problems have different nature and that will imply different discussions. The scope of this paper is to illustrate how one arrives to a memory equation, to model mathematically the evolution of a biological system and to apply the model of the variations in the rate of the abortions caused in Italy by the introduction of the 1978 law which liberal- ized the abortion. The analytical model might be useful to estimate the delay time of the effects of other types of perturbations in the evolution of populations. 1.1. The Evolution of Women Life in Italy An inspection of Figures 1 and 2 suggests that the ef- fect of the 1978 abortion law on the number of abortions in Italy is stabilized. It is then in order to examine the possible impact of the law on cultural and structural aspects of the popula- tion in Italy, after that the law was enforced, with special reference to age-sex distribution. Obviously other im- portant changes occurred in Italy, mostly in the socio- economic field, which contributed to the above men- tioned cultural and structural changes. We will examine those which seem most relevant from the structural point 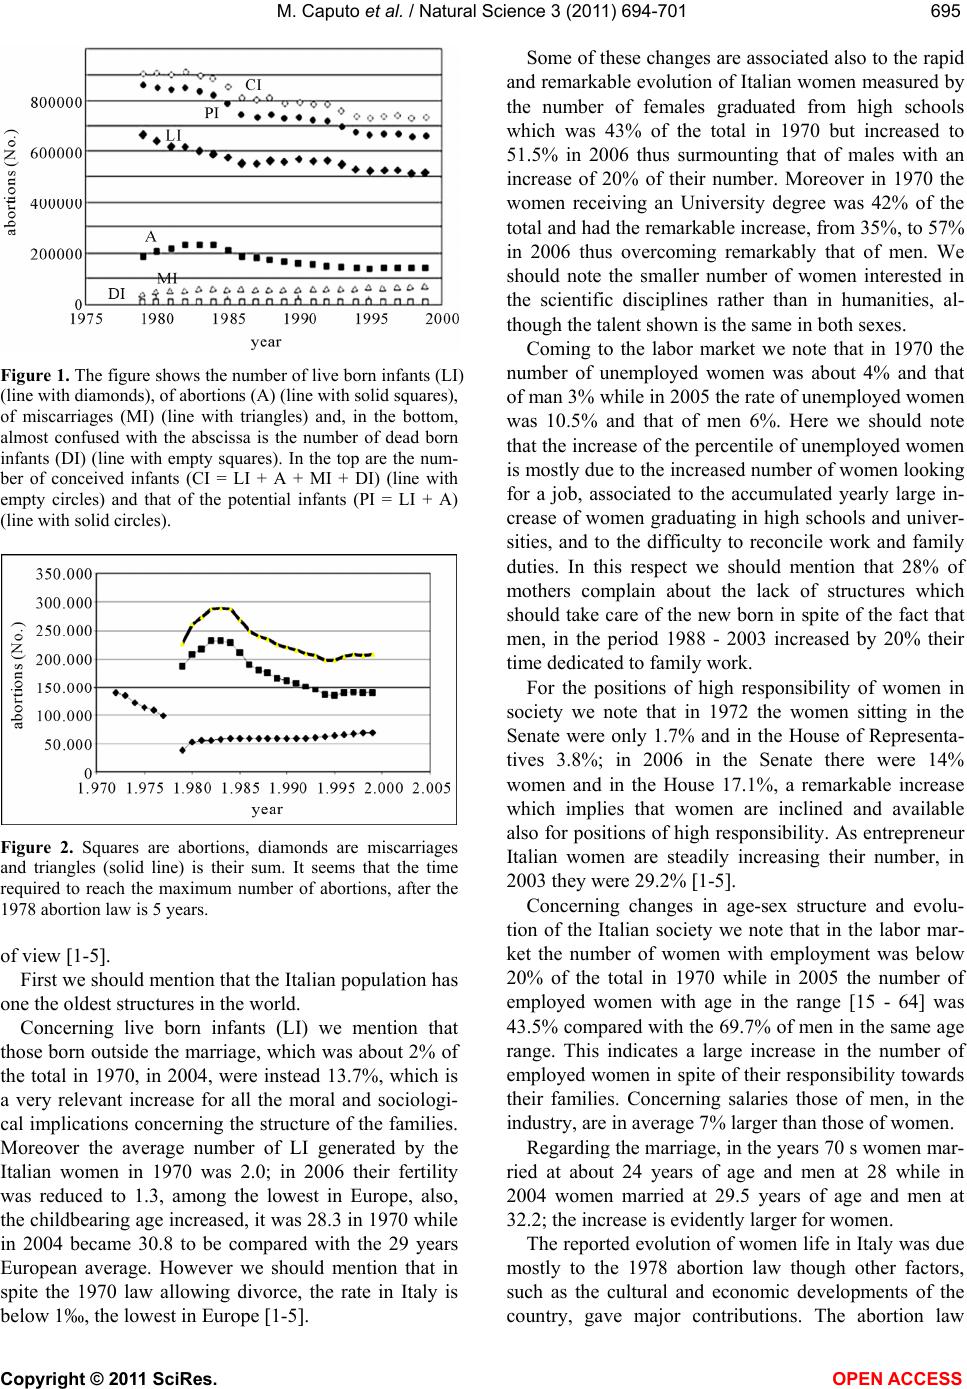 M. Caputo et al. / Natural Science 3 (2011) 694-701 Copyright © 2011 SciRes. OPEN ACCESS 695695 Figure 1. The figure shows the number of live born infants (LI) (line with diamonds), of abortions (A) (line with solid squares), of miscarriages (MI) (line with triangles) and, in the bottom, almost confused with the abscissa is the number of dead born infants (DI) (line with empty squares). In the top are the num- ber of conceived infants (CI = LI + A + MI + DI) (line with empty circles) and that of the potential infants (PI = LI + A) (line with solid circles). Figure 2. Squares are abortions, diamonds are miscarriages and triangles (solid line) is their sum. It seems that the time required to reach the maximum number of abortions, after the 1978 abortion law is 5 years. of view 1-5. First we should mention that the Italian population has one the oldest structures in the world. Concerning live born infants (LI) we mention that those born outside the marriage, which was about 2% of the total in 1970, in 2004, were instead 13.7%, which is a very relevant increase for all the moral and sociologi- cal implications concerning the structure of the families. Moreover the average number of LI generated by the Italian women in 1970 was 2.0; in 2006 their fertility was reduced to 1.3, among the lowest in Europe, also, the childbearing age increased, it was 28.3 in 1970 while in 2004 became 30.8 to be compared with the 29 years European average. However we should mention that in spite the 1970 law allowing divorce, the rate in Italy is below 1‰, the lowest in Europe 1-5. Some of these changes are associated also to the rapid and remarkable evolution of Italian women measured by the number of females graduated from high schools which was 43% of the total in 1970 but increased to 51.5% in 2006 thus surmounting that of males with an increase of 20% of their number. Moreover in 1970 the women receiving an University degree was 42% of the total and had the remarkable increase, from 35%, to 57% in 2006 thus overcoming remarkably that of men. We should note the smaller number of women interested in the scientific disciplines rather than in humanities, al- though the talent shown is the same in both sexes. Coming to the labor market we note that in 1970 the number of unemployed women was about 4% and that of man 3% while in 2005 the rate of unemployed women was 10.5% and that of men 6%. Here we should note that the increase of the percentile of unemployed women is mostly due to the increased number of women looking for a job, associated to the accumulated yearly large in- crease of women graduating in high schools and univer- sities, and to the difficulty to reconcile work and family duties. In this respect we should mention that 28% of mothers complain about the lack of structures which should take care of the new born in spite of the fact that men, in the period 1988 - 2003 increased by 20% their time dedicated to family work. For the positions of high responsibility of women in society we note that in 1972 the women sitting in the Senate were only 1.7% and in the House of Representa- tives 3.8%; in 2006 in the Senate there were 14% women and in the House 17.1%, a remarkable increase which implies that women are inclined and available also for positions of high responsibility. As entrepreneur Italian women are steadily increasing their number, in 2003 they were 29.2% 1-5. Concerning changes in age-sex structure and evolu- tion of the Italian society we note that in the labor mar- ket the number of women with employment was below 20% of the total in 1970 while in 2005 the number of employed women with age in the range [15 - 64] was 43.5% compared with the 69.7% of men in the same age range. This indicates a large increase in the number of employed women in spite of their responsibility towards their families. Concerning salaries those of men, in the industry, are in average 7% larger than those of women. Regarding the marriage, in the years 70 s women mar- ried at about 24 years of age and men at 28 while in 2004 women married at 29.5 years of age and men at 32.2; the increase is evidently larger for women. The reported evolution of women life in Italy was due mostly to the 1978 abortion law though other factors, such as the cultural and economic developments of the country, gave major contributions. The abortion law  M. Caputo et al. / Natural Science 3 (2011) 694-701 Copyright © 2011 SciRes. OPEN ACCESS 696 allowed women the possibility to avoid bearing an unde- sired infant, in addition to the already existing possibili- ties to avoid pregnancies through the existing mechanic- cal and new chemical contraceptives and to have access to a life-stile different from the traditional. 1.2. Live Born Infants, Induced Abortions and Miscarriages (Spontaneous Abortions) in Italy We begin with some simple observations on the sta- tistical information on the evolution of the Italian popu- lation. The Figure 1 shows the number of LI, the num- ber of legal abortions (A), the number of miscarriages (MI), the number of dead born infants (DI), the sum of LI plus the A plus the MI plus the DI, which is the number of conceived infants (CI = LI + MI + DI) and, finally, the sum of LI and A which we define the poten- tial infants PI (PI = LI + A), that is, those who could possibly have had birth without the intervention of men. Note that the percent decrease of PI, from 1979 to 1999 is 0.2318 or 9948.7/year, that of the CI is 0.1905 or 8596.5/year and that of LI is 0.223 or 7495.5/year; that is the percent decrease of the PI is even more dramatic than that of LI; fortunately the percent decrease of CI is smaller than the others. In modeling the miscarriages, which are independent of the will of the couple, are not taken into account and we tentatively assume that all, or almost all, the abor- tions, which were illegal before the 1978 law and came on the surface after 1978, were performed in hospitals and were reported in the official statistics of Istituto Na- zionale di Statistica 1-5. We realize that this assump- tion is optimistic and we model the statistics of those cases and use these data which obviously begin with the year 1979. We consider the yearly number of abortions reported by ISTAT 1-5, without discussing the osmotic phe- nomena between legal and illegal abortions occurred as a consequence of the law. We will use an analytic model with memory and obtain the parameter values resulting from the fitting of the model to the data; this may be of help in the discussion of the causes of the yearly varia- tions in the number of abortions and the interactions with other phenomena. The data on abortions show an initial slow increase due to the time needed to accept the law, the reaction time, then follows a slow decrease to an almost stable trend. The scope of our work is precisely the tentative estimate of the reaction time to the new law and obtain analytically the time to steady state, the relaxation time, which may give some indications on the reaction time to other possible future laws in the same field or in other fields of demography. Obviously there was osmosis between illegal (MI) and legal (A) abortions, this was one of the reason for mak- ing the 1978 law. Certainly some abortions were made in Italy outside the rules of the law before 1978 or abroad but we have no means to evaluate them. However we have an indirect proof of it in the sudden decrease of the reported number of MI: from 99.259 in 1977 to 36.558 in 1979 and leveling around 60.000 at the end of the century as shown in Figure 2, while the number of A in 1979 was almost 200.000 to level around 130 000 at the end of the century. This indicates that, probably, before the 1978 abortion law, many reported miscarriages were in fact abortions. After the law the latter cases were rightly reported as abortions which in turn suddenly decreased the number of reported miscarriages, however after 1978 the number of reported miscarriages increased by 50% to reach al- most steady state only in 1985. 2. MEHODS We illustrate now how one arrives to the memory equation used for an estimate of the effect of perturba- tions on the variation rate of A. The curves modelling the phenomenon, such as the logistics, are generally obtained from differential equa- tions expressing in various forms the objective proper- ties of the number of individuals n(t) of the population which one desires to model. Among these are the famous Volterra’s non linear equations and many others. Many of these equations are written expliciting the growth rate n’(t), with integro-differential forms of n(t) and n’(t). Some procedures lead to first or second order differential equations, often producing converging and/or diverging solutions; some non linear equations, are discussed ana- lytically others numerically. Here we proceed as if the equation represents a bio- logical system, which in our case is the population pro- ducing the observed yearly number of A in Italy from 1979 through 1999, and estimate the reaction of the sys- tem to a perturbation. The data are the number of A in Italy shown in Figure 1 and the perturbation is the 1978 law which legalized the abortions. The study would have been more consistent if the data before 1978 were avail- able but, as we mentioned, they were not reported. To study the statistic of A we introduce into the equa- tions governing the population growth a memory mecha- nism and a perturbation y, in our case the abortion law, and solve the equation obtaining analytically the effect of the perturbation to be fit to the data in order to obtain the memory parameters of the system. The same ap- proach was used by Caputo and Kolari 6 to solve a financial problem. Other mathematical methods of analy- sis of population dynamics may be retrieved from the 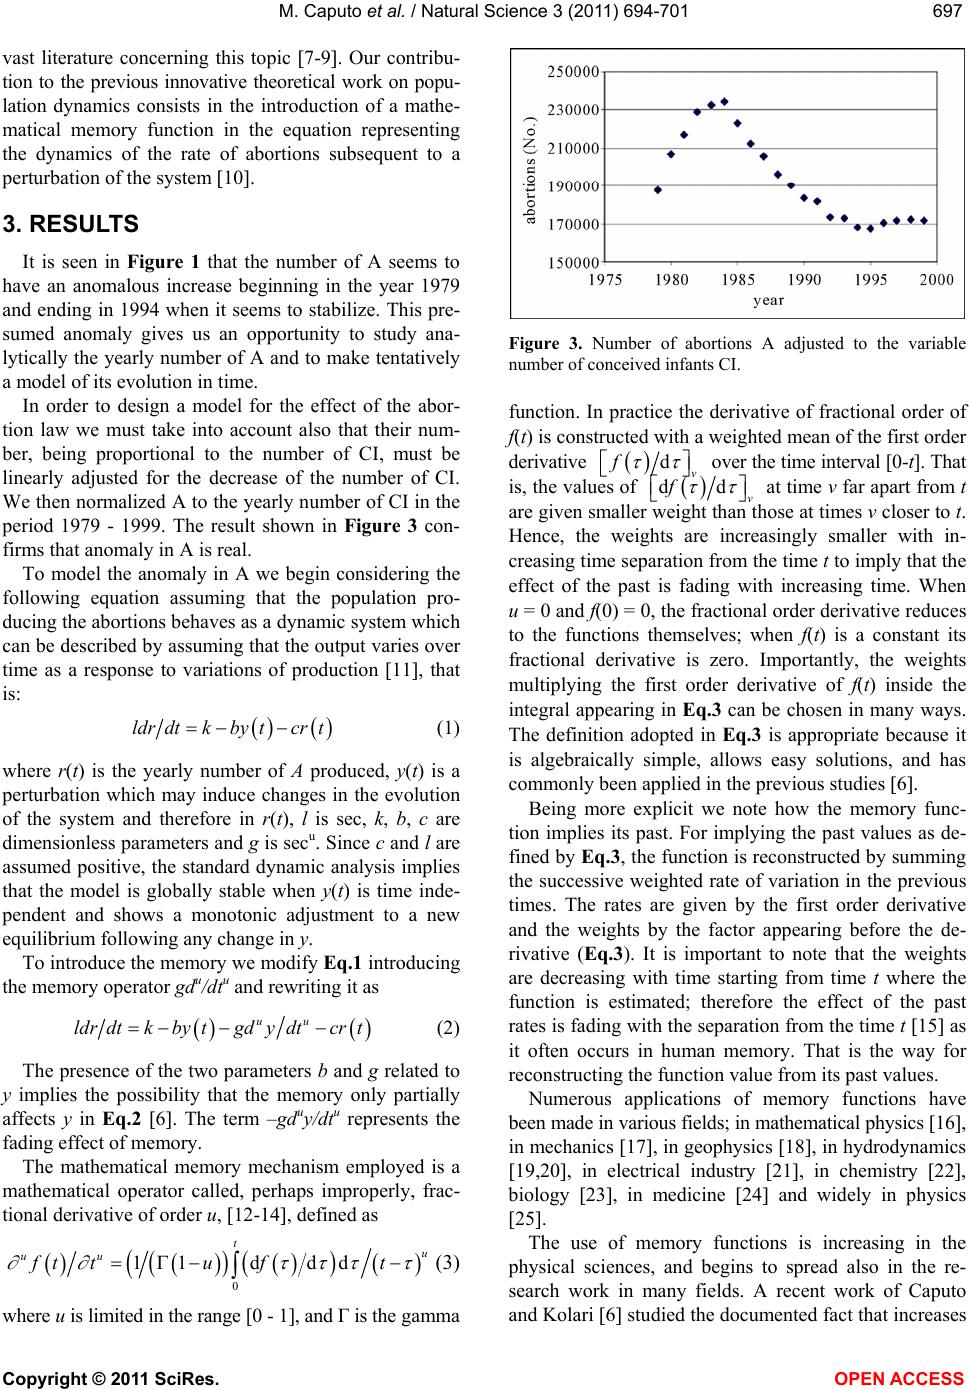 M. Caputo et al. / Natural Science 3 (2011) 694-701 Copyright © 2011 SciRes. OPEN ACCESS 697697 vast literature concerning this topic 7-9. Our contribu- tion to the previous innovative theoretical work on popu- lation dynamics consists in the introduction of a mathe- matical memory function in the equation representing the dynamics of the rate of abortions subsequent to a perturbation of the system 10. 3. RESULTS It is seen in Figure 1 that the number of A seems to have an anomalous increase beginning in the year 1979 and ending in 1994 when it seems to stabilize. This pre- sumed anomaly gives us an opportunity to study ana- lytically the yearly number of A and to make tentatively a model of its evolution in time. In order to design a model for the effect of the abor- tion law we must take into account also that their num- ber, being proportional to the number of CI, must be linearly adjusted for the decrease of the number of CI. We then normalized A to the yearly number of CI in the period 1979 - 1999. The result shown in Figure 3 con- firms that anomaly in A is real. To model the anomaly in A we begin considering the following equation assuming that the population pro- ducing the abortions behaves as a dynamic system which can be described by assuming that the output varies over time as a response to variations of production 11, that is: ldr dtkbytcrt (1) where r(t) is the yearly number of A produced, y(t) is a perturbation which may induce changes in the evolution of the system and therefore in r(t), l is sec, k, b, c are dimensionless parameters and g is secu. Since c and l are assumed positive, the standard dynamic analysis implies that the model is globally stable when y(t) is time inde- pendent and shows a monotonic adjustment to a new equilibrium following any change in y. To introduce the memory we modify Eq.1 introducing the memory operator gdu/dtu and rewriting it as uu ldr dtkbytgdydtcrt (2) The presence of the two parameters b and g related to y implies the possibility that the memory only partially affects y in Eq.2 6. The term –gduy/dtu represents the fading effect of memory. The mathematical memory mechanism employed is a mathematical operator called, perhaps improperly, frac- tional derivative of order u, 12-14, defined as 0 11d dd tu uu ft tuft (3) where u is limited in the range [0 - 1], and Γ is the gamma Figure 3. Number of abortions A adjusted to the variable number of conceived infants CI. function. In practice the derivative of fractional order of f(t) is constructed with a weighted mean of the first order derivative dv f over the time interval [0-t]. That is, the values of dd v f at time v far apart from t are given smaller weight than those at times v closer to t. Hence, the weights are increasingly smaller with in- creasing time separation from the time t to imply that the effect of the past is fading with increasing time. When u = 0 and f(0) = 0, the fractional order derivative reduces to the functions themselves; when f(t) is a constant its fractional derivative is zero. Importantly, the weights multiplying the first order derivative of f(t) inside the integral appearing in Eq.3 can be chosen in many ways. The definition adopted in Eq.3 is appropriate because it is algebraically simple, allows easy solutions, and has commonly been applied in the previous studies 6. Being more explicit we note how the memory func- tion implies its past. For implying the past values as de- fined by Eq.3, the function is reconstructed by summing the successive weighted rate of variation in the previous times. The rates are given by the first order derivative and the weights by the factor appearing before the de- rivative (Eq.3). It is important to note that the weights are decreasing with time starting from time t where the function is estimated; therefore the effect of the past rates is fading with the separation from the time t 15 as it often occurs in human memory. That is the way for reconstructing the function value from its past values. Numerous applications of memory functions have been made in various fields; in mathematical physics 16, in mechanics 17, in geophysics 18, in hydrodynamics 19,20, in electrical industry 21, in chemistry 22, biology 23, in medicine 24 and widely in physics 25. The use of memory functions is increasing in the physical sciences, and begins to spread also in the re- search work in many fields. A recent work of Caputo and Kolari 6 studied the documented fact that increases 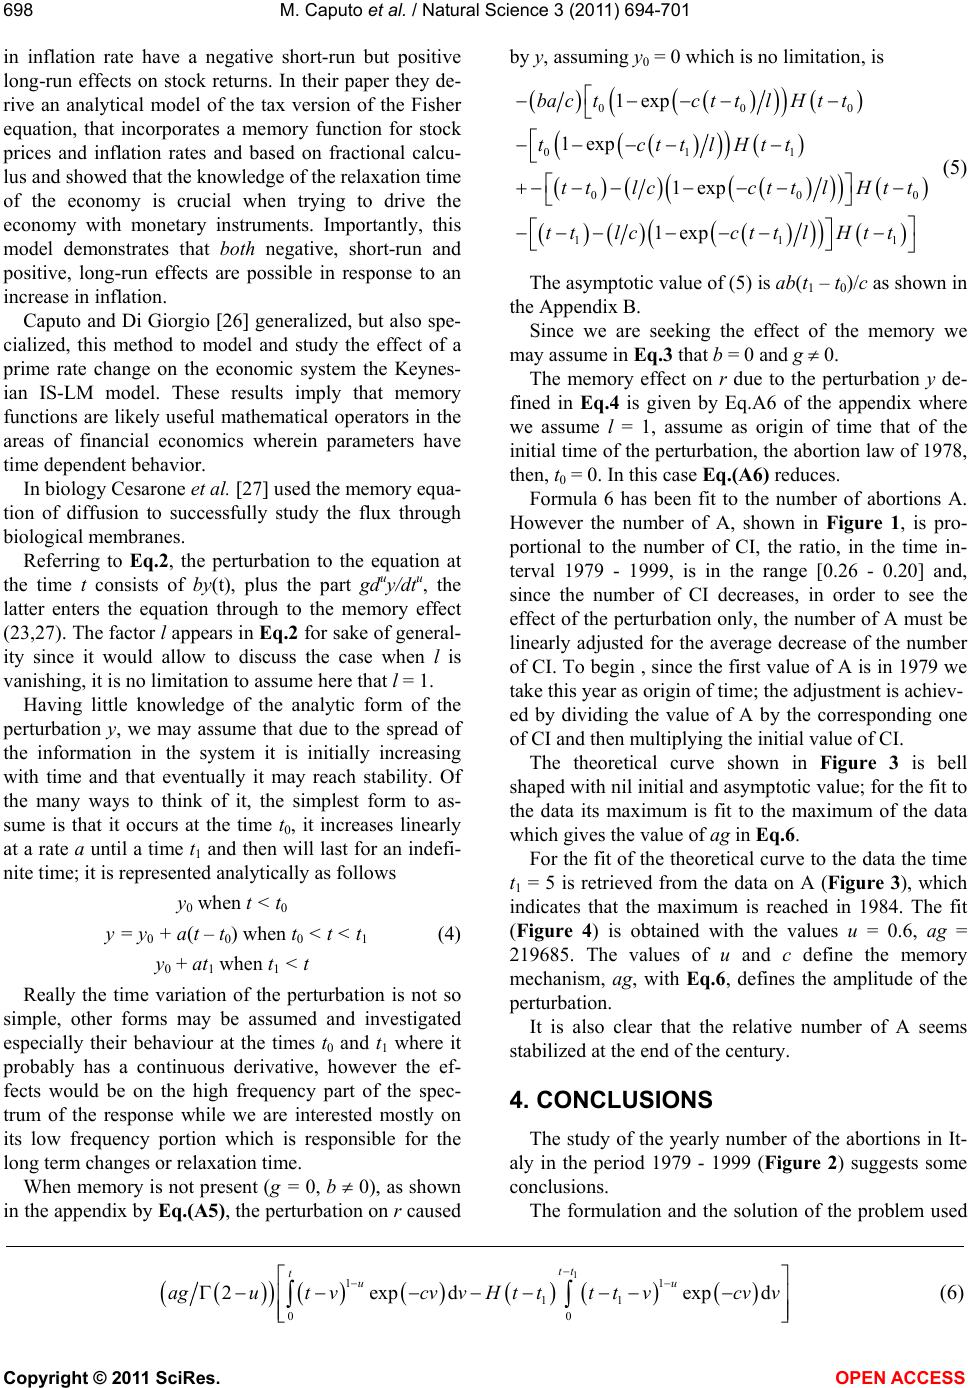 M. Caputo et al. / Natural Science 3 (2011) 694-701 Copyright © 2011 SciRes. OPEN ACCESS 698 in inflation rate have a negative short-run but positive long-run effects on stock returns. In their paper they de- rive an analytical model of the tax version of the Fisher equation, that incorporates a memory function for stock prices and inflation rates and based on fractional calcu- lus and showed that the knowledge of the relaxation time of the economy is crucial when trying to drive the economy with monetary instruments. Importantly, this model demonstrates that both negative, short-run and positive, long-run effects are possible in response to an increase in inflation. Caputo and Di Giorgio 26 generalized, but also spe- cialized, this method to model and study the effect of a prime rate change on the economic system the Keynes- ian IS-LM model. These results imply that memory functions are likely useful mathematical operators in the areas of financial economics wherein parameters have time dependent behavior. In biology Cesarone et al. 27 used the memory equa- tion of diffusion to successfully study the flux through biological membranes. Referring to Eq.2, the perturbation to the equation at the time t consists of by(t), plus the part gduy/dtu, the latter enters the equation through to the memory effect (23,27). The factor l appears in Eq.2 for sake of general- ity since it would allow to discuss the case when l is vanishing, it is no limitation to assume here that l = 1. Having little knowledge of the analytic form of the perturbation y, we may assume that due to the spread of the information in the system it is initially increasing with time and that eventually it may reach stability. Of the many ways to think of it, the simplest form to as- sume is that it occurs at the time t0, it increases linearly at a rate a until a time t1 and then will last for an indefi- nite time; it is represented analytically as follows y0 when t < t0 y = y0 + a(t – t0) when t0 < t < t1 (4) y0 + at1 when t1 < t Really the time variation of the perturbation is not so simple, other forms may be assumed and investigated especially their behaviour at the times t0 and t1 where it probably has a continuous derivative, however the ef- fects would be on the high frequency part of the spec- trum of the response while we are interested mostly on its low frequency portion which is responsible for the long term changes or relaxation time. When memory is not present (g = 0, b 0), as shown in the appendix by Eq.(A5), the perturbation on r caused by y, assuming y0 = 0 which is no limitation, is 000 011 000 111 1exp 1exp 1exp 1exp bac tct tl Ht t tctt lHtt ttlcctt lHtt ttlcctt lHtt (5) The asymptotic value of (5) is ab(t1 – t0)/c as shown in the Appendix B. Since we are seeking the effect of the memory we may assume in Eq.3 that b = 0 and g 0. The memory effect on r due to the perturbation y de- fined in Eq.4 is given by Eq.A6 of the appendix where we assume l = 1, assume as origin of time that of the initial time of the perturbation, the abortion law of 1978, then, t0 = 0. In this case Eq.(A6) reduces. Formula 6 has been fit to the number of abortions A. However the number of A, shown in Figure 1, is pro- portional to the number of CI, the ratio, in the time in- terval 1979 - 1999, is in the range [0.26 - 0.20] and, since the number of CI decreases, in order to see the effect of the perturbation only, the number of A must be linearly adjusted for the average decrease of the number of CI. To begin , since the first value of A is in 1979 we take this year as origin of time; the adjustment is achiev- ed by dividing the value of A by the corresponding one of CI and then multiplying the initial value of CI. The theoretical curve shown in Figure 3 is bell shaped with nil initial and asymptotic value; for the fit to the data its maximum is fit to the maximum of the data which gives the value of ag in Eq.6. For the fit of the theoretical curve to the data the time t1 = 5 is retrieved from the data on A (Figure 3), which indicates that the maximum is reached in 1984. The fit (Figure 4) is obtained with the values u = 0.6, ag = 219685. The values of u and c define the memory mechanism, ag, with Eq.6, defines the amplitude of the perturbation. It is also clear that the relative number of A seems stabilized at the end of the century. 4. CONCLUSIONS The study of the yearly number of the abortions in It- aly in the period 1979 - 1999 (Figure 2) suggests some conclusions. The formulation and the solution of the problem used 1 11 11 00 2exp dexp d tt tuu agut vcvv Httt tvcvv (6) 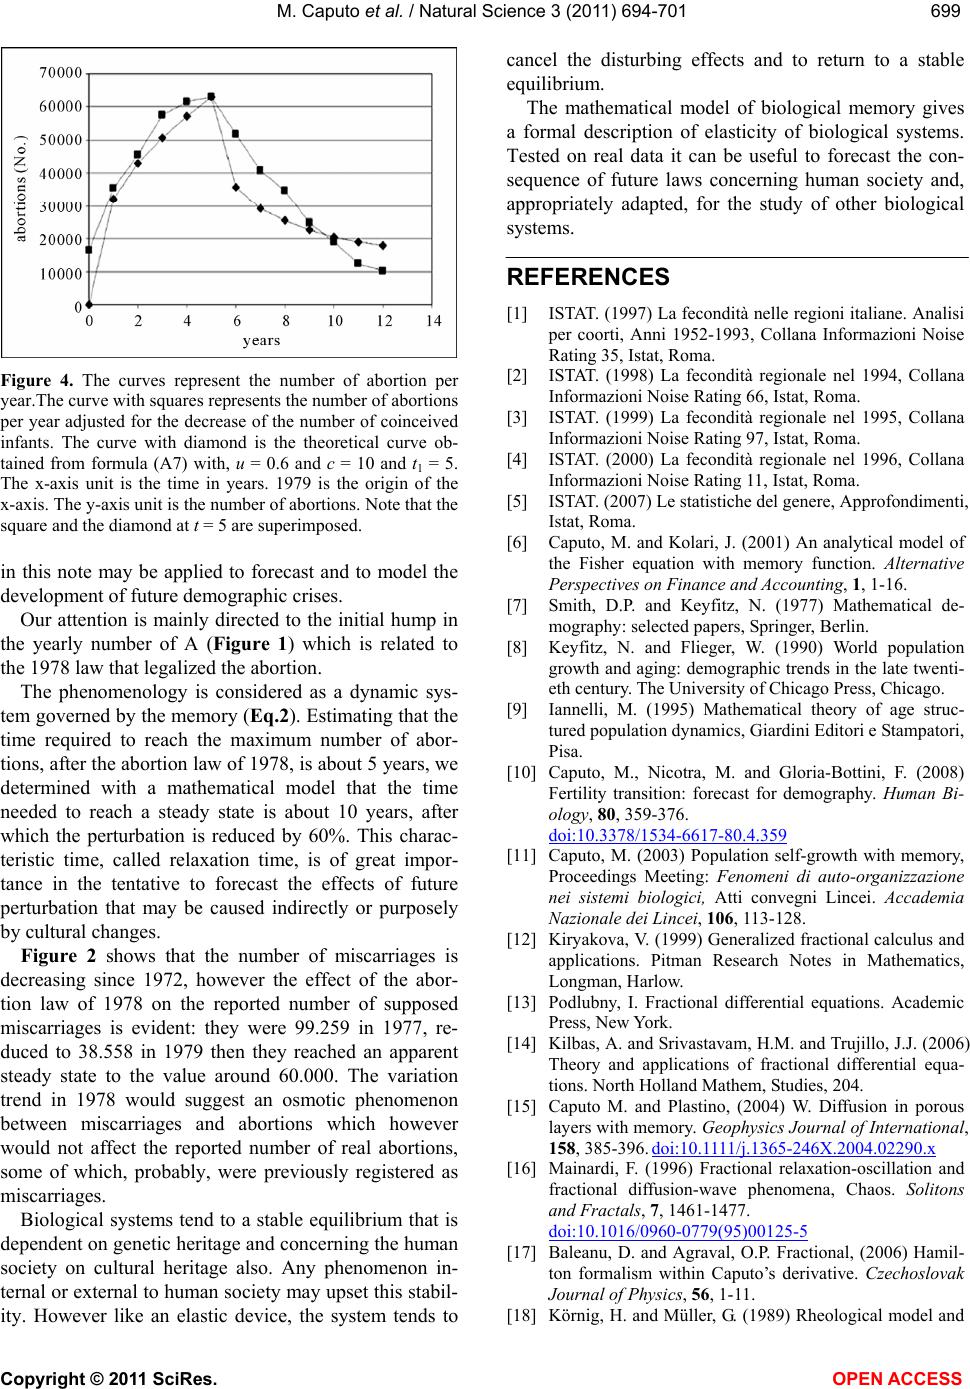 M. Caputo et al. / Natural Science 3 (2011) 694-701 Copyright © 2011 SciRes. OPEN ACCESS 699699 Figure 4. The curves represent the number of abortion per year.The curve with squares represents the number of abortions per year adjusted for the decrease of the number of coinceived infants. The curve with diamond is the theoretical curve ob- tained from formula (A7) with, u = 0.6 and c = 10 and t1 = 5. The x-axis unit is the time in years. 1979 is the origin of the x-axis. The y-axis unit is the number of abortions. Note that the square and the diamond at t = 5 are superimposed. in this note may be applied to forecast and to model the development of future demographic crises. Our attention is mainly directed to the initial hump in the yearly number of A (Figure 1) which is related to the 1978 law that legalized the abortion. The phenomenology is considered as a dynamic sys- tem governed by the memory (Eq.2). Estimating that the time required to reach the maximum number of abor- tions, after the abortion law of 1978, is about 5 years, we determined with a mathematical model that the time needed to reach a steady state is about 10 years, after which the perturbation is reduced by 60%. This charac- teristic time, called relaxation time, is of great impor- tance in the tentative to forecast the effects of future perturbation that may be caused indirectly or purposely by cultural changes. Figure 2 shows that the number of miscarriages is decreasing since 1972, however the effect of the abor- tion law of 1978 on the reported number of supposed miscarriages is evident: they were 99.259 in 1977, re- duced to 38.558 in 1979 then they reached an apparent steady state to the value around 60.000. The variation trend in 1978 would suggest an osmotic phenomenon between miscarriages and abortions which however would not affect the reported number of real abortions, some of which, probably, were previously registered as miscarriages. Biological systems tend to a stable equilibrium that is dependent on genetic heritage and concerning the human society on cultural heritage also. Any phenomenon in- ternal or external to human society may upset this stabil- ity. However like an elastic device, the system tends to cancel the disturbing effects and to return to a stable equilibrium. The mathematical model of biological memory gives a formal description of elasticity of biological systems. Tested on real data it can be useful to forecast the con- sequence of future laws concerning human society and, appropriately adapted, for the study of other biological systems. REFERENCES [1] ISTAT. (1997) La fecondità nelle regioni italiane. Analisi per coorti, Anni 1952-1993, Collana Informazioni Noise Rating 35, Istat, Roma. [2] ISTAT. (1998) La fecondità regionale nel 1994, Collana Informazioni Noise Rating 66, Istat, Roma. [3] ISTAT. (1999) La fecondità regionale nel 1995, Collana Informazioni Noise Rating 97, Istat, Roma. [4] ISTAT. (2000) La fecondità regionale nel 1996, Collana Informazioni Noise Rating 11, Istat, Roma. [5] ISTAT. (2007) Le statistiche del genere, Approfondimenti, Istat, Roma. [6] Caputo, M. and Kolari, J. (2001) An analytical model of the Fisher equation with memory function. Alternative Perspectives on Finance and Accounting, 1, 1-16. [7] Smith, D.P. and Keyfitz, N. (1977) Mathematical de- mography: selected papers, Springer, Berlin. [8] Keyfitz, N. and Flieger, W. (1990) World population growth and aging: demographic trends in the late twenti- eth century. The University of Chicago Press, Chicago. [9] Iannelli, M. (1995) Mathematical theory of age struc- tured population dynamics, Giardini Editori e Stampatori, Pisa. [10] Caputo, M., Nicotra, M. and Gloria-Bottini, F. (2008) Fertility transition: forecast for demography. Human Bi- ology, 80, 359-376. doi:10.3378/1534-6617-80.4.359 [11] Caputo, M. (2003) Population self-growth with memory, Proceedings Meeting: Fenomeni di auto-organizzazione nei sistemi biologici, Atti convegni Lincei. Accademia Nazionale dei Lincei, 106, 113-128. [12] Kiryakova, V. (1999) Generalized fractional calculus and applications. Pitman Research Notes in Mathematics, Longman, Harlow. [13] Podlubny, I. Fractional differential equations. Academic Press, New York. [14] Kilbas, A. and Srivastavam, H.M. and Trujillo, J.J. (2006) Theory and applications of fractional differential equa- tions. North Holland Mathem, Studies, 204. [15] Caputo M. and Plastino, (2004) W. Diffusion in porous layers with memory. Geophysics Journal of International, 158, 385-396. doi:10.1111/j.1365-246X.2004.02290.x [16] Mainardi, F. (1996) Fractional relaxation-oscillation and fractional diffusion-wave phenomena, Chaos. Solitons and Fractals, 7, 1461-1477. doi:10.1016/0960-0779(95)00125-5 [17] Baleanu, D. and Agraval, O.P. Fractional, (2006) Hamil- ton formalism within Caputo’s derivative. Czechoslovak Journal of Physics, 56, 1-11. [18] Körnig, H. and Müller, G. (1989) Rheological model and  M. Caputo et al. / Natural Science 3 (2011) 694-701 Copyright © 2011 SciRes. OPEN ACCESS 700 interpretation of postglacial uplift. Geophysical Journal Royal Astronomical Society, 98, 245-253. [19] Bonilla F.A. and Cushman, J.H. (2000) Role of boundary conditions on convergence and nlocality of solutions to stochastic flow problems in bounded domains. Water Resources Research, 36, 981-997. doi:10.1029/1999WR900279 [20] Iaffaldano, P., Caputo, M. and Martino, S. (2006) Ex- perimental and theoretical memory diffusion of water in sand. Hydrology and Earth System Science, 10, 93-100. doi:10.5194/hess-10-93-2006 [21] Jacquelin, J. (1984) Use of fractional derivatives to ex- press the properties of energy storage phenomena in electrical networks. Technical Report, Laboratoires Al- catel de Marcoussis. [22] Le Mehaute, A. and Crépy, G. (1983) Introduction to transfer motion in fractal media: the geometry of kinetics. Solid State Ionic, 9&10, 17-30. [23] Caputo, M. and Cametti, C. (2008) Diffusion with mem- ory in two cases of biological interest. Journal of Theo- retical Biology, 254, 697-703. doi:10.1016/j.jtbi.2008.06.021 [24] El Shaed, M.A. (2003) Fractional Calculus Model of Semilunar Heart Valve Vibrations. 2003 International Mathematica Symposium, Chicago. [25] Naber, M. (2004) Time fractional Schrödinger equation, Journal of mathematical Physik, 45, 83339-83352. [26] Caputo, M. and Di Giorgio, G. (2006) Monetary Policy, Memory and Output Dynamics, In: Monetary Policy and Institutions, G. Di Giorgio and F. Neri Eds., Essays in memory of M. Arcelli. Luiss University Press, Guido, 165-176. [27] Cesarone, F. Caputo, M. and Cametti, C. (2005) Memory formalism in the passive diffusion across a biological membrane. Journal Membrane Science, 250, 79-84. doi:10.1016/j.memsci.2004.10.018  M. Caputo et al. / Natural Science 3 (2011) 694-701 Copyright © 2011 SciRes. OPEN ACCESS 701701 APPENDIX A. THE SOLUTION OF EQ.2 GIVING THE EFFECT OF THE PERTURBATION To solve Eq.2 we use the Laplace Transform (LT) method. The LT, with variable p, of Eq.2 gives (13) 1 00 uu lpRlrkpbYgpYgypcR (A1) where Y(p) = LTy(t) and R(p) = LTr(t). It is no limitation to assume that the perturbation is initially nil, y(0) = y0 = 0, then isolating R as function of Y and p we find 0 u RkplpcbgpYlpc lrlpc (A2) with 001 2 01 exp exp 1exp exp Yatpptpt ppt pt (A3) When memory is absent (g = 0), one finds 0R kplpcbYlpclrlpc (A4) When l > 0, c > 0 or l < 0, c < 0, the effect of the perturb- bation is then 1 000 1exp LTbY lp c ba ctcptlHtt (A5) 0010 00 111 1exp 1exp 1exp tcptlHtttt lccptlH tt ttlcctt lHtt Since we are seeking the effect of memory we con- sider the case when all the perturbation is affected by it, that is b = 0, g 0; this effect is then obtained from (A2) substituting (A3) with b = 0, we find 01 01 1 0001 1 00 0011 00 1expd expd 12exp dexp d u tt tt uu tt tt uu LTagpYlpc agltut tvcvlvHt tt tvcvlvHt t ut tvcvlvHt tt tvcvlvHt t (A6) Assuming that the perturbation begins at the time t0 = 0 we obtain 1 1 1 11 00 2expd expd tt tuu u LTagpYlp caglut vcvlvttvcvlvHt t (A7) It is verified, with the help of Eq.A3 and of the ex- treme value theorem, that the asymptotic value of (A7) is nil, that is the effect of the perturbation y defined by Eq.4 is asymptotically nil. APPENDIX B. THE ASYMPTOTIC VALUE OF THE EFFECT OF THE PERTURBATION The asymptotic value of the effect of the perturbation is found by first obtaining the explicit expression of R(p), that is substituting Eq.A3 in Eq.A2, 001 2 01 exp exp 1exp exp 0 u Rkplpc abgp tp ptpt ppt pt lp clrlp c (B1) and then applying the extreme value theorem of the LT. We obtain 10 0 lim p rpRpkcabttc (B2) Since k/c is the asymptotic value in absence of pertur- bation, then the asymptotic effect of the perturbation is 10 ab ttc (B3)
|