International Journal of Geosciences, 2011, 2, 310-317
doi:10.4236/ijg.2011.23033 Published Online August 2011 (http://www.SciRP.org/journal/ijg)
Copyright © 2011 SciRes. IJG
Critical Factors for Run-up and Impact of the Tohoku
Earthquake Tsunami
Efthymios Lekkas, Emmanouil Andreadakis*, Irene Kostaki, Eleni Kapourani
Sc hool of Science, De partment of D ynamic, Tectonic and Appl i ed Geology,
National and Kapodistrian University of Athens, Athens,Greece
E-mail: *eandreadk@geol.uoa.gr
Received April 20, 2011; revised May 27, 2011; accepted July 7, 2011
Abstract
The earthquake of March 11 of magnitude 9 offshore Tohoku, Japan, was followed by a tsunami wave with
particularly destructive impact, over a coastal area extending approx. 850 km along the Pacific Coast of
Honshu Island. First arrival times and measurements and maximum height were recorded by the Japanese
monitoring system (wherever there was no failure of the equipment). The maximum run-up is well evident in
satellite images available through USGS, Google and other institutes. Moreover, personal observations of
Prof. Lekkas were made during a field survey in March 2011. The results of the study of the tsunami impact
and run-up show the variety of factors affecting the run-up, creating zones with similar phenomena, but also
specific locations where run-up exceeds by far the run-up zone maximum values. This differentiation, ob-
served also in the past by other authors, is here attributed to the general orientation of the coast, the distance
from the tsunami generation area, bathymetry offshore, the coastline morphology and land geomorphology.
In certain cases that funnelling and reflection effects in narrow gulfs parallel to the tsunami propagation vec-
tor were combined with narrow valleys onshore, peak run-up exceeded 20m, or even 40 m (Miyagi coastline,
Ogatsu, Onagawa, etc.).
Keywords: Tohoku, Earthquake, Tsunami, Run-Up
1. Magnitude and Intensity of the
Earthquake
On March 11 2011, the tectonic boundary between the
Pacific and Eurasian plates, off the coast of Northeastern
Japan, ruptured in a great (Mw = 9.0) earthquake, at
05:46:23 UTC (Universal Time Coordinated), 14:46:23
JST (Japan Standard Time) [1,2]. The hypocenter is cal-
culated at 32 km by JMA [2] and 24 km by USGS depth
[1]. Centroid Moment Tensor analysis showed a reverse
fault type with WNW-ESE compressional axis, corre-
sponding to depth and orientation of the Japan Trench [2].
Main rupture was located in the North-East of the rupture
starting point (shallower side of the hypocenter), and
maximum slip amounted to about 25 m [2]. The size of
the main fault is estimated at 450 km length and 150 km
width, confirmed by first day aftershock locations. Near-
source acceleration waveforms by National Research
Institute for Earth Science and Disaster Prevention
(NIED) [3], display two distinct phases of ground motion,
which suggest the existen ce of at least two areas of large
slip. Apparently, the fo cus belong s to the off Miyagi area
of subduction zone earthquakes. The main shock trig-
gered a major tsunami that swept the Eastern shoreline of
Honshu (main island). The main shock was preceded by
numerous foreshocks, the greatest of which occurred on
March 9, 2011 and had a magn itude of 7.5 [2]. The focal
mechanism of the earthquake is also consistent with a
subduction zone boundary. A large number of after-
shocks occurred, four of which measured Mw > 7.0. The
first of these aftershocks occurred quite soon (aprox. 30
min.) after the main shock and it measured 7.4, and three
more majo r ones meas ured 7.7, 7.5 an d 7 .4 [2].
A maximum seismic intensity of 7 (JMA scale) was
recorded at Kurihara City, Miyagi Prefecture. JMA in-
tensities of 6+ or 6– were observed in wide area along
East Honshu coast, in Iwate, Miyagi, Fukushima and
Ibaraki prefectures (Figure 1) [2]. The meisoseismal
area extends within the tectonic boundaries of N.
American-Okhotsk plate, that is, on the upper block of
the rupture, as expected.
E. LEKKAS ET AL.
Copyright © 2011 SciRes. IJG
311
Figure 1. Intensity map for the 9.0 Mw event of March 11, 2011 (Data from JMA, map by authors). The Japanese intensity
scale is used here, so this does not correspond to EMS or Mercalli intensities but instead it reflects measured seismic accel-
eration distribution.
2. Tsunami Characteristics
Tohoku was hit by tsunami intensities ranging in the
worst cases from IX up to XI (or even XII) in the Papa-
dopoulos-I mamura (2001) scale [ 4]. That is, in the worst
of cases (XII intensity tsunami) all masonry buildings
were demolished. From XI intensity up, floodwater
backwash has drifted all debris, cars etc. to the sea and
objects of all sizes were deposited as sediment into low
lying coastal areas. This took place especially where
backwash was obstructed by obstacles such as embank-
ments, hills, forested areas, elevated roads etc. and in
areas that had sub sided belo w s ea le vel .
Coastal subsidence due to earthquake deformation was
measured by the Geospatial Information Authority of
Japan [5], showing a maximum of 2 m subsidence off-
shore and a maximum of 1 - 1.5 m onshore, namely at
Ishinomaki area, Miyagi prefecture and Ojika peninsula.
A vertical deformation of 1.2 m was measured at Ojika
peninsula. These areas suffered thousands of casualties
because of the tsunami inundation, since the tsunami
wave arrived at offshore Miyagi area first, combined
with the maximum observed subsidence. Even greater
uplift was observed at the easternmost part of the Eura-
sian plate, until the Japan Trench. Maximum uplift was
measured over 4.5 m, 20 km east of the epicentral area
(Figure 2).
JMA issued the first tsunami arrival, recorded at 14:45
JST at Kamaishi, Iwate prefecture, as a sea withdrawal
[6,7]. The fact that the first tsunami arrival is recorded
simultaneously or even earlier than the earthquake waves
themselves may be an indication of crustal deformation,
subsidence as a result of the eart h q uake rupture.
First actual tsunami arrival is recorded at Ishinomaki,
Miyagi prefecture, at 14:46 JST with a measured height
of 0.1 m.
E. LEKKAS ET AL.
Copyright © 2011 SciRes. IJG
312
Figure 2. Tsunami run-up zones for the Tohoku earthquake 11-3-2011. Propagation vectors are marked with black arrows,
indicative peak run-ups are marked with red triangles and run-up values with black-yellow numbers. Contour lines show
crust uplift (red) and subsidence (blue) in meters. The maximum runup zones indicate areas where runup generally did not
exceed the indicated elevation, except for the cases of peaks, due to local conditions, discussed in the text.
The maximum tsunami height was recorded by JMA
at Miyako, Iwate prefecture, at March 11 2011, 15:26
JST reaching a height of 8.5 m. It is clear that tsunami
run-up reached a greater height, as concluded by field
surveying and disasters. However, estimations of tsu-
nami height are higher than the ones recorded by JMA.
Port and Airport Research Institute (PARI) reports inun-
dation up to 14.8 m (Onagawa port) [8]. This is not so
surprising though, if one takes into account that almost
one kilometer inland, the tsunami height was measured
to more than 10m (Figure 5).
Run-up is defined as “the maximum vertical elevation
of a point on initially dry land that is inundated by the
waves” [9]. The measurements in Table 1 show first
arrival and maximum height in Hokkaido Prefecture
(Hokkaido Island north of Honshu Island) and Aomori,
Iwate, Miyagi, Fukushima, and Ibaraki Prefectures,
along East coast of Honshu, from North to South [6,7]. A
E. LEKKAS ET AL.
Copyright © 2011 SciRes. IJG
313
Table 1. First arrival times and heights and maximum measured heights of tsunami wave as recorded by JMA, from Hok-
kaido, Aomori, Iwate, Miy agi, Fukus hima and Ibaraki Prefectures.
Location Date/Time (JST) First arrival height (m)Date/Time (JST) Maximum measured height (m)
Earthquake occurr ence 11 March 14:46
Nemuro (Hokkaido P ref.) 11 March 15:34 <+0.1 m 11 March 15:57 +2.8m
Tokachi (Hokkaido Pref.) 11 March 15:26 –0.2 m 11 March 15:57 >+2.8m
Urakawa (Hokkaido Pref.) 11 March 15:19 –0.2 m 11 March 16:42 +2.7m
Mutsu (Aomori Pre f.) 11 March 15:20 –0.1 m 11 March 18:16 +2.9m
Miyako (Iwate Pref .) 11 March 14:48 +0.2 m 11 Ma rch 15:26 >8.5m
Kamaishi (Iwate Pref.) 11 March 14:45 –0.1 m 11 March 15:21 >+4.1m
Ofunato (Iwate Pref.) 11 March 14:46 –0.2 m 11 March 15:18 >8.0m
Ishinomaki (Miyagi Pref.) 11 March 14:46 +0.1 m 11 M arch 15:25 >+7.6m
Soma (Fukushima Pref.) 11 March 14:55 +0.3 m 11 March 15:50 >+7.3m
Oarai (Ibaraki Pref.) 11 March 15:15 +1.8 m 11 March 16:52 +4.2m
great percentage of Eastern Honshu low-lying coastal
areas were inundated by the tsunami wave. Ibaraki and
Chiba prefectures were less inundated than the northern
areas (Chiba less than Ibaraki), mainly due to increased
distance to tsunami generation area, less crust deforma-
tion and coastal orientation (Chiba).
Inundation refers to the maximum horizontal penetra-
tion of the waves in the direction perpendicular to the
beach, during the flooding [9]. The identification of a
data point characterizing water penetration can be made
either on the basis of the recognition of a specific wa-
termark, such as a debris line deposited by the wave,
either on land or in vegetation, or through personal re-
ports from eyewitnesses. On occasion, it may be possible
to determine neither run-up, nor inundation, but only to
infer the local flow depth, usually from watermarks on
the sides of walls or from debris left dangling on trees or
posts.
The tsunami generation area extended for several hun-
dred kilometers along the uplift zone of the crust defor-
mation area. The combination of uplift and subsidence
zones instantly built up a potential difference that
reached the maximum of 6.5 meters offshore, initiating
the wave. Run-up was zoned along the meisoseismal area
of Tohoku coast, cr eating five major zon es. A maximum
run-up zone developed at Miyagi coast and South Iwate
coast (zone C), two medium run-up zones extended
along North Iwate coast and Fukushima coast (zones B
and D respectively) and two minimum run-up zones ex-
tended at Aomori coast, and the coast of Ibaraki and
Chiba (zones A and E).
3. Peak Run-Up Locations
Field observations in Tohoku, and especially Miyagi,
Fukushima, Ibaraki and Iwate prefectures, showed that
there are many areas where run-up exceeded the general
maximum value by far. That is, in Miyagi, where maxi-
mum run-up was generally below 15 m, there were loca-
tions that it reached more than 20, 30 or 40 meters. It
was observed that this happened in small valleys with
rather high slope angle, which are in fact the inland con-
tinuation of respective similar shaped bays and small
gulfs. In the following (Figures 3, 4, 5) the highest ob-
served run-up locations are shown in Ogatsu and Ona-
gawa, where run-up exceeded 30 and 40 meters respec-
tively.
4. Discussion
A large amount of data and thorough research on tsunami
generation, propagation and inland propagation derived
from various researchers and sources, especially in the
recent decades, and mostly after the Indonesian tsunami
of 2004. The latter, gave the opportunity of investigation
along all kinds of distances from the source, along sev-
eral kinds of shoreline and bathymetries and in areas
with a wide range of magnitudes for tsunami run-up,
inundation and depth. The parameters examined for their
implication on tsunami run-up for the Tohoku earthquake
in this paper, have been individually or generally ana-
lyzed and reviewed by many for previous cases. Thus,
some of their conclusions can be compared to observa-
tions of the present investigation.
Geist [9] summarizes some of these conclusions of
previous investigations on the subject. Carrier [10] sug-
gests that the largest tsunami amplitudes in many cases
are traced to the direct arrival of the tsunami broadside
from the rupture area, while, along shoreline segments
oblique to the rupture area, the largest tsunami ampli-
tudes are attributed to the excitation and propagation of
edge waves [10-13] (trapped long waves analogous to
E. LEKKAS ET AL.
Copyright © 2011 SciRes. IJG
314
Table 2. Comparative data for the tsunami run-up zones afte r the Tohoku e a rthquake.
Zone Area
Average max.
Run-up (m) Run-up
peaks (m)
Tsunami propagation
vector vs. shoreline
direction
Minimum
Distance from
epicentre (km)
Minimum
Distance from
offshore uplift
(
km
)
Subsidence
onshore (m)
Maximum
Uplift offshore
(m)
A Aomori <5 Subparallel 270 130 0.0 - 0.5 0.0 - 0.5
B N. Iwate <10 Subparallel – Diagonal180 78 0.5 - 1.0 0.5 - 1.0
C S. Iwate, Miyagi <15 42, 37, 28 Perpendicular 132 70 1.0 - 1.5 4.5
D Fukushima <10 13,12 Perpendicular 178 84 0.5 - 1.0 2.5 - 4.5
E Ibaraki <5 7 Perpendicular –
Diagonal 240 40 0.0 - 0.5 1.0 - 2.0
E Chiba <5 Subparallel 322 40 0.0 - 0.5 0.0 - 0.5
Figure 3. Three satellite images in subsequent zoom-in and a photo, from Ogatsu–Wan and Ogatsu town (Miyagi, zone C,
15m maximum run-up). Bathymetry and onshore geomorphology created funneling effects and wave reflection within the
canyon and narrow valleys enhanced the tsunami effects. As a result, peak run-up reached the elevation of 38 m. Not only did
the tsunami reach this elevation, but it arrived with several meters of height, performing a totally devastating run (Photos A,
B, C from Google Earth, photo D by E. Lekkas during the field trip to Japan).
Figure 4. Four satellite images in subsequent zoom-in, from Onagawa Wan a nd Onagawa tow n (Miyagi, zone C, 15 maximum
run-up). For the same reasons as for Ogatsu, Onagawa was hit by extremely disastrous tsunami run-up reaching 42 meters. In
the red circles (photos A, B and C) a 30 m long vessel is shown, at a distance of 750 meters from the coast (elevation 21 m).
E. LEKKAS ET AL.315
Figure 5. Onagawa town. At least 10m of wave height swept away the whole “corridor” within the narrow valley. The red
circle indicates the position of a van.
Love waves in seismology [14]). Ishii and Abe suggest
that phase and group velo cities of edge waves depend on
the shelf slope angle [15]. For irregular coastlines, edge
waves will be scattered and reflected and, where these
different phases (trapped and nontrapped) interfere con-
structively and at antipodes, large nearshore tsunami
amplitudes can be realized.
Lavigne et al. [16,17] report that marine surveys after
the 2004 tsunami refer that uniformity of tsunami runup
indicates that there is limited co-seismic landslide pres-
ence involved. They conclude that local geomorphologi-
cal configurations of the coastline and/or the seafloor
were responsible for exceptional runup heights along the
west coast of the Banda Aceh district (Indonesia).
Pattiaratchi and Wijeratne (2009) [18] studied sea-
level records during the Indonesian tsunami at stations
on Sri Lanka and Australia. They showed that similar
tsunami behaviour responds to similar local and regional
topography, although the relative magnitude of the tsu-
namis varies according to the differences of the source.
Synolakis et al. [19], Duong et al. [20], Jinadasa [21],
Parcharidis et al. [22] and Yeh et al. [23], among many
others studied the Indian Ocean tsunami, reaching simi-
lar results after investigations along the affected areas.
5. Conclusions
Tsunami run-up zoning and peaks are the result of a
combination of factors, summarized at the following:
Orientation of the propagation vector to the mean
shoreline direction. Run-up was higher at areas where
the tsunami propagation vector was perpendicular to
the main shoreline direction. This took place at the
areas of South Iwate, Miyagi, Fukushima and a part
of Ibaraki coast. Oblique shorelines were generally
affected by lower run-up, and as it seems by the map
zonation, this parameter along with the distance from
the source created the first order effects, as far as
run-up is concerned, in this case, once the run-up
peaks are observed within the broader zones mapped.
Distance from the tsunami generation area. Energy of
tsunami wave is consumed along the way, so the
shorter the distance, the higher the tsunami energy,
and the higher the run-up. The shortest distances from
the epicenter were from South Iwate and Miyagi,
while the shortest distances from the nearest uplift
area were from Ibaraki, Chiba and Miyagi. Of course
it is difficult to discriminate which of these two (ori-
entation or distance) was the dominant parameter,
once both distance and obliquity of shorelines are in-
creased laterally from the meisoseismal area towards
north and south.
Bathymetry of the offshore area. Coastal geomor-
phology, bathymetry and seafloor topography are be-
lieved to be the major influencing factors to deter-
mine the severity of tsunami disasters, as well as nar-
row continental shelves and can yons. On the contrary,
natural barriers and coral reefs protect the coasts from
Copyright © 2011 SciRes. IJG
E. LEKKAS ET AL.
316
tsunamis. In major can yons, funneling effects and over-
lapping reflections further enhance tsunami height.
Land morphology actually proved to enhance run-up
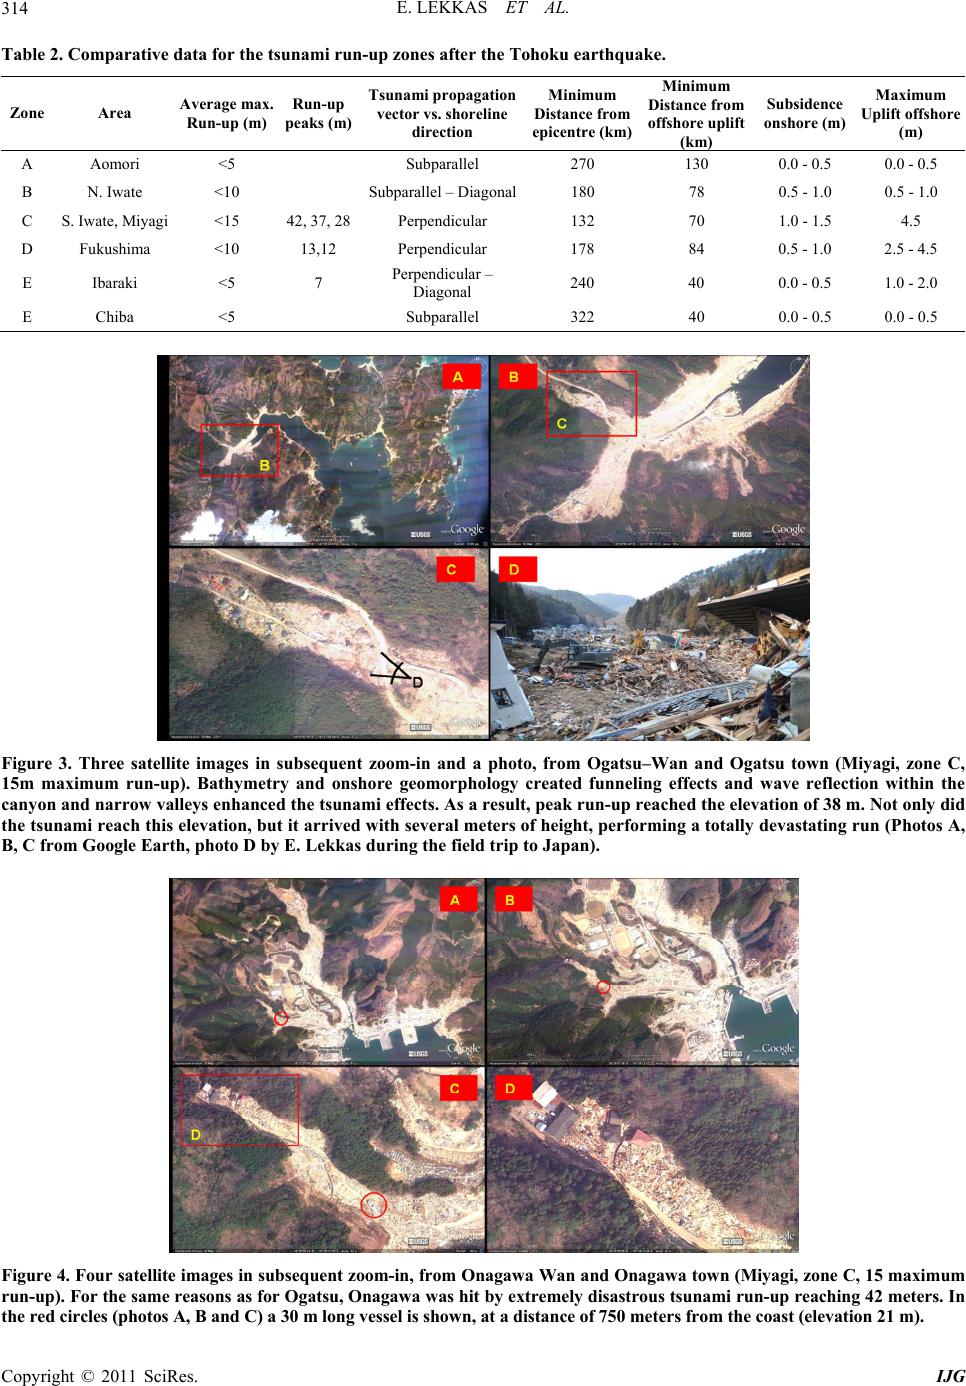
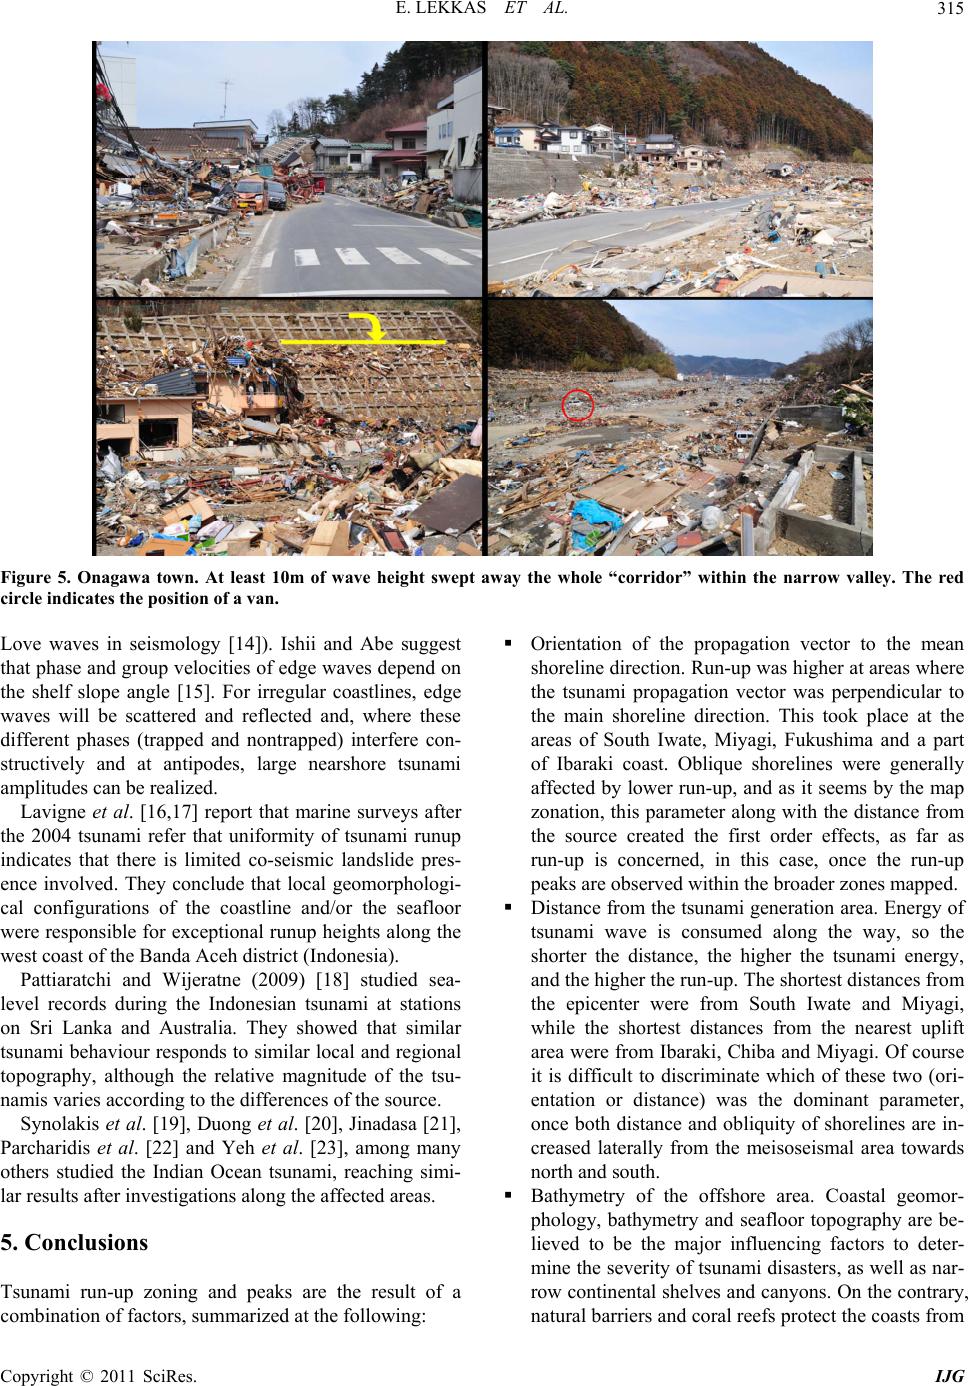
in the same way as bathymetry. That is, the highest
peaks of tsunami run-up were observed where narrow,
short, funnel-like valleys reached the coastline with a
direction parallel to the tsunami propagation vector.
Run-up in these areas exceeded by far the zone
maximum, due to the particularities of geomorphol-
ogy. For instance, within the 15 m maximum run-up
zone, altitudes of 28 m, 38 m and 42 m were ob-
served at Ogatsu and Onagawa (Miyagi prefecture).
Crustal deformation during the event, which was
simply mentioned here as a si mple potential d ifferen-
tiation during the quake (like an instant change of
hydraulic head in adjacent areas) has to be further in-
vestigated as a factor for run-up. The size of the area
and the magnitude of the deformation suggest a very
large scale tsunami generation area, where the source
mechanism itself would have to be examined as a
whole.
6. References
[1] U. S. Geological Survey Magnitude 9.0, “Near the East
Coast of Honshu,” Japan.
http://earthquake.usgs.gov/ (accessed at April 2011).
[2] Japan Meteorological Agency, “Tohoku Region Pacific
Ocean Earthquake Report 1-34, March 11- April 8 2011,”
in Japanese, 2011.
http://www.jma.go.jp (last accessed April 2011).
[3] National Research Institute for Earth Science and Disas-
ter Prevention, “2011 Off the Pacific Coast of Tohoku
earthquake, Strong Ground Motion,” Emergency Meeting
of Headquarters for Earthquake Research Promotion,
March 13, 2011.
http://www.bosai.go.jp/e/ (accessed April 2011).
[4] G. Papadopoulos and F. Imamura, “A Proposal for a New
Tsunami Intensity Scale,” ITS 2001 Proceedings, Session
5, No. 5-1, 2001, pp. 569-577.
[5] Geospatial Information Authority of Japan, “The 2011 off
the Pacific Coast of Tohoku Earthquake: Coseismic Slip
Distribution Model (Preliminary),” 2011.
http://www.gsi.go.jp (last accessed April 2011).
[6] Japan Meteorological Agency, “The 2011 off the Pacific
Coast of Tohoku Earthquake,” 2011.
http://www.jma.go.jp/jma/en/2011_Earthquake.html (last
accessed April 2011).
[7] Japan Meteorological Agency, “Tsunami Observation
Stations Report: Miyako, Ofunato. 23 March 2011,” in
Japanese, 2011.
http://www.jma.go.jp, (last accessed April 2011).
[8] Port and Airport Research Insitute (PARI), “Executive
Summary of Urgent Field Survey of Earthquake and
Tsunami Disasters by the 2011 off the Pacific Coast of
Tohoku Earthquake,” March 25, 2011.
http://www.pari.go.jp/, last accessed April 2011.
[9] E. L. Geist, “Complex Earthquake Rupture and Local
Tsu- Namis,” Journal of Geophysical Research, Vol. 107,
2002, pp. 2086-2101. doi:10.1029/2000JB000139
[10] G. F. Carrier, “On-Shelf Tsunami Generation and Coastal
Propagation, in Tsunami,” In: Y. Tsuchiya and N. Shuto,
Eds, Progress in Prediction, Disaster Prevention and
Warning, Kluwer Academy Publishing, Norwell, 1995.
pp. 1-20,
[11] J. D. Fuller and L. A. Mysak, “Edge Waves in the Pres-
ence of an Irregular Coastline,” Journal of Physical
Oceanography, Vol. 7, No. 6, 1977, pp. 846-855.
doi:10.1175/1520-0485(1977)007<0846:EWITPO>2.0.C
O;2
[12] F. I. Gonzalez, K. Satake, F. Boss and H. O. Mofjeld,
“Edge Wave and Non-Trapped Modes of the 25 April
1992 Cape Mendocino Tsunami,” Earth and Environ-
mental Science, Vol. 144, No. 3-4, 1995, pp. 409-426.
doi:10.1007/BF00874375
[13] K. Fujima, R. Dozono and T. Shigemura, “Generation
and Propagation of Tsunami Accompanying Edge Waves
on a Uniform Sloping Shelf,” Coastal Engineering, Vol.
42, 2000, pp. 211-236.
[14] K. Sezawa and K. Kanai, “On Shallow Water Waves
Transmitted in the Direction Parallel to a Sea Coast, with
Special Reference to Love-Waves in Heterogeneous Me-
dia,” Bulletin of the Earthquake Research Institution, Vol.
17, 1939, pp. 685-694.
[15] H. Ishii and K. Abe, “Propagation of tsunami on a linear
slope between two flat regions, part I, Edge wave,” Jour-
nal of Physics of the Earth, Vol. 28, No. 5, 1980, pp.
531-541. doi:10.4294/jpe1952.28.531
[16] P. R. Cummins, L. S. L. Kong and K. Satake, “Introduc-
tion to “Tsunami Science Four Years after the 2004 In-
dian Ocean Tsunami, Part II: Observation and Data
Analysis,” Pure and Applied Geophysics, Vol. 165, No.
11-12, 2009.
[17] F. Lavigne, et al., “Reconstruction of Tsunami Inland
Propagation on December 26, 2004 in Banda Aceh, In-
donesia, through Field Investigations,” Pure and Applied
Geophysics, Vol. 166, No. 1-2, 2009, pp. 259-281.
doi:10.1007/s00024-008-0431-8
[18] C. B. Pattiaratchi and E. M. S. Wijeratne, “Tide gauge
observations of the 2004-2007 Indian Ocean tsunamis
from Sri Lanka and western Australia,” Pure and Applied
Geophysics, Vol. 166, No. 1-2, 2009, pp. 233-258.
doi:10.1007/s00024-008-0434-5
[19] C. E. Synolakis and L. Kong, “Runup of the December
2001 Indian Ocean Tsunami,” Earthquake Spectra, Vol.
22, 2006, pp. S67-S91.
[20] N. A Duong, F. Kimata and I. Meilano, “Assessment of
Bathymetry Effects on Tsunami Propagation in Viet
Nam,” Advances in Natural Sciences, Vol. 9, No. 6,
2008.
[21] S. U. P. Jinadasa, “Interaction of Tsunami Wave Propa-
gation with Coastal Bathymetry and Geomorphology: A
Case Study in Sri Lanka,” Hydrographic and Oceano-
graphic Department, Japan Coast Guard, Tokyo, 2008.
Copyright © 2011 SciRes. IJG
E. LEKKAS ET AL.
Copyright © 2011 SciRes. IJG
317
[22] I. Parcharidis, E. Lekkas, and M. Foumelis, “Tsunami
Impact Depending on Coastal Morphology: The Case of
Phuchet Island and Khao Lac Coast (Thailand),” Interna-
tional Symposium on the Geodynamics of Eastern Medi-
terranean: Active Tectonics of the Aegean Region. Istan-
bul, 2005, 238.
[23] H. Yeh, R. K. Chadha, M. Francis, T. Katada, G. Latha,
C. Peterson, G. Raghuraman and J. P. Singh, “Tsunami
Runup Survey along the Southeast Indian Coast”, Earth-
quake Spectra, Vol. 22, No. S3, 2006, pp. S173-S186.
doi:10.1193/1.2202651