Open Access Library Journal
Vol.02 No.06(2015), Article ID:68416,6 pages
10.4236/oalib.1101326
Ionospheric Anomalies Observed by GPS-TEC Prior to the 3rd of July 2013 Uganda’s Earthquake
Enoch Elemo
Centre for Atmospheric Research, Anyigba, Nigeria
Email: enochelemo@yahoo.com
Copyright © 2015 by author and OALib.
This work is licensed under the Creative Commons Attribution International License (CC BY).
http://creativecommons.org/licenses/by/4.0/


Received 6 May 2015; accepted 26 May 2015; published 1 June 2015
ABSTRACT
Recently ionospheric variability remains one of the most intensive studies in the area of ionospheric physics. Despite the massive improved knowledge of its dynamics, the ability to use this data to provide early, as well as valid warning of upcoming earthquakes (seismo-ionospheric coupling) is still controversial. However, anomalous behaviours of TEC in the ionosphere before the occurrence of earthquakes have received several attentions by scientists. In this paper, GPS-TEC variations of 31 days (15 days before and 15 days after the occurrence of Uganda’s earthquake of July 3rd 2013) were examined to see if there was any seismo-ionospheric coupling. Any correlation between the identified TEC anomalies and the earthquake in question was examined. It was discovered that, there was the presence of an anomaly that occurred on the 8th day of the data. And then there was another set of consistent rise in the TEC values that started 4 days before the day of the earthquake and continued till the day of the earthquake. A change of situation was however noticed after the occurrence of the earthquake. The combination of all these led to the conclusions that the anomaly in the TEC is an ionospheric signature for the earthquake.
Keywords:
Ionospheric Variability, Seismo-Ionospheric Coupling, GPS-TEC Variations, Uganda’s Earthquake, Upper Anomalies, Ionospheric Signatures
Subject Areas: Atmospheric Sciences, Geophysics

1. Introduction
Extensive discussions on observations and theories of electromagnetic phenomena associated with seismic activities were thoroughly discussed by [1] - [5] . Thus far, the anomaly/precursor noticed from the complicated signals prior to an earthquake is still debated because factors well-known such as geomagnetic activity may also trigger a similar response within the ionosphere leading to the noticed TEC anomalies. This debate was strongly addressed by applying statistical analyses to a large number of earthquakes for pre-seismic ionospheric anomalies on various temporal and spatial scales. These were done to see if there is any relationship between the perturbations noticed and the earthquakes [5] - [7] . [5] used the quasi-DC vertical field generated during the earthquake to explain the anormalous ionospheric electron density. Others like [4] went ahead to indicate the possibility that seismo-generated gravity waves trigger fluctuations (from few seconds to minutes) in the ionosphere such as electron density, electric field, vertical motion etc. before the occurrence of earthquakes. [6] [8] - [11] found out that the GPS-TEC often decreases anomalously in the afternoon over a period of 1 to 5 days before M ≥ 5.4 earthquakes in Taiwan. [5] [12] - [14] have all reported in their papers on deviations in the daily values of the maximum electron concentration of F2 layer or total electron content (TEC) in the area of an earthquake’s epicenter within some days prior to the main shock. While much work has been done in this area in the other parts of the world, seismo-ionospheric coupling studies using earthquakes in Africa have not been fully studied at all. The main objective of this work is to apply the method described by [7] [11] to an earthquake that occurred in Africa. This method uses GPS-TEC data to confirm seismo-ionospheric coupling of an earthquake. The Uganda’s earthquake occurred on Wednesday, 3rd of July 2013 at about 19:21:46 UTC.
2. Methodology
A seismic signal from the GPS-TEC data is clearly identified by adopting Liu et al method to estimate the vertical TEC of the ionosphere over the epicentre of the earthquake [7] [11] . TEC data of 31 days running around the time of the earthquakes (15 days before and 15 days after) were chosen. The median X over the interval of 15 running days were calculated together with the associated inter-quartile between the lower quartile (LQ) and the upper quartile (UQ).
TEC anomalies were isolated by setting the:
 (1)
(1)
 (2)
(2)
Liu et al. method clearly stated that perturbations related to possible earthquakes are detected if the observed TEC data lies outside of either the lower or upper bound, with confidence level for such signal said to be as high as between 80% - 85% [8] - [10] . Only anomalies that persisted for at least 3 hrs in a day were examined. This means that an anomaly can only be considered a seismic signal if and only if its value is above the lower/upper bounds for more than 3 hours in a day [7] . The reason for this is to reduce the disturbances caused by other geophysical phenomena such as geomagnetic storms and also to able to avoid the large variability in the day to day values [15] [16] . Dst index and Kp index of the same 31days were also used to check for the geomagnetic activity within the period of study.
3. Result
Upper bound was exceeded on day: 1, 3, 5, 6, 8, 11, 17, 20 - 22, 24 - 26, 29 and 30. From the result, it is clear that there were more upper anomalies after the earthquake than before it. Figure 1 reveals the GPS-TEC data for the whole 31 days of the work. It is clear that at 173 hours (8th day of the data), there was an anomaly which happened to be the largest TEC value. Figure 2 clearly shows the observed variation before the day of the earthquake. It can be seen from the graph that from 250 till 382 hours, which is from the 12th day of the data to the day of the earthquake, there was an abnormal enhancement of the electron densities as seen from the graph. In other words, the GPS-TEC data increase anomalously in the afternoon from 4 days to the earthquake and continue till the day of the event. Figure 3 shows the variation of the TEC after the earthquake. It is very clear from Figure 2 and Figure 3 that there exist a different scenario before and after the earthquake. Figure 4 and Figure 5 clearly showed the presence of geomagnetic activity at the 269 hrs in Figure 4 which also reflected at the same time in Figure 5 (12th day of the data). However, what is clear from the two graphs is that, from the 13th day of the data till even 3days after the earthquake, there was no geomagnetic activity. From Figure 6 it can be seen that even though upper bounds were more after the day of the earthquake than before it. However, the values of the upper bounds were higher before the earthquake than after. Table 1 shows the characteristic of the Uganda’s earthquake.

Figure 1. Observed GPS-TEC from June 18 to July 18, 2013.

Figure 2. Observed GPS-TEC data days before the day of the earthquake.

Figure 3. Observed GPS-TEC data days after the day of the earthquake.

Figure 4. Dst index of the examined period.

Figure 5. Shows variations in the index geomagnetic activity, Kp, within the examined time period.

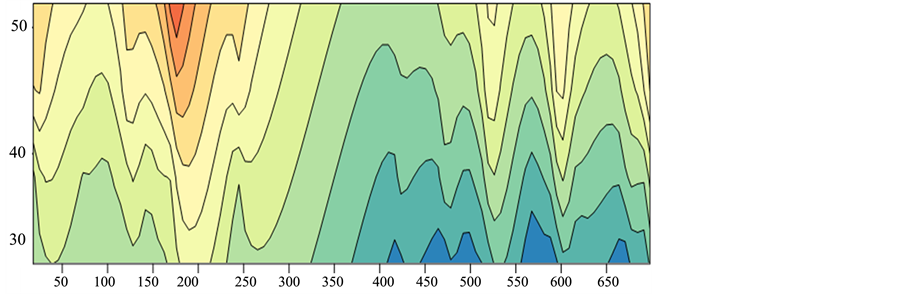
Figure 6. Contour showing the upper bounds before and after the earthquake.
4. Discussion
This work studied the ionospheric anomaly associated with the Uganda’s earthquake by examining the GPS- TEC variation. For the seismo-ionospheric perturbations to be detected, 31 days data (15 days before the day and 15 days after) were used. The median and the associated standard deviation were used to construct the upper

Table 1. Characteristics of Uganda earthquake.
and lower bounds. The result clearly showed the occurrence of more anomalies after the day of the earthquake than before it, but the intensity of anomalies were also noticed to be stronger before the day of the earthquake than after it. This further showed that the pre-earthquake ionosphere had major contributions from the earthquake. [17] - [19] all pointed out that the seismogenic perturbation is as a result of anomalous vertical electric field near the earth surface above the zone which penetrated the ionosphere. [15] however, showed that the eastward plasma E X B drift may caused the abnormal enhancement of the TEC causing it to shift slightly to the east of the epicentre. However, the fact that anomalous enhancement in election density continued much more after the initial day while there was not any geomagnetic activity clearly shows a non global origin but of seismic source. [5] stated that different processes of seismic forcing between lithosphere, ionosphere and atmosphere will results in different anomalies over the epicentre. The consistent anomalous increase in the GPS-TEC in the afternoon over the period of 4 days before the earthquake is in line with [7] [10] [11] and can be attributed to the downward electric field at the surface of the then impending earthquake as described by [7] .
5. Conclusions
Understanding the ionosphere over Africa is still far from what it should be. Very little is known and some works by the author have confirmed that certain limits that the literatures say about seismo-ionospheric coupling are exceeded in African ionosphere. Some reasons why more works should be done include:
・ It has been observed that in this region the Plasma bubbles are much deeper and occur more frequently than bubbles observed in any other longitudinal sector [20] [21] .
・ It was also reported that the depletions in the African region rise to high altitudes (up to 1000+ km) more frequently compared to other longitudes [22] .
・ The African region is the longitude sector where the peak in large-scale bubble activity (zonal width, depletion level, and spacing) is maximum. No other region in the globe shows similar characteristics [21] [22] .
Acknowledgements
Special appreciation goes to the Africa Geodetic Reference Frame (AFER) and WDC for Geomagnetism, Kyoto for providing the TEC data and geomagnetic indices used for this work.
Cite this paper
Enoch Elemo, (2015) Ionospheric Anomalies Observed by GPS-TEC Prior to the 3rd of July 2013 Uganda’s Earthquake. Open Access Library Journal,02,1-6. doi: 10.4236/oalib.1101326
References
- 1. Hayakawa, M. and Fujinawa, Y. (1994) Electromagnetic Phenomena Relater to Earthquake Predication. Terra Science Publishing Co., Tokyo.
- 2. Hayakawa, M. (1999) Atmospheric and Ionospheric Electromagnetic Phenomena Associated with Earthquakes. Terra Science Publishing Co., Tokyo.
- 3. Hayakawa, M., Molchanov, O.A., Kodama, T., Afonin, V.V. and Akentieva, O.A. (2000) Plasma Density Variations Observed on a Satellite Possibly Related to Seismicity. Advances in Space Research, 26, 1277-1280.
http://dx.doi.org/10.1016/S0273-1177(99)01224-7 - 4. Hayakawa, M. and Molchanov, O.A. (2002) Seismo-Eletromagnetics: Lithosphere-Atmosphere-Ionosphere Coupling. Terra Science Publishing Co., Tokyo.
- 5. Pulinets, S.A. and Boyarchuk, K.A. (2004) Ionospheric Precursors of Earthquakes. Springer, Berlin.
- 6. Liu, J.Y., Chen, Y.I., Jhuang, H.K. and Lin, Y.H. (2004) Ionospheric f0F2 and TEC Anomalous Days Associated with M ≥ 5.0 Earthquakes in Taiwan during 1997-1999. Terrestrial Atmospheric and Oceanic Sciences, 15, 371-383.
- 7. Liu, J.Y., Chen, Y.I. and Chen, C.H. (2009) Seismoionospheric GPS Total Electron Content Anomalies Observed before the 12 May 2008 Mw 7.9 Wenchuan Earthquake. Journal of Geophysical Research A, 114, Article ID A04320.
- 8. Liu, J.Y., Chen, Y.I., Pulinets, S.A., Tsai, Y.B. and Chuo, Y.J. (2000) Seismo-Ionospheric Signatures Prior to M ≥ 6.0 Taiwan Earthquakes. Geophysical Research Letters, 27, 3113-3116.
http://dx.doi.org/10.1029/2000GL011395 - 9. Liu, J.Y., Chen, Y.I., Chuo, Y.J. and Tsai, H.F. (2001) Variations of Ionospheric Total Content during the Chi-Chi Earthquake. Geophysical Research Letters, 28, 1381-1386.
http://dx.doi.org/10.1029/2000GL012511 - 10. Liu, J.Y., Chuo, Y.J., Shan, Y.J., Tsai, S.J., Chen, Y.B., Pulinets, S.A. and Yu, S.B. (2004) Pre-Earthquake Ionospheric Anomalies Registered by Continuous GPS TEC Measurements. Annals of Geophysics, 22, 1585-1593.
http://dx.doi.org/10.5194/angeo-22-1585-2004 - 11. Liu, J.Y., Tsai, Y.B. and Ma, K.F. (2006) Precursory Phenomena Associated with the 1999 Chi-Chi Earthquake in Taiwan as Identified under the iSTEP Program. Physics and Chemistry of the Earth, 31, 365-377.
- 12. Pulinets, S.A., Khegai, V.V., Boyarchuk, K.A. and Lomonosov, A.M. (1998) Atmospheric Electric Field as a Source of Ionospheric Variability. Physics-Uspekhi, 41, 515-522.
http://dx.doi.org/10.1070/PU1998v041n05ABEH000399 - 13. Pulinets, S.A., Hernandez-Pajares, M. and Depuev, V.K.H. (2003) Equatorial Anomaly Variability as a Function of the Local Time and the Longitude. Proceedings of the IRI Task Force Activity, Trieste, 159-166.
- 14. Zakharenkova, I.E., Shagimuratov, I.I. and Tepenitzina, N.Yu. (2008) Anomalous Modification of the Ionospheric Total Electron Content Prior to the 26 September 2005 Peru Earthquake. Journal of Atmospheric and Solar-Terrestrial Physics, 70, 1919-1928.
http://dx.doi.org/10.1016/j.jastp.2008.06.003 - 15. Liu, L., Wan, W., Zhang, M.L., Zhao, B. and Ning, B. (2008) Prestorm Enhancement in NmF2 and Total Electron Content at Low Latitudes. Journal of Geophysical Research, 113, A02311.
http://dx.doi.org/10.1029/2007JA012832 - 16. Zhao, B.Q., Wang, M. and Yu, T. (2008) Is an Unusual Large Enhancement of Ionospheric Electron Density Linked with the 2008 Great Wenchuan Earthquake? Journal of Geophysical Research, 113, A11304.
http://dx.doi.org/10.1029/2008JA013613 - 17. Kelley, M.C. (1989) The Earth Ionosphere. Elsevier Press, Amsterdam, 487p.
- 18. Fujinawa, Y. and Tkahashi, K. (1990) Emission of Electromagnetic Radiation Preceeding the Ito Seismc Swarm of 1989. Nature, 347, 376-378.
http://dx.doi.org/10.1038/347376a0 - 19. Pulinets, S.A., Boyarchuk, K.A., Hegai, V.V., Kim, V.P. and Lomonosov, A.M. (2000) Quasielectrostatic Model of Atmosphere-Theremosphere-Ionosphere Coupling. Advances in Space Research, 26, 1209-1218.
- 20. Hei, M.A., Heelis, R.A. and McClure, J.P. (2005) Seasonal and Longitudinal Variation of Largescale Topside Equatorial Plasma Depletions. Journal of Geophysical Research, 110, A12315.
http://dx.doi.org/10.1029/2005JA011153 - 21. Yizengaw, E., Moldwin, M.B., Mebrahtu, A., Damtie, B., Zesta, E., Valladares, C.E. and Doherty, P.H. (2011) Comparison of Storm Time Equatorial Ionospheric Electrodynamics in the African and American Sectors. Journal of Atmospheric and Solar-Terrestrial Physics, 73, 156-163.
http://dx.doi.org/10.1016/j.jastp.2010.08.008 - 22. Burke, W.J., Gentile, L.C., Huang, C.Y., Valladares, C.E. and Su, S.Y. (2004) Longitudinal Variability of Equatorial Plasma Bubbles Observed by DMSP and ROCSAT-1. Journal of Geophysical Research, 109, A12301.
http://dx.doi.org/10.1029/2004JA010583