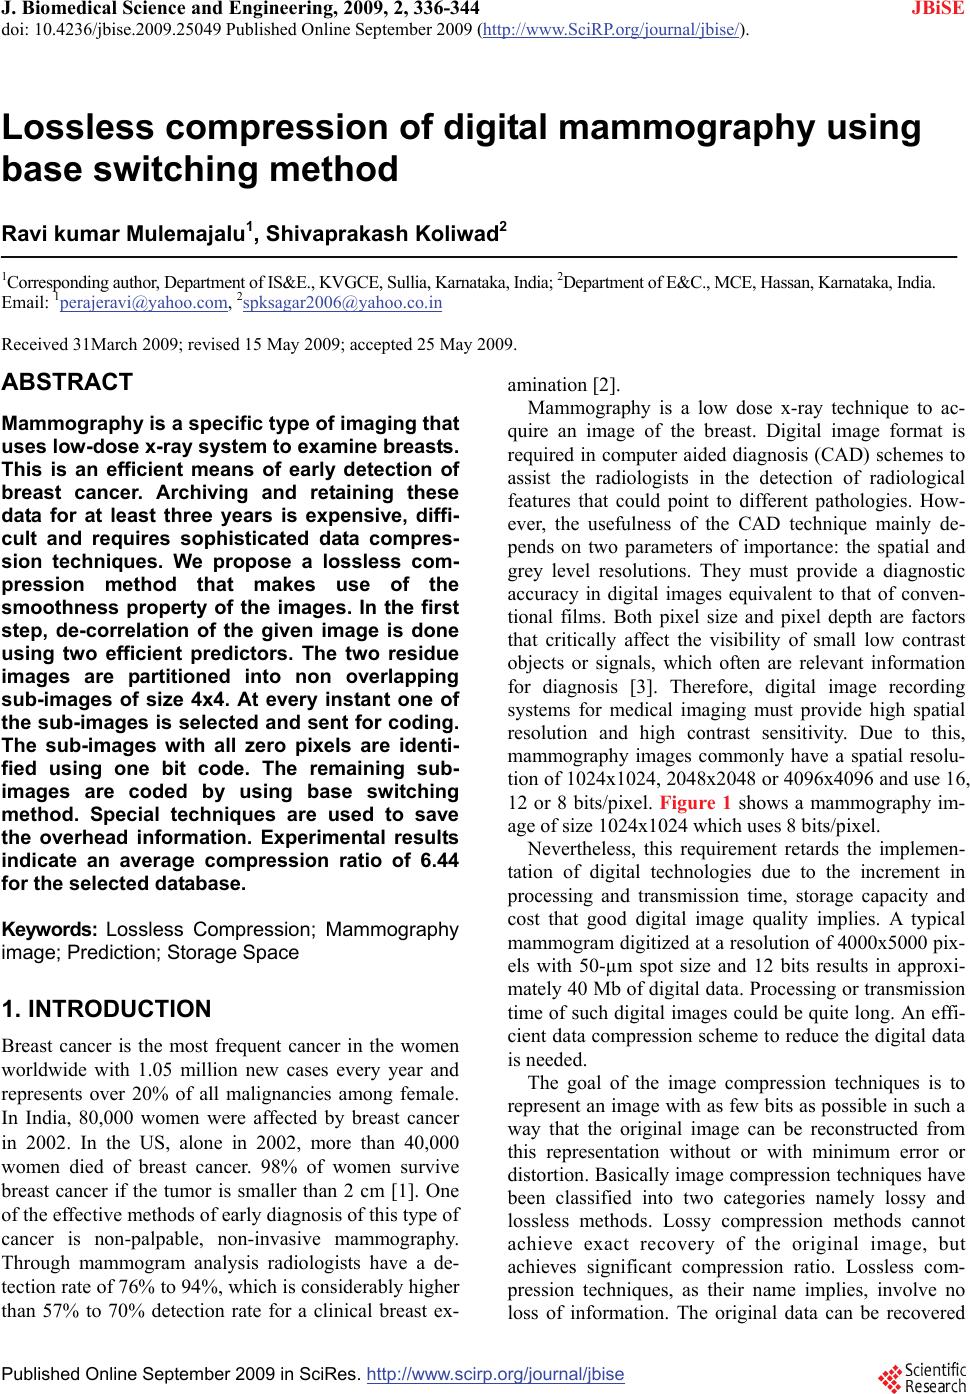
 J. Biomedical Science and Engineering, 2009, 2, 336-344 doi: 10.4236/jbise.2009.25049 Published Online September 2009 (http://www.SciRP.org/journal/jbise/ JBiSE ). Published Online September 2009 in SciRes.http://www.scirp.org/journal/jbise Lossless compression of digital mammography using base switching method Ravi kumar Mulemajalu1, Shivaprakash Koliwad2 1Corresponding author, Department of IS&E., KVGCE, Sullia, Karnataka, India; 2Department of E&C., MCE, Hassan, Karnataka, India. Email: 1perajeravi@yahoo.com, 2spksagar2006@yahoo.co.in Received 31March 2009; revised 15 May 2009; accepted 25 May 2009. ABSTRACT Mammography is a specific type of imaging that uses low-dose x-ray system to examine breasts. This is an efficient means of early detection of breast cancer. Archiving and retaining these data for at least three years is expensive, diffi- cult and requires sophisticated data compres- sion techniques. We propose a lossless com- pression method that makes use of the smoothness property of the images. In the first step, de-correlation of the given image is done using two efficient predictors. The two residue images are partitioned into non overlapping sub-images of size 4x4. At every instant one of the sub-images is selected and sent for coding. The sub-images with all zero pixels are identi- fied using one bit code. The remaining sub- images are coded by using base switching method. Special techniques are used to save the overhead information. Experimental results indicate an average compression ratio of 6.44 for the selected database. Keywords: Lossless Compression; Mammography image; Prediction; Storage Space 1. INTRODUCTION Breast cancer is the most frequent cancer in the women worldwide with 1.05 million new cases every year and represents over 20% of all malignancies among female. In India, 80,000 women were affected by breast cancer in 2002. In the US, alone in 2002, more than 40,000 women died of breast cancer. 98% of women survive breast cancer if the tumor is smaller than 2 cm [1]. One of the effective methods of early diagnosis of this type of cancer is non-palpable, non-invasive mammography. Through mammogram analysis radiologists have a de- tection rate of 76% to 94%, which is considerably higher than 57% to 70% detection rate for a clinical breast ex- amination [2]. Mammography is a low dose x-ray technique to ac- quire an image of the breast. Digital image format is required in computer aided diagnosis (CAD) schemes to assist the radiologists in the detection of radiological features that could point to different pathologies. How- ever, the usefulness of the CAD technique mainly de- pends on two parameters of importance: the spatial and grey level resolutions. They must provide a diagnostic accuracy in digital images equivalent to that of conven- tional films. Both pixel size and pixel depth are factors that critically affect the visibility of small low contrast objects or signals, which often are relevant information for diagnosis [3]. Therefore, digital image recording systems for medical imaging must provide high spatial resolution and high contrast sensitivity. Due to this, mammography images commonly have a spatial resolu- tion of 1024x1024, 2048x2048 or 4096x4096 and use 16, 12 or 8 bits/pixel. Figure 1 shows a mammography im- age of size 1024x1024 which uses 8 bits/pixel. Nevertheless, this requirement retards the implemen- tation of digital technologies due to the increment in processing and transmission time, storage capacity and cost that good digital image quality implies. A typical mammogram digitized at a resolution of 4000x5000 pix- els with 50-µm spot size and 12 bits results in approxi- mately 40 Mb of digital data. Processing or transmission time of such digital images could be quite long. An effi- cient data compression scheme to reduce the digital data is needed. The goal of the image compression techniques is to represent an image with as few bits as possible in such a way that the original image can be reconstructed from this representation without or with minimum error or distortion. Basically image compression techniques have been classified into two categories namely lossy and lossless methods. Lossy compression methods cannot achieve exact recovery of the original image, but achieves significant compression ratio. Lossless com- pression techniques, as their name implies, involve no loss of information. The original data can be recovered 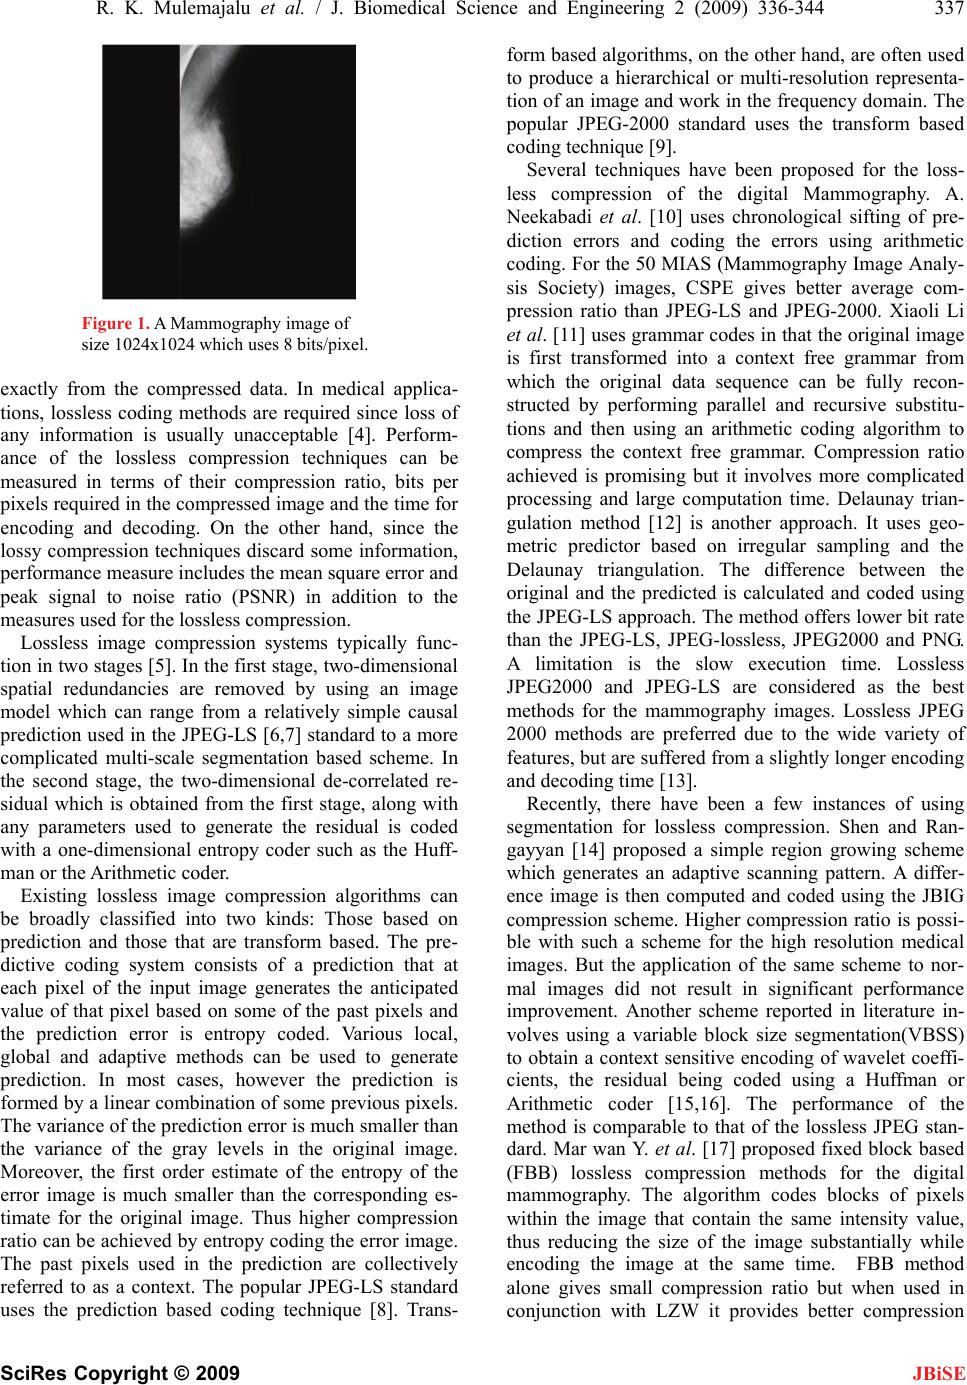 R. K. Mulemajalu et al. / J. Biomedical Science and Engineering 2 (2009) 336-344 337 SciRes Copyright © 2009 JBiSE Figure 1. A Mammography image of size 1024x1024 which uses 8 bits/pixel. exactly from the compressed data. In medical applica- tions, lossless coding methods are required since loss of any information is usually unacceptable [4]. Perform- ance of the lossless compression techniques can be measured in terms of their compression ratio, bits per pixels required in the compressed image and the time for encoding and decoding. On the other hand, since the lossy compression techniques discard some information, performance measure includes the mean square error and peak signal to noise ratio (PSNR) in addition to the measures used for the lossless compression. Lossless image compression systems typically func- tion in two stages [5]. In the first stage, two-dimensional spatial redundancies are removed by using an image model which can range from a relatively simple causal prediction used in the JPEG-LS [6,7] standard to a more complicated multi-scale segmentation based scheme. In the second stage, the two-dimensional de-correlated re- sidual which is obtained from the first stage, along with any parameters used to generate the residual is coded with a one-dimensional entropy coder such as the Huff- man or the Arithmetic coder. Existing lossless image compression algorithms can be broadly classified into two kinds: Those based on prediction and those that are transform based. The pre- dictive coding system consists of a prediction that at each pixel of the input image generates the anticipated value of that pixel based on some of the past pixels and the prediction error is entropy coded. Various local, global and adaptive methods can be used to generate prediction. In most cases, however the prediction is formed by a linear combination of some previous pixels. The variance of the prediction error is much smaller than the variance of the gray levels in the original image. Moreover, the first order estimate of the entropy of the error image is much smaller than the corresponding es- timate for the original image. Thus higher compression ratio can be achieved by entropy coding the error image. The past pixels used in the prediction are collectively referred to as a context. The popular JPEG-LS standard uses the prediction based coding technique [8]. Trans- form based algorithms, on the other hand, are often used to produce a hierarchical or multi-resolution representa- tion of an image and work in the frequency domain. The popular JPEG-2000 standard uses the transform based coding technique [9]. Several techniques have been proposed for the loss- less compression of the digital Mammography. A. Neekabadi et al. [10] uses chronological sifting of pre- diction errors and coding the errors using arithmetic coding. For the 50 MIAS (Mammography Image Analy- sis Society) images, CSPE gives better average com- pression ratio than JPEG-LS and JPEG-2000. Xiaoli Li et al. [11] uses grammar codes in that the original image is first transformed into a context free grammar from which the original data sequence can be fully recon- structed by performing parallel and recursive substitu- tions and then using an arithmetic coding algorithm to compress the context free grammar. Compression ratio achieved is promising but it involves more complicated processing and large computation time. Delaunay trian- gulation method [12] is another approach. It uses geo- metric predictor based on irregular sampling and the Delaunay triangulation. The difference between the original and the predicted is calculated and coded using the JPEG-LS approach. The method offers lower bit rate than the JPEG-LS, JPEG-lossless, JPEG2000 and PNG. A limitation is the slow execution time. Lossless JPEG2000 and JPEG-LS are considered as the best methods for the mammography images. Lossless JPEG 2000 methods are preferred due to the wide variety of features, but are suffered from a slightly longer encoding and decoding time [13]. Recently, there have been a few instances of using segmentation for lossless compression. Shen and Ran- gayyan [14] proposed a simple region growing scheme which generates an adaptive scanning pattern. A differ- ence image is then computed and coded using the JBIG compression scheme. Higher compression ratio is possi- ble with such a scheme for the high resolution medical images. But the application of the same scheme to nor- mal images did not result in significant performance improvement. Another scheme reported in literature in- volves using a variable block size segmentation(VBSS) to obtain a context sensitive encoding of wavelet coeffi- cients, the residual being coded using a Huffman or Arithmetic coder [15,16]. The performance of the method is comparable to that of the lossless JPEG stan- dard. Mar wan Y. et al. [17] proposed fixed block based (FBB) lossless compression methods for the digital mammography. The algorithm codes blocks of pixels within the image that contain the same intensity value, thus reducing the size of the image substantially while encoding the image at the same time. FBB method alone gives small compression ratio but when used in conjunction with LZW it provides better compression 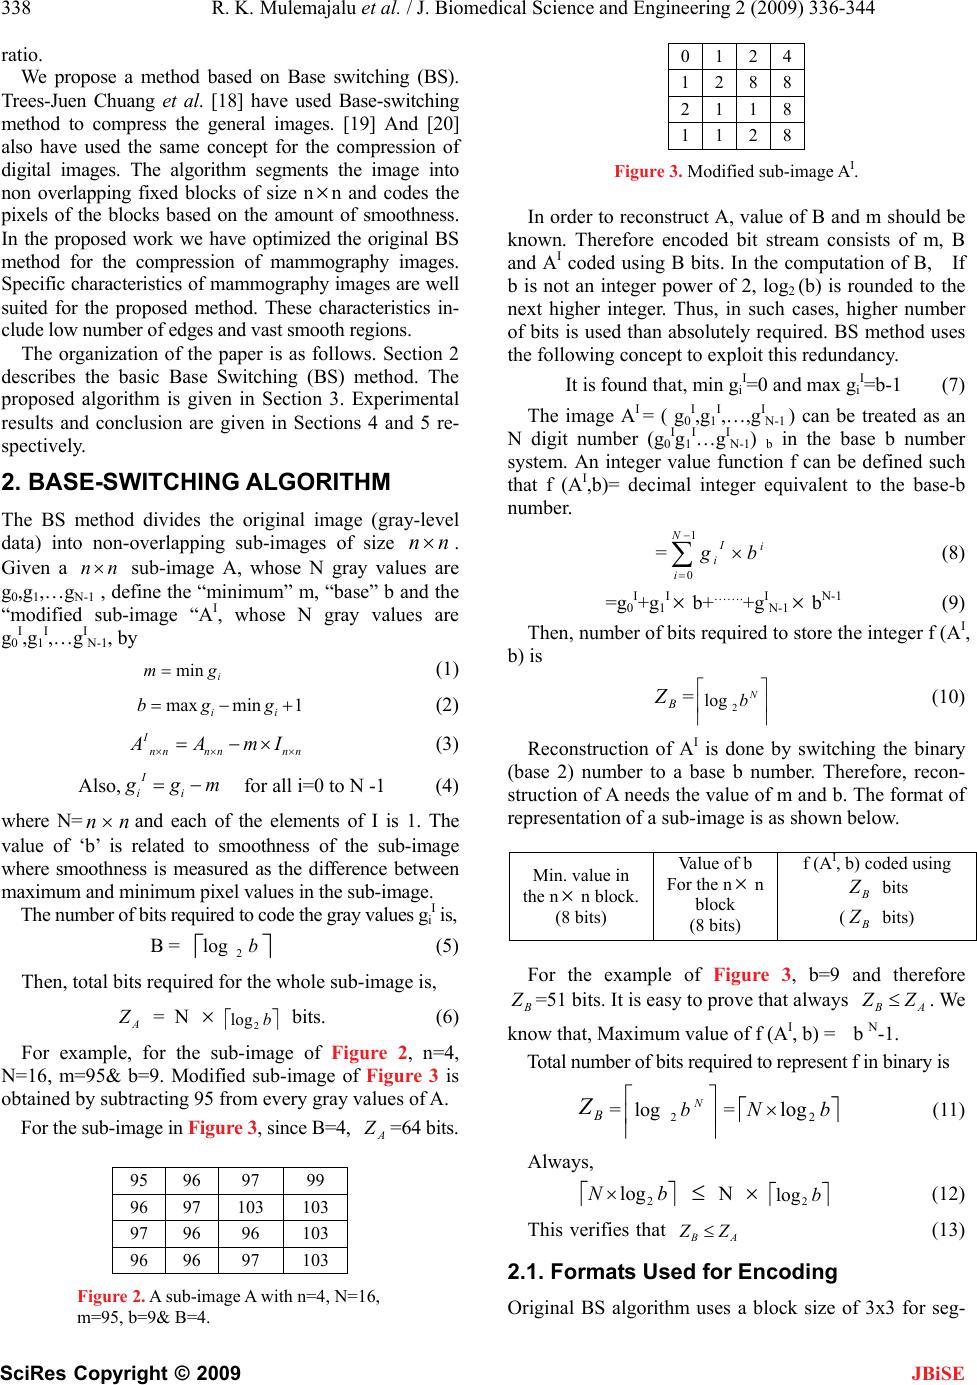 338 R. K. Mu lemajalu et al. / J. Biomedical Science and Engineering 2 (2009) 336-344 SciRes Copyright © 2009 JBiSE ratio. We propose a method based on Base switching (BS). Trees-Juen Chuang et al. [18] have used Base-switching method to compress the general images. [19] And [20] also have used the same concept for the compression of digital images. The algorithm segments the image into non overlapping fixed blocks of size nn and codes the pixels of the blocks based on the amount of smoothness. In the proposed work we have optimized the original BS method for the compression of mammography images. Specific characteristics of mammography images are well suited for the proposed method. These characteristics in- clude low number of edges and vast smooth regions. The organization of the paper is as follows. Section 2 describes the basic Base Switching (BS) method. The proposed algorithm is given in Section 3. Experimental results and conclusion are given in Sections 4 and 5 re- spectively. 2. BASE-SWITCHING ALGORITHM The BS method divides the original image (gray-level data) into non-overlapping sub-images of size nn . Given a sub-image A, whose N gray values are g0,g1,…gN-1 , define the “minimum” m, “base” b and the “modified sub-image “AI, whose N gray values are g0 I,g1 I,…gI N-1, by nn i gm min (1) 1minmax ii ggb (2) I nn nnnn AmI (3) Also, for all i=0 to N -1 (4) mgg i I i where N=and each of the elements of I is 1. The value of ‘b’ is related to smoothness of the sub-image where smoothness is measured as the difference between maximum and minimum pixel values in the sub-image. nn The number of bits required to code the gray values gi I is, B = (5) b 2 log Then, total bits required for the whole sub-image is, A Z = N bits. (6) b 2 log For example, for the sub-image of Figure 2, n=4, N=16, m=95& b=9. Modified sub-image of Figure 3 is obtained by subtracting 95 from every gray values of A. For the sub-image in Figure 3, since B=4, =64 bits. A Z 95 96 97 99 96 97 103 103 97 96 96 103 96 96 97 103 Figure 2. A sub-image A with n=4, N=16, m=95, b=9& B=4. 012 4 128 8 211 8 112 8 Figure 3. Modified sub-image AI. In order to reconstruct A, value of B and m should be known. Therefore encoded bit stream consists of m, B and AI coded using B bits. In the computation of B, If b is not an integer power of 2, log2 (b) is rounded to the next higher integer. Thus, in such cases, higher number of bits is used than absolutely required. BS method uses the following concept to exploit this redundancy. It is found that, min gi I=0 and max gi I=b-1 (7) The image AI = ( g0 I,g1 I,…,gI N-1 ) can be treated as an N digit number (g0 Ig1 I…gI N-1) b in the base b number system. An integer value function f can be defined such that f (AI,b)= decimal integer equivalent to the base-b number. = (8) 1 0 N i i I ibg =g0 I+g1 I b+…….+gI N-1 bN-1 (9) Then, number of bits required to store the integer f (AI, b) is B Z= (10) N b 2 log Reconstruction of AI is done by switching the binary (base 2) number to a base b number. Therefore, recon- struction of A needs the value of m and b. The format of representation of a sub-image is as shown below. Min. value in the n n block. (8 bits) Value of b For the nn block (8 bits) f (AI, b) coded using B Z bits ( bits) B Z For the example of Figure 3, b=9 and therefore =51 bits. It is easy to prove that always B Z B ZA Z . W e know that, Maximum value of f (AI, b) =b N1. - Total number of bits required to represent f in binary is B Z== (11) N b 2 log bN 2 log Always, bN 2 log N (12) b 2 log This verifies that AB ZZ (13) 2.1. Formats Used for Encoding Original BS algorithm uses a block size of 3x3 for seg-  R. K. Mulemajalu et al. / J. Biomedical Science and Engineering 2 (2009) 336-344 339 SciRes Copyright © 2009 JBiSE mentation. There are three formats used by the original algorithm for encoding the sub-images. Format1: If b{1,2 …,11}, then the coding format is c 1 bit b 7 bits m 8 bits Binary equivalent of f (AI, b) ZB bits This format is economical when b<2 3.4 Format2: If b (12, 13,…., 128}, then the coding format is c (1 bit) b (7 bits) m(8 bits) P(min, max) (7 bits) Binary equivalent of min max (0 ,) I i b gfor i ii ii 8, (bits) 7 2 log b Here P(min,max) is a pair of two 3 bit numbers in- dicating the position of minimum and maximum values. If b>11, writing the positions of minimum and maximum values is economical than coding them. Format 3: If b (129, 130,…., 256}, then the coding format is c (1 bit) The original nine gray values: g0,g1,…g8 (72 bits) Here, c stands for the category bit. If c is 0, then the block is encoded using Formats 1 or 2; otherwise Format 3 is used. 2.2. Hierarchical Use of BS Technique The encoded result of Subsection 2.1 can be compressed further in a hierarchical manner. We can imagine that there is a so-called “base-image”, whose gray values are b0, b1, b2, …, b255; then, since it is a kind of image (except that each value is a base value of a sub-image rather than a gray value of a pixel), we can use the same BS technique to compress these base values. The details are omitted. Besides b, the minimal value m of each block can also be grouped and compressed similarly. We can repeat the same procedure to encode b and m values further. 3. PROPOSED METHOD In the proposed method, we made following modifica- tions to the basic BS method. 1) Prediction 2) Increasing the block size from 3x3 to 4x4 3) All-zero block removal 4) Coding the minimum value and base value 3.1. Prediction After reviewing the BS method, it is found that number of bits required for a sub-image is decided by the value of base ‘b’. If ‘b’ is reduced, the number of bits required for a sub-image is also reduced. In the proposed method, prediction is used to reduce the value of ‘b’ significantly. A predictor generates at each pixel of the input image the anticipated value of that pixel based on some of the past inputs. The output of the predictor is then rounded to the nearest integer, denoted ^ n and used to form the dif- ference or prediction error ^ nnn xxe (14) This prediction error is coded by the proposed entropy coder. The decoder reconstructs from received code words and perform the reverse operation n e ^ nnn xex (15) The quality of the prediction for each pixel directly affects how efficiently the prediction error can be en- coded. The better this prediction is less is the informa- tion that must be carried by the prediction error signal. This, in turn, leads to fewer bits. One way to improve the prediction used for each pixel is to make a number of predictions then chose the one which comes closest to the actual value [21]. This method also called as switched prediction has the major disadvantage that the choice of prediction for each pixel must be sent as over- head information. The proposed prediction scheme uses two predictors and one of them is chosen for every block of pixels of size 4x4. Thus, the choice of prediction is to be made only once for the entire 4x4 block. This reduces the amount of overhead. The two predictions are given in Eq.16 and 17, in that, Pr1 is the popular MED pre- dictor used in JPEG-LS standard and Pr2 is the one used by [5] for the compression of mammography images. For the entire pixels of a block of size 44, one of the two predictions is chosen depending on the smoothness property of the predicted blocks. Here, smoothness is measured as the difference between maximum and minimum pixel values in the block. The predictor that gives the lowest difference value will be selected for that block. The advantage here is that the overhead re- quired for each block is only one bit. otherwise. C-BA B). (A,min C if B) (A,max Pr B). (A,max C if B) (A,min 1 (16) )1.02.02.01.03.01.0(Pr2 FEDCBA (17) Here, A, B, C, D, E and F are the neighbors of pixel in- volved in prediction as depicted in Figure 4. The proposed switched prediction is described in the equation form in 18 where d1 and d2 are the differ- 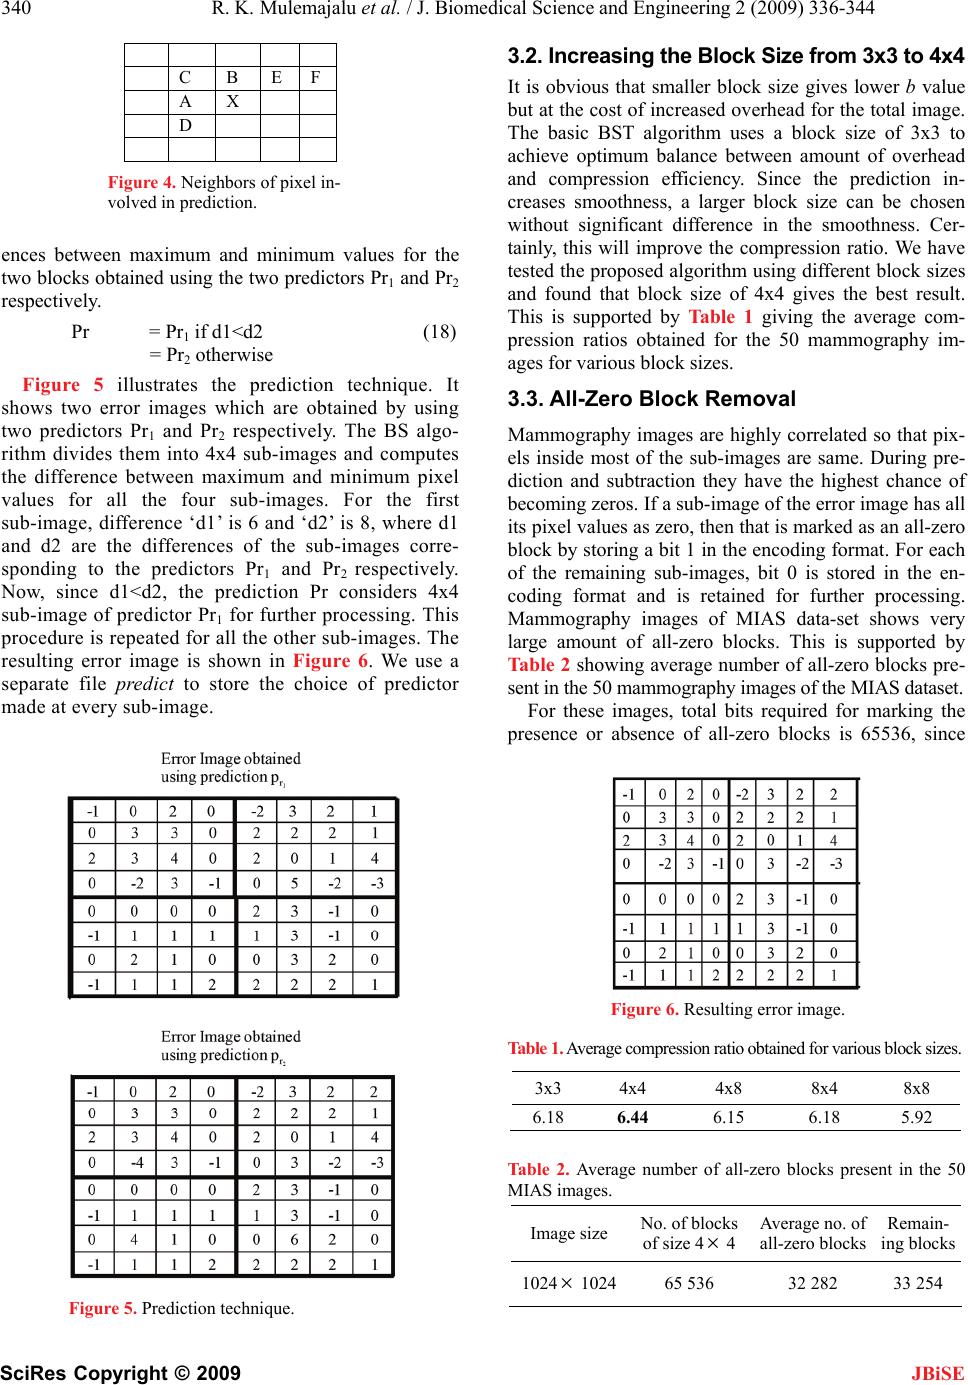 340 R. K. Mulemajalu et al. / J. Biomedical Science and Engineering 2 (2009) 336-344 SciRes Copyright © 2009 JBiSE C B E F A X D Figure 4. Neighbors of pixel in- volved in prediction. ences between maximum and minimum values for the two blocks obtained using the two predictors Pr1 and Pr2 respectively. Pr = Pr 1 if d1<d2 (18) = Pr2 otherwise Figure 5 illustrates the prediction technique. It shows two error images which are obtained by using two predictors Pr1 and Pr2 respectively. The BS algo- rithm divides them into 4x4 sub-images and computes the difference between maximum and minimum pixel values for all the four sub-images. For the first sub-image, difference ‘d1’ is 6 and ‘d2’ is 8, where d1 and d2 are the differences of the sub-images corre- sponding to the predictors Pr1 and Pr2 respectively. Now, since d1<d2, the prediction Pr considers 4x4 sub-image of predictor Pr1 for further processing. This procedure is repeated for all the other sub-images. The resulting error image is shown in Figure 6. We use a separate file predict to store the choice of predictor made at every sub-image. Figure 5. Prediction technique. 3.2. Increasing the Block Size from 3x3 to 4x4 It is obvious that smaller block size gives lower b value but at the cost of increased overhead for the total image. The basic BST algorithm uses a block size of 3x3 to achieve optimum balance between amount of overhead and compression efficiency. Since the prediction in- creases smoothness, a larger block size can be chosen without significant difference in the smoothness. Cer- tainly, this will improve the compression ratio. We have tested the proposed algorithm using different block sizes and found that block size of 4x4 gives the best result. This is supported by Table 1 giving the average com- pression ratios obtained for the 50 mammography im- ages for various block sizes. 3.3. All-Zero Block Removal Mammography images are highly correlated so that pix- els inside most of the sub-images are same. During pre- diction and subtraction they have the highest chance of becoming zeros. If a sub-image of the error image has all its pixel values as zero, then that is marked as an all-zero block by storing a bit 1 in the encoding format. For each of the remaining sub-images, bit 0 is stored in the en- coding format and is retained for further processing. Mammography images of MIAS data-set shows very large amount of all-zero blocks. This is supported by Table 2 showing average number of all-zero blocks pre- sent in the 50 mammography images of the MIAS dataset. For these images, total bits required for marking the presence or absence of all-zero blocks is 65536, since Figure 6. Resulting error image. Table 1. Average compression ratio obtained for various block sizes. Table 2. Average number of all-zero blocks present in the 50 MIAS images. 3x3 4x4 4x8 8x4 8x8 6.18 6.44 6.15 6.18 5.92 Image size No. of blocks of size 4 4 Average no. of all-zero blocks Remain- ing blocks 1024 102465 536 32 282 33 254 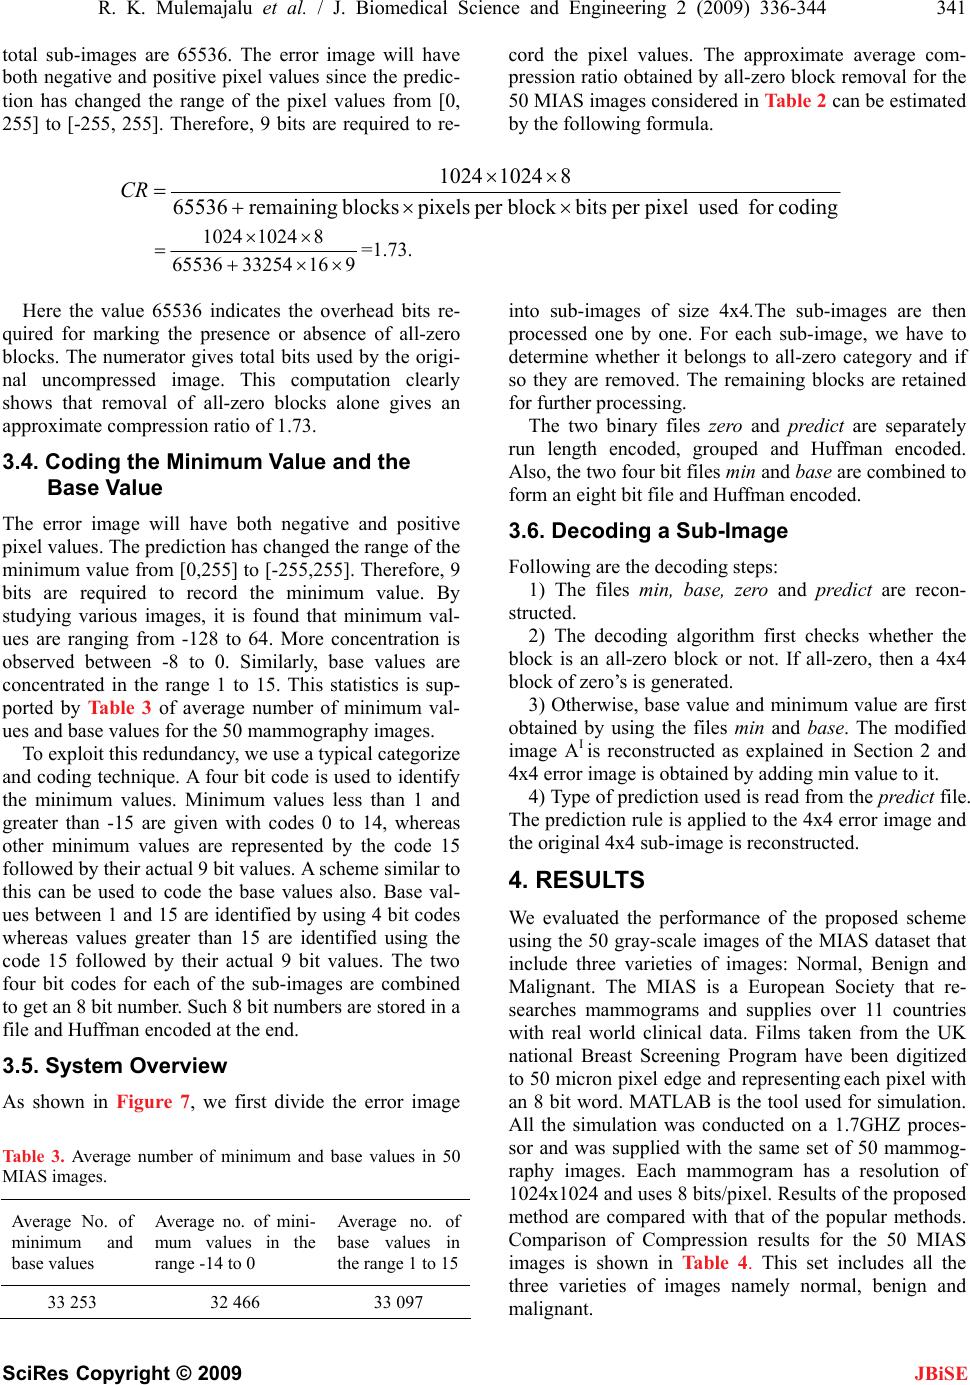 R. K. Mulemajalu et al. / J. Biomedical Science and Engineering 2 (2009) 336-344 341 SciRes Copyright © 2009 total sub-images are 65536. The error image will have both negative and positive pixel values since the predic- tion has changed the range of the pixel values from [0, 255] to [-255, 255]. Therefore, 9 bits are required to re- cord the pixel values. The approximate average com- pression ratio obtained by all-zero block removal for the 50 MIAS images considered in Table 2 can be estimated by the following formula. codingfor used pixelper bits block per pixels blocks remaining 65536 8 1024 1024 CR 9 16 33254 65536 8 10241024 =1.73. into sub-images of size 4x4.The sub-images are then processed one by one. For each sub-image, we have to determine whether it belongs to all-zero category and if so they are removed. The remaining blocks are retained for further processing. Here the value 65536 indicates the overhead bits re- quired for marking the presence or absence of all-zero blocks. The numerator gives total bits used by the origi- nal uncompressed image. This computation clearly shows that removal of all-zero blocks alone gives an approximate compression ratio of 1.73. The two binary files zero and predict are separately run length encoded, grouped and Huffman encoded. Also, the two four bit files min and base are combined to form an eight bit file and Huffman encoded. 3.4. Coding the Minimum Value and the Base Value The error image will have both negative and positive pixel values. The prediction has changed the range of the minimum value from [0,255] to [-255,255]. Therefore, 9 bits are required to record the minimum value. By studying various images, it is found that minimum val- ues are ranging from -128 to 64. More concentration is observed between -8 to 0. Similarly, base values are concentrated in the range 1 to 15. This statistics is sup- ported by Table 3 of average number of minimum val- ues and base values for the 50 mammography images. 3.6. Decoding a Sub-Image Following are the decoding steps: 1) The files min, base, zero and predict are recon- structed. 2) The decoding algorithm first checks whether the block is an all-zero block or not. If all-zero, then a 4x4 block of zero’s is generated. 3) Otherwise, base value and minimum value are first obtained by using the files min and base. The modified image AI is reconstructed as explained in Section 2 and 4x4 error image is obtained by adding min value to it. To exploit this redundancy, we use a typical categorize and coding technique. A four bit code is used to identify the minimum values. Minimum values less than 1 and greater than -15 are given with codes 0 to 14, whereas other minimum values are represented by the code 15 followed by their actual 9 bit values. A scheme similar to this can be used to code the base values also. Base val- ues between 1 and 15 are identified by using 4 bit codes whereas values greater than 15 are identified using the code 15 followed by their actual 9 bit values. The two four bit codes for each of the sub-images are combined to get an 8 bit number. Such 8 bit numbers are stored in a file and Huffman encoded at the end. 4) Type of prediction used is read from the predict file. The prediction rule is applied to the 4x4 error image and the original 4x4 sub-image is reconstructed. 4. RESULTS We evaluated the performance of the proposed scheme using the 50 gray-scale images of the MIAS dataset that include three varieties of images: Normal, Benign and Malignant. The MIAS is a European Society that re- searches mammograms and supplies over 11 countries with real world clinical data. Films taken from the UK national Breast Screening Program have been digitized to 50 micron pixel edge and representing each pixel with an 8 bit word. MATLAB is the tool used for simulation. All the simulation was conducted on a 1.7GHZ proces- sor and was supplied with the same set of 50 mammog- raphy images. Each mammogram has a resolution of 1024x1024 and uses 8 bits/pixel. Results of the proposed method are compared with that of the popular methods. Comparison of Compression results for the 50 MIAS images is shown in Table 4. This set includes all the three varieties of images namely normal, benign and malignant. 3.5. System Overview As shown in Figure 7, we first divide the error image Table 3. Average number of minimum and base values in 50 MIAS images. Average No. of minimum and base values Average no. of mini- mum values in the range -14 to 0 Average no. of base values in the range 1 to 15 33 253 32 466 33 097 JBiSE 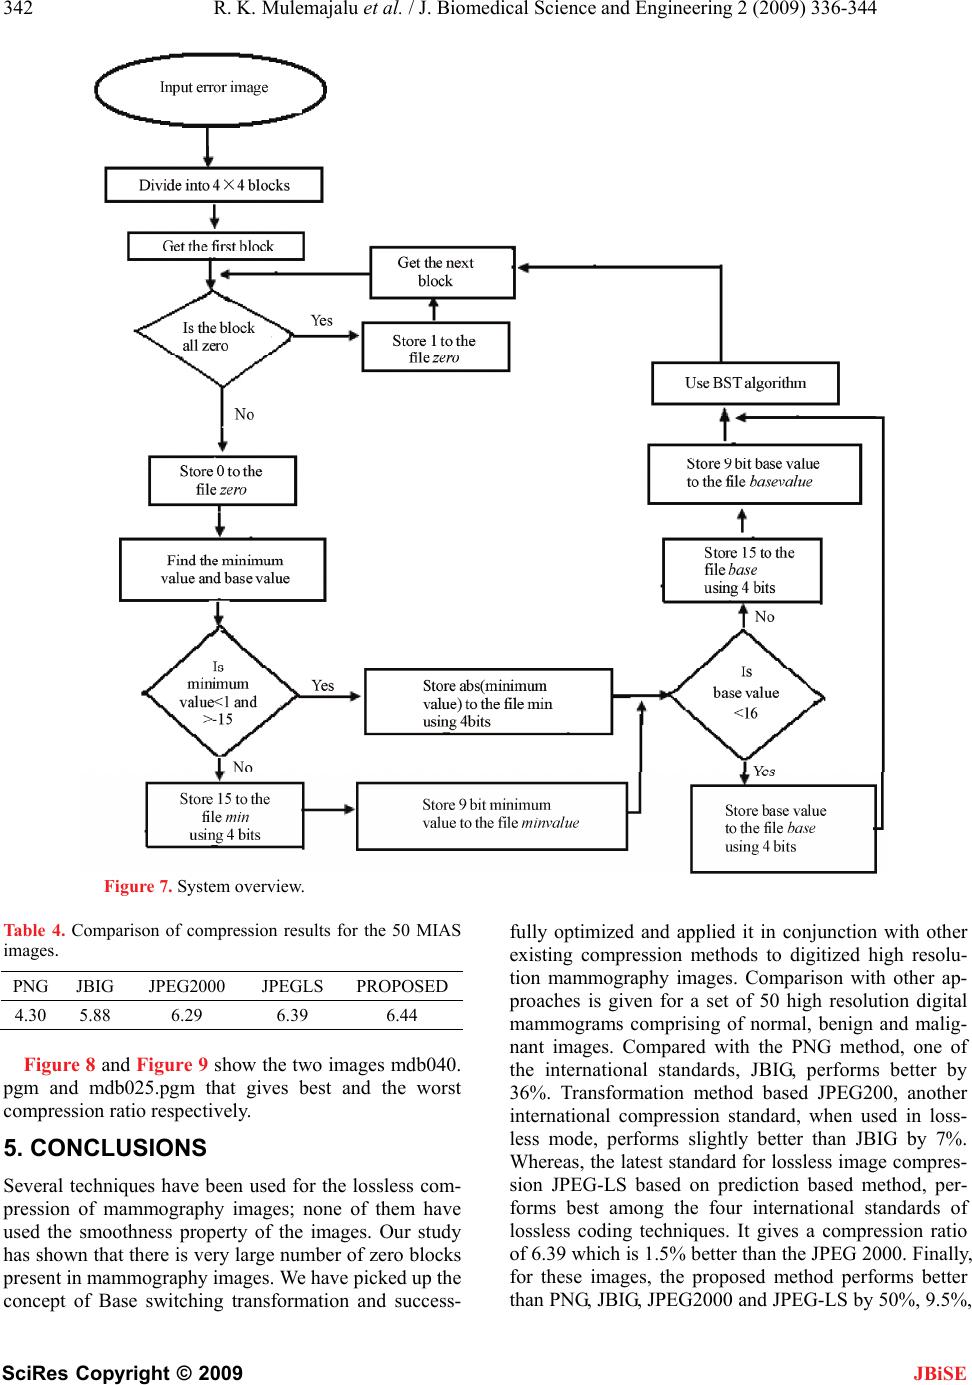 342 R. K. Mulemajalu et al. / J. Biomedical Science and Engineering 2 (2009) 336-344 SciRes Copyright © 2009 JBiSE Figure 7. System overview. Table 4. Comparison of compression results for the 50 MIAS images. PNG JBIG JPEG2000 JPEGLS PROPOSED 4.30 5.88 6.29 6.39 6.44 Figure 8 and Figure 9 show the two images mdb040. pgm and mdb025.pgm that gives best and the worst compression ratio respectively. 5. CONCLUSIONS Several techniques have been used for the lossless com- pression of mammography images; none of them have used the smoothness property of the images. Our study has shown that there is very large number of zero blocks present in mammography images. We have picked up the concept of Base switching transformation and success- fully optimized and applied it in conjunction with other existing compression methods to digitized high resolu- tion mammography images. Comparison with other ap- proaches is given for a set of 50 high resolution digital mammograms comprising of normal, benign and malig- nant images. Compared with the PNG method, one of the international standards, JBIG, performs better by 36%. Transformation method based JPEG200, another international compression standard, when used in loss- less mode, performs slightly better than JBIG by 7%. Whereas, the latest standard for lossless image compres- sion JPEG-LS based on prediction based method, per- forms best among the four international standards of lossless coding techniques. It gives a compression ratio of 6.39 which is 1.5% better than the JPEG 2000. Finally, for these images, the proposed method performs better than PNG, JBIG, JPEG2000 and JPEG-LS by 50%, 9.5%, 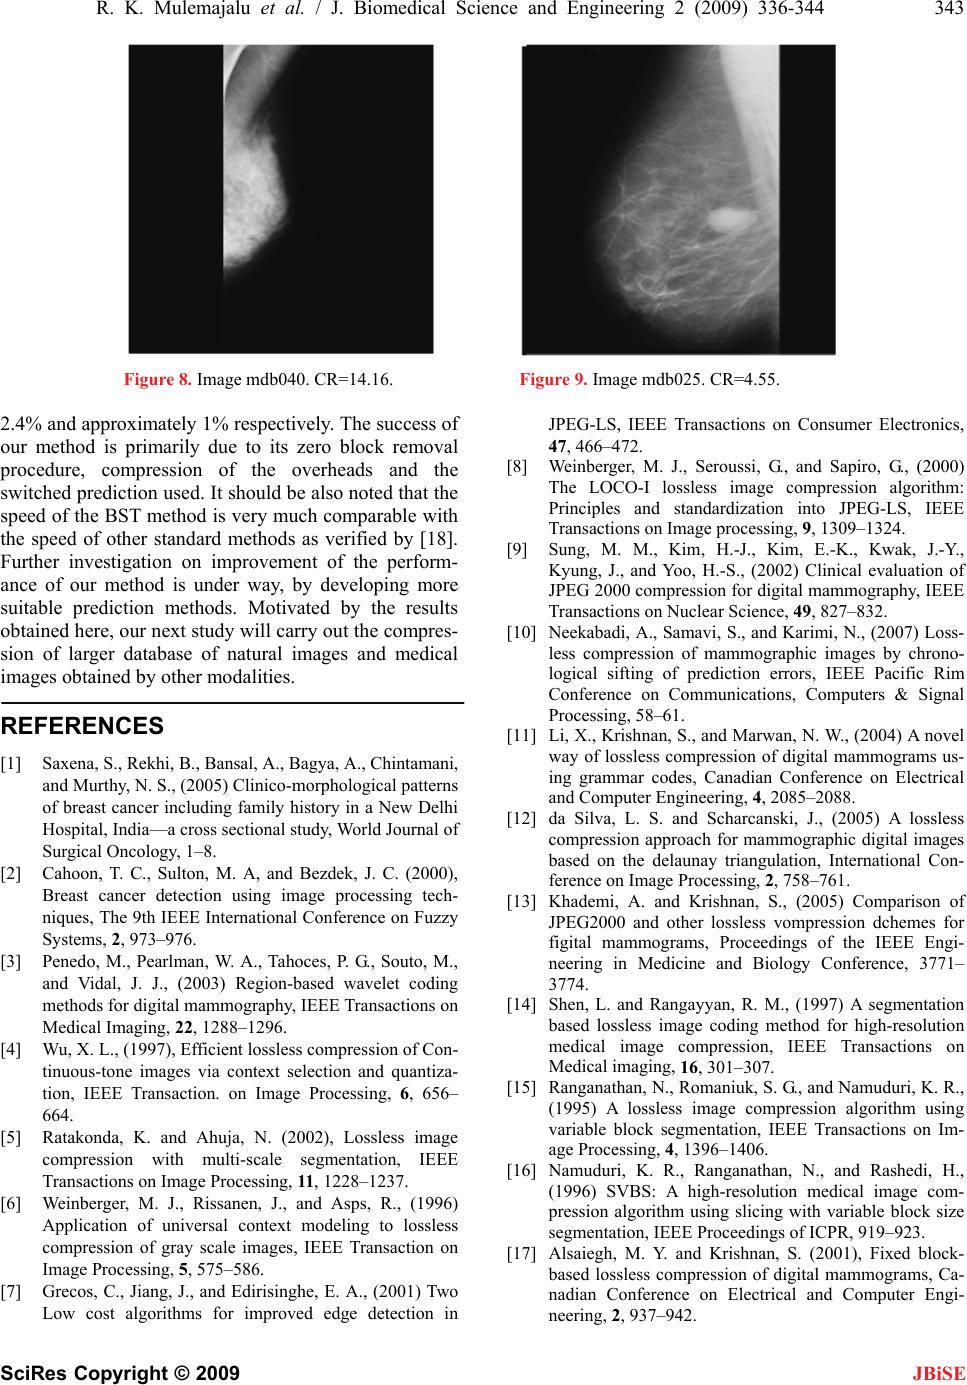 R. K. Mulemajalu et al. / J. Biomedical Science and Engineering 2 (2009) 336-344 343 SciRes Copyright © 2009 JBiSE Figure 8. Image mdb040. CR=14.16. Figure 9. Image mdb025. CR=4.55. 2.4% and approximately 1% respectively. The success of our method is primarily due to its zero block removal procedure, compression of the overheads and the switched prediction used. It should be also noted that the speed of the BST method is very much comparable with the speed of other standard methods as verified by [18]. Further investigation on improvement of the perform- ance of our method is under way, by developing more suitable prediction methods. Motivated by the results obtained here, our next study will carry out the compres- sion of larger database of natural images and medical images obtained by other modalities. REFERENCES [1] Saxena, S., Rekhi, B., Bansal, A., Bagya, A., Chintamani, and Murthy, N. S., (2005) Clinico-morphological patterns of breast cancer including family history in a New Delhi Hospital, India—a cross sectional study, World Journal of Surgical Oncology, 1–8. [2] Cahoon, T. C., Sulton, M. A, and Bezdek, J. C. (2000), Breast cancer detection using image processing tech- niques, The 9th IEEE International Conference on Fuzzy Systems, 2, 973–976. [3] Penedo, M., Pearlman, W. A., Tahoces, P. G., Souto, M., and Vidal, J. J., (2003) Region-based wavelet coding methods for digital mammography, IEEE Transactions on Medical Imaging, 22, 1288–1296. [4] Wu, X. L., (1997), Efficient lossless compression of Con- tinuous-tone images via context selection and quantiza- tion, IEEE Transaction. on Image Processing, 6, 656– 664. [5] Ratakonda, K. and Ahuja, N. (2002), Lossless image compression with multi-scale segmentation, IEEE Transactions on Image Processing, 11, 1228–1237. [6] Weinberger, M. J., Rissanen, J., and Asps, R., (1996) Application of universal context modeling to lossless compression of gray scale images, IEEE Transaction on Image Processing, 5, 575–586. [7] Grecos, C., Jiang, J., and Edirisinghe, E. A., (2001) Two Low cost algorithms for improved edge detection in JPEG-LS, IEEE Transactions on Consumer Electronics, 47, 466–472. [8] Weinberger, M. J., Seroussi, G., and Sapiro, G., (2000) The LOCO-I lossless image compression algorithm: Principles and standardization into JPEG-LS, IEEE Transactions on Image processing, 9, 1309–1324. [9] Sung, M. M., Kim, H.-J., Kim, E.-K., Kwak, J.-Y., Kyung, J., and Yoo, H.-S., (2002) Clinical evaluation of JPEG 2000 compression for digital mammography, IEEE Transactions on Nuclear Science, 49, 827–832. [10] Neekabadi, A., Samavi, S., and Karimi, N., (2007) Loss- less compression of mammographic images by chrono- logical sifting of prediction errors, IEEE Pacific Rim Conference on Communications, Computers & Signal Processing, 58–61. [11] Li, X., Krishnan, S., and Marwan, N. W., (2004) A novel way of lossless compression of digital mammograms us- ing grammar codes, Canadian Conference on Electrical and Computer Engineering, 4, 2085–2088. [12] da Silva, L. S. and Scharcanski, J., (2005) A lossless compression approach for mammographic digital images based on the delaunay triangulation, International Con- ference on Image Processing, 2, 758–761. [13] Khademi, A. and Krishnan, S., (2005) Comparison of JPEG2000 and other lossless vompression dchemes for figital mammograms, Proceedings of the IEEE Engi- neering in Medicine and Biology Conference, 3771– 3774. [14] Shen, L. and Rangayyan, R. M., (1997) A segmentation based lossless image coding method for high-resolution medical image compression, IEEE Transactions on Medical imaging, 16, 301–307. [15] Ranganathan, N., Romaniuk, S. G., and Namuduri, K. R., (1995) A lossless image compression algorithm using variable block segmentation, IEEE Transactions on Im- age Processing, 4, 1396–1406. [16] Namuduri, K. R., Ranganathan, N., and Rashedi, H., (1996) SVBS: A high-resolution medical image com- pression algorithm using slicing with variable block size segmentation, IEEE Proceedings of ICPR, 919–923. [17] Alsaiegh, M. Y. and Krishnan, S. (2001), Fixed block- based lossless compression of digital mammograms, Ca- nadian Conference on Electrical and Computer Engi- neering, 2, 937–942.  344 R. K. Mulemajalu et al. / J. Biomedical Science and Engineering 2 (2009) 336-344 SciRes Copyright © 2009 JBiSE [18] Chuang, T.-J. and Lin, J. C., (1998) A new algorithm for lossless still image compression, Pattern Recognition, 31, 1343–1352. [19] Chang, C.-C., Hsieh, C.-P., and Hsiao, J.-Y., (2003) A new approach to lossless image compression, Proceed- ings of ICCT’03, 1734–38. [20] Ravikumar, M. S., Koliwad, S., and Dwarakish, G. S., (2008) Lossless compression of digital mammography using fixed block segmentation and pixel grouping, Proceedings of IEEE 6th Indian Conference on Com- puter Vision Graphics and Image Processing, 201–206. [21] Sayood, K., (2003) Lossless compression handbook, First edition, Academic Press, USA, 207–223.
|