Paper Menu >>
Journal Menu >>
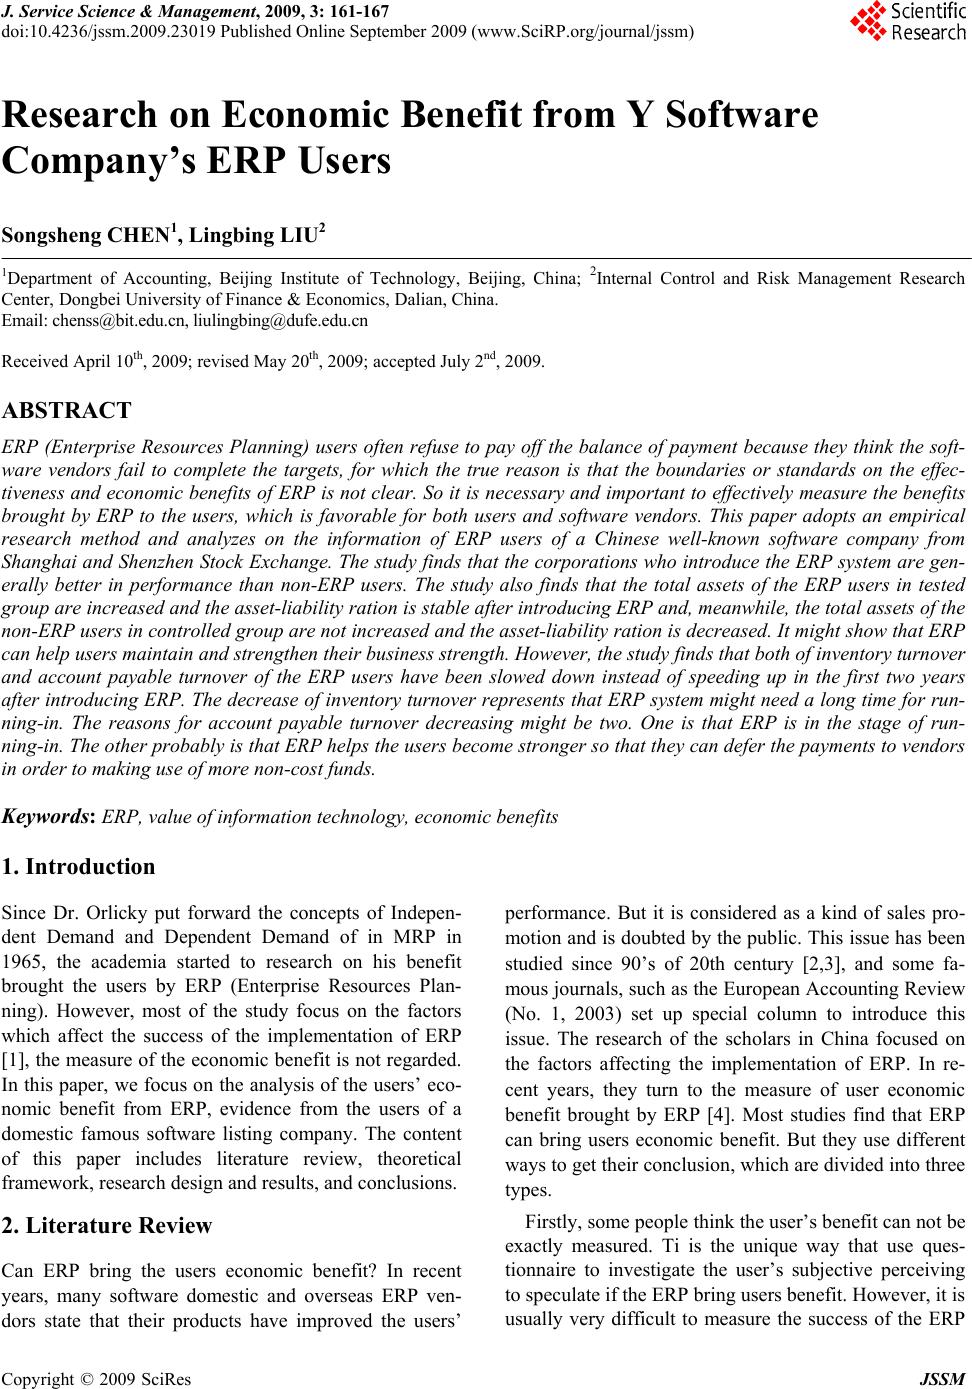 J. Service Scie nce & Management, 2009, 3: 161-167 doi:10.4236/jssm.2009.23019 Published Online September 2009 (www.SciRP.org/journal/jssm) Copyright © 2009 SciRes JSSM 161 Research on Economic Benefit from Y Software Company’s ERP Users Songsheng CHEN1, Lingbing LIU2 1Department of Accounting, Beijing Institute of Technology, Beijing, China; 2Internal Control and Risk Management Research Center, Dongbei University of Finance & Economics, Dalian, China. Email: chenss@bit.edu.cn, liulingbing@dufe.edu.cn Received April 10th, 2009; revised May 20th, 2009; accepted July 2nd, 2009. ABSTRACT ERP (Enterprise Resources Planning) users often refuse to pay off the balance of payment because they think the soft- ware vendors fail to complete the targets, for which the true reason is that the boundaries or standards on the effec- tiveness and economic benefits of ERP is not clear. So it is necessary and important to effectively measure the benefits brought by ERP to the users, which is favorable for both users and software vendors. This paper adopts an empirical research method and analyzes on the information of ERP users of a Chinese well-known software company from Shanghai and Shenzhen Stock Exchange. The study finds that the corporations who introduce the ERP system are gen- erally better in performance than non-ERP users. The study also finds that the total assets of the ERP users in tested group are increased and the asset-liability ration is stable after introducing ERP and, meanwhile, the total assets of the non-ERP users in controlled group are not increased and the asset-liability ration is decreased. It might show that ERP can help users maintain and strengthen their business strength. However, the study finds that both of inventory turnover and account payable turnover of the ERP users have been slowed down instead of speeding up in the first two years after introducing ERP. The decrease of inventory turnover represents that ERP system might need a long time for run- ning-in. The reasons for account payable turnover decreasing might be two. One is that ERP is in the stage of run- ning-in. The other probably is that ERP helps the users become stronger so that they can defer the payments to vendors in order to making use of more non-cost funds. Keywords: ERP, value of information techno logy, economic benefits 1. Introduction Since Dr. Orlicky put forward the concepts of Indepen- dent Demand and Dependent Demand of in MRP in 1965, the academia started to research on his benefit brought the users by ERP (Enterprise Resources Plan- ning). However, most of the study focus on the factors which affect the success of the implementation of ERP [1], the measure of the economic benefit is not regarded. In this paper, we focus on the analysis of the users’ eco- nomic benefit from ERP, evidence from the users of a domestic famous software listing company. The content of this paper includes literature review, theoretical framework, research design and results, and conclusions. 2. Literature Review Can ERP bring the users economic benefit? In recent years, many software domestic and overseas ERP ven- dors state that their products have improved the users’ performance. But it is considered as a kind of sales pro- motion and is doubted by the public. This issue has been studied since 90’s of 20th century [2,3], and some fa- mous journals, such as the European Accounting Review (No. 1, 2003) set up special column to introduce this issue. The research of the scholars in China focused on the factors affecting the implementation of ERP. In re- cent years, they turn to the measure of user economic benefit brought by ERP [4]. Most studies find that ERP can bring users economic benefit. But they use different ways to get their conclusion , which are divided into three types. Firstly, some people think the user’s benefit can not be exactly measured. Ti is the unique way that use ques- tionnaire to investigate the user’s subjective perceiving to speculate if the ERP bring users benefit. However, it is usually very difficult to measure the success of the ERP 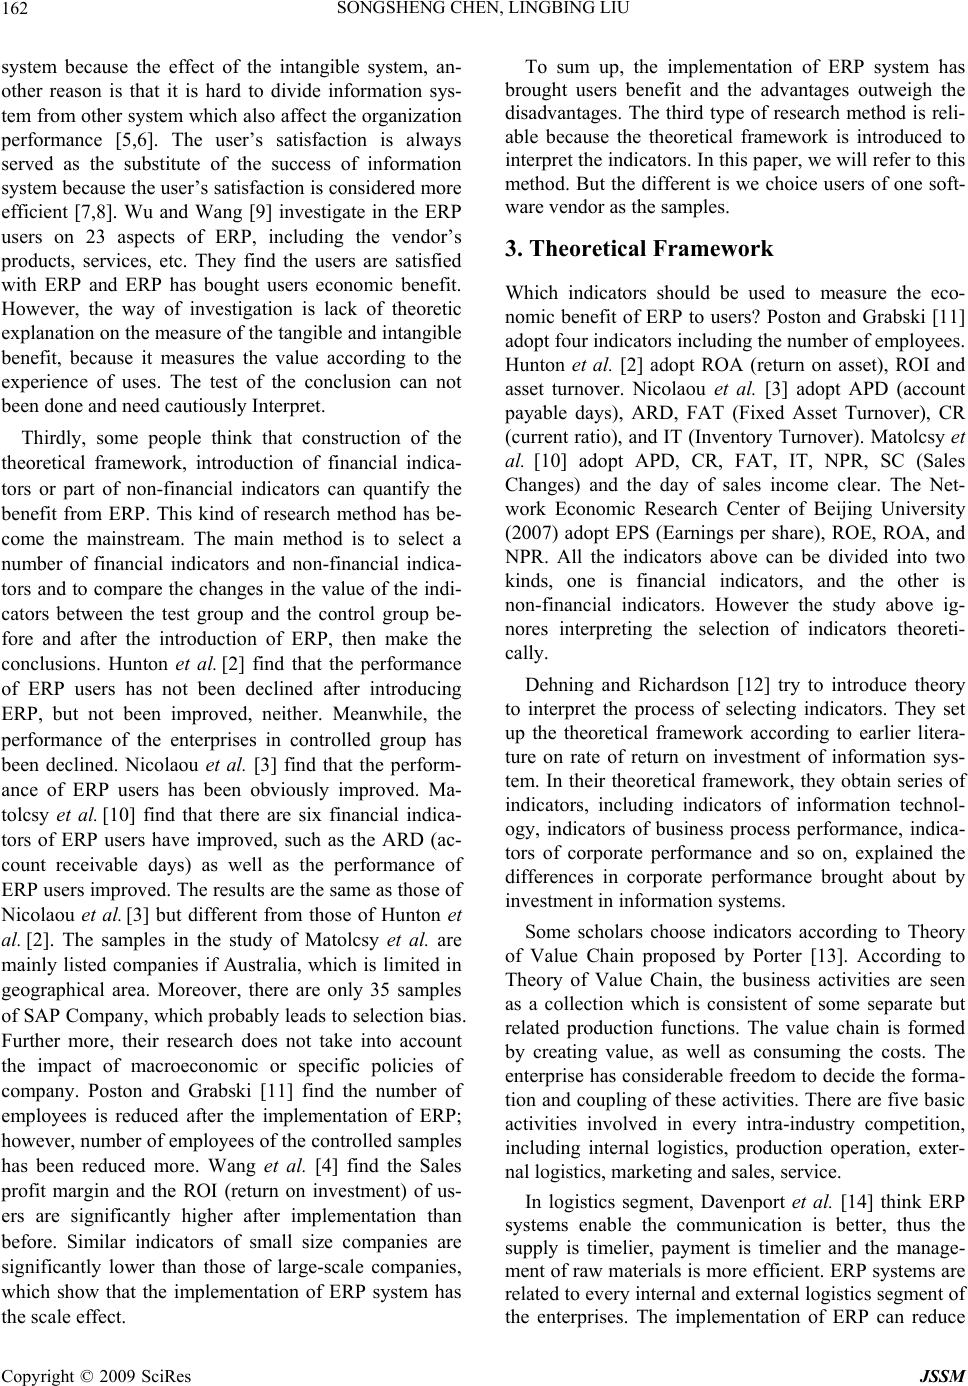 SONGSHENG CHEN, LINGBING LIU 162 system because the effect of the intangible system, an- other reason is that it is hard to divide information sys- tem from other system which also affect the organization performance [5,6]. The user’s satisfaction is always served as the substitute of the success of information system because the user’s satisfaction is considered more efficient [7,8]. Wu and Wang [9] investigate in the ERP users on 23 aspects of ERP, including the vendor’s products, services, etc. They find the users are satisfied with ERP and ERP has bought users economic benefit. However, the way of investigation is lack of theoretic explanation on the measure of the tangible and intangible benefit, because it measures the value according to the experience of uses. The test of the conclusion can not been done and need cautiously Interpret. Thirdly, some people think that construction of the theoretical framework, introduction of financial indica- tors or part of non-financial indicators can quantify the benefit from ERP. This kind of research method has be- come the mainstream. The main method is to select a number of financial indicators and non-financial indica- tors and to compare the changes in the value of the indi- cators between the test group and the control group be- fore and after the introduction of ERP, then make the conclusions. Hunton et al. [2] find that the performance of ERP users has not been declined after introducing ERP, but not been improved, neither. Meanwhile, the performance of the enterprises in controlled group has been declined. Nicolaou et al. [3] find that the perform- ance of ERP users has been obviously improved. Ma- tolcsy et al. [10] find that there are six financial indica- tors of ERP users have improved, such as the ARD (ac- count receivable days) as well as the performance of ERP use rs imp rov ed. The re sults are th e same a s tho se of Nicolaou et al. [3] but different from those of Hunton et al. [2]. The samples in the study of Matolcsy et al. are mainly listed companies if Australia, which is limited in geographical area. Moreover, there are only 35 samples of SAP Company, which probably leads to selection bias. Further more, their research does not take into account the impact of macroeconomic or specific policies of company. Poston and Grabski [11] find the number of employees is reduced after the implementation of ERP; however, number of employees of the controlled samples has been reduced more. Wang et al. [4] find the Sales profit margin and the ROI (return on investment) of us- ers are significantly higher after implementation than before. Similar indicators of small size companies are significantly lower than those of large-scale companies, which show that the implementation of ERP system has the scale effect. To sum up, the implementation of ERP system has brought users benefit and the advantages outweigh the disadvantages. The third type of research method is reli- able because the theoretical framework is introduced to interpret the indicators. In this paper, we will refer to this method. But the different is we choice users of one soft- ware vendor as the samples. 3. Theoretical Framework Which indicators should be used to measure the eco- nomic benefit of ERP to users? Poston and Grabski [11] adopt four indicators including the number of employees. Hunton et al. [2] adopt ROA (return on asset), ROI and asset turnover. Nicolaou et al. [3] adopt APD (account payable days), ARD, FAT (Fixed Asset Turnover), CR (current ratio), and IT (Inventory Turnover). Matolcsy et al. [10] adopt APD, CR, FAT, IT, NPR, SC (Sales Changes) and the day of sales income clear. The Net- work Economic Research Center of Beijing University (2007) adopt EPS (Earnings per share), ROE, ROA, and NPR. All the indicators above can be divided into two kinds, one is financial indicators, and the other is non-financial indicators. However the study above ig- nores interpreting the selection of indicators theoreti- cally. Dehning and Richardson [12] try to introduce theory to interpret the process of selecting indicators. They set up the theoretical framework according to earlier litera- ture on rate of return on investment of information sys- tem. In their theoretical framework, they obtain series of indicators, including indicators of information technol- ogy, indicators of business process performance, indica- tors of corporate performance and so on, explained the differences in corporate performance brought about by investment in information systems. Some scholars choose indicators according to Theory of Value Chain proposed by Porter [13]. According to Theory of Value Chain, the business activities are seen as a collection which is consistent of some separate but related production functions. The value chain is formed by creating value, as well as consuming the costs. The enterprise has considerable freedom to decide the forma- tion and coupling of these activities. Th ere are five basic activities involved in every intra-industry competition, including internal logistics, production operation, exter- nal logistics, marketing and sales, service. In logistics segment, Davenport et al. [14] think ERP systems enable the communication is better, thus the supply is timelier, payment is timelier and the manage- ment of raw materials is more efficient. ERP systems are related to every internal and extern al logistics segment o f the enterprises. The implementation of ERP can reduce Copyright © 2009 SciRes JSSM  SONGSHENG CHEN, LINGBING LIU 163 Figure 1. Framework of measurable indicators on benefit from ERP consumption and waste of raw material. Matolcsy et al. [10] think ERP help companies make timely payments, which can get more concessions, such as cash discount, in result, accelerated the APT (accounts payable turnover) is increased and the day of account payable is reduced. In production operation segment, ERP systems are used to integrate the information of market and sales, which directly support planning and controlling the pro- duction operation [14]. ERP systems help improve FAT and reduce leave unused equipment and maintain fix asset, which has improved the efficiency of utilization of machinery and equipment. The study both in America and Australia prove it. Matolcsy et al. [10] prove that the FAT of ERP users is much higher than other enterprises. Besides, ERP systems improve inventory management, reduce waste and update inventory more timely, thus, the implementation of ERP improves IT. In market and sales segment, ERP systems promote the growth of sales, and enhance the value of the enter- prise [15]. ERP improved SC by reengineering business, integrating procurements and sales, improving the qual- ity of service. ERP systems make management of ac- count receivable more standardized, customer payment timelier, so APT is sped up. In service segment, ERP systems improve the quality of service, which need to be investigated by question- naires, however. In this paper, we focus on the research on financial indicators, which will not involve in this issue. Moreover, ERP systems promote the activities in the entire value chain, improve business performance. ERP systems are supporting to timely provide high-quality qualitative and quantitative analysis reports to the Board of Directors and senior leadership [16]. Therefore, ERP can increase NPR and CR [2]. In this paper, we set up a system of indicators based on value chain. A simplified diagrammatic represen tation of this is provided in Figure 1. In our framework, we introduce some control vari- ables, including BSR (balance sheet ratios), TA (total assets), ROE, in order to make the conclusion more reliable. This model may be not perfect, but since the data is accessible, we think it is the best one at pre- sent*. 4. Samples and Data Matolcsy et al. [10] think that using user samples in one software vendor can control some uncontrollable factors, such as unreasonable and unreliable results due to the difference between different ERP products. So, in this paper, we choose users of U8 (a kind of ERP product) produced by one Chinese software company, named Y1. We compare the tested groups (ERP users) and con- trolled groups (non-ERP users) respectively. In order to control the Variation factor, the industries of the tested groups is the same as the contr olled groups and the sales income of the tested groups is similar as the controlled groups, respectively. Davenport et al. [14] think the selection of time for research data should base on assumptions and standards the as following: firstly, the data within three years be- fore the implementation of ERP are sufficient; secondly, the data in two years after the implementatio n of ERP are almost sufficient; thirdly, in most case study, the data are only cover two years after the implementation of ERP. So it is thought the data in there years before and two years after the implementation of ERP can be used to provide information of benefit from ERP to the users. Matolcsy et al. [10] find that the benefit would be pro- duced in two years after the implementation of ERP and it is hard to ERP to bring users more benefit after two years. In this paper, we study on the data of six years, which are three years before the implementation of ERP (T=-3, T=-2, T=-1), the year of the implementation of ERP (T=0) and two years after the implementation of ERP (T=1, T=2). We adopt some financial indicators, including NPM (net profit margin), ART, APT, FAT, CR, NPR, SC, Asset-liability ratio, IT, TA(total assets) and ROE. *The source of the data used in our study is the public information o f listing companies in China. We can not access all of the information required by Porter’s Value Chain Model (1985). Some indicators in Value Chain Model are ignored in our study. 1For the reason of confidentiality, we do not use the true name of the company. Copyright © 2009 SciRes JSSM  SONGSHENG CHEN, LINGBING LIU Copyright © 2009 SciRes JSSM 164 Table 1. Statistical description (N=112) C: Annual income A: Compared by industries Number of Co. Annual income (¥ Million) Tested group Controlled group 01 Finance 1 <100 10 8 02 Public Utility 7 >=100 and <200 15 14 03 Real Estate 2 >=200 and <300 14 12 04 Integration 15 >=300 and <400 8 12 05 Industry 74 >=400 and <500 6 3 06 Commerce 13 >=500 and <1000 19 25 B: Year ERP introduced Number of Co.>=1000 40 38 2000 21 2001 43 2002 13 2003 23 2004 12 Total 112 112 Ac c o rd i n g to the requirements abov e, we find 112 use r s of Y Company1, who are Chinese listed companies (Ta- ble 1). It is showed in Table 1 that the most of the ERP users are in industry (74), the second is Integration (15) and Commerce (13) an d the most of users introduced ERP in 2001 (43). The annual income of the companies in both tested group and controlled group is between ¥100 million and ¥1000 million(Table 1(C)). To compare the indicators, the mean of every indicator of ERP users in tested group is higher than that of non-ERP users in controlled group (the calculation table is omitted) in the three years before the implementation of ERP. However, it is showed that the situation is not better after introducing ERP than before. For example, the mean of SC of tested group in t=-3, t=-2 and t=-1 is 0.262, 0.343, 0.73 and that of controlled group is 0.239, 0.183, 0.27, respectively. After implementation of ERP, the mean of SC of tested group in t=1and t=2 is 0.20, 0.33, which is still higher th an that of controlled group is 0.21, 0.25, respectively, as a whole. To compare SC be- fore and after implementation of ERP, we can find that it is not higher after implementation of ERP than before as a whole. Other financial performance indicators are the same, such as NPM and NPR. In the six years (t=-3, t=-2, t=-1, t=0, t=1 and t=2), the value of NMP in tested group is 0. 28 6 ( 0 .255*), 0.27 ( 0 .251*), 0.28 (0 .25*), 0.27 (0.25*), 0.26 (0 .2 7*) , 0.25 (0.25 *)2 and the valu e o f NPR is 8.3 (0.075**), 0.127 (0.088**), 0.11 (0.04**), -0.04 (-0.1**), -0.01 (0.04**), 0.05 (0.02**)3, respectively. The differences of the mean of the indicators are not sig- nificant in Statistic, which means the selected samples are valid. We test t value for the difference of mean of the indi- cators and find most of them are not significant except for NPR, the difference of mean is significant in t=-1 (the difference of mean is 0.1). It represents that the mean of NPR in tested group just before introducing ERP is much higher than that in controlled group. We find that the mean of NPM in tested group is generally higher than that in controlled group in the year t=-3, t=-2, t=-1 and t=0, which are 0.03, 0.01, 0.02 and 0.02, respectively. All of them have passed by Wilcoxon test. Also, we find that the mean of NPR in tested group is generally higher than th at in controlled group in the year t=-3, t=-2, t=-1 and t=0, which are 0.005 , 0.04, 0.10 an d 0.04, respectively. All of them have passed by Wilcoxon test. According to the three test methods above, the results show that firstly the mean of indicators in tested group is generally higher than that in controlled group before im- 1The user list is provided by Y Company. 2It represents the value of NMP in controlled group. 3It represents the value of NMP in controlled group.  SONGSHENG CHEN, LINGBING LIU 165 plementing ERP and secondly the mean of indicators after implementing ERP is generally not higher than that before implementing ERP in tested group. So we could say that the enterprises in good financial performance could have the funds to introduce expensive ERP soft- ware, not the other way around. Other finding of us is the mean of ㏑(TA) in tested group is lower than that in controlled group, which dif- ference is -0.18. We think the reason probably is that the introduction of ERP shows down the growth of assets, however, we have no strong evidence to check it. Be- sides, the SC of ERP users is not increased but decreased. Although it is not significant in statistics, the difference of mean is -0.11. We think the reason probably is that the running between the departments need more time since the introdu ction of ERP, which leads to slow down the speed of growth of sales. 5. Statistical Analysis We use statistical analysis on the single variable and the multi-variance to test the prior results. We use time window for analysis [-3, 0], [-2, 0], [-1, 0], [0, +1], [0, +2]. The absolute change and relative change on the value of financial indicators are compared respectively, as well as t distribution tested. The indicators are divided into three group, including measurable indicators of op- eration (IT, FAT), measurable indicators of logistics (ART, APT, SC) and measurable indicators of business financial performance (NPR, CR). The three groups are compared with one another. 5.1 Analysis on Signal Variable and Results It shows that there are no difference between the finan- cial indicators in both tested group and controlled group in window [-3, 0], [-2, 0] and [-1, 0]. There is no ‘noise’, which represents it can be used in the following analysis with window [0, 1], [0, 2] (the calculation table is omit- ted). In [0, 1] window, the mean of TA in tested group is 0.09 which is higher than th at in con tro lled group (-0.95) in the first year after introducing ERP. It shows that the overall strength of the companies is strengthened be- cause the size is expanded after introduction of ERP. Meanwhile, the mean of APT in tested group is -0.19 which lower than that in controlled group (0.81). We think one of the reasons probably is th at some new man- agement problems come out and the running be tween the departments takes more time since the introduction of ERP, what leads to the payment to vendors is delayed. The other reason probably is that the companies in tested group generally have better reputation and become stronger in operation, or is more powerful in the buyer's market after implementing ERP, then they make use of non-cost capital and reduce cost of funding by postpone payables to their vendors. On the contrary, the compa- nies in controlled group are generally weaker than those in tested group. So, they need to pay on time. The mean of TA in tested group is -0.18 which is much lower than that in controlled group (1.54) and it is significant is t test. We think the reason probably is that the running between the departments takes more time since the in- troduction of ERP in result of slow ing down the turnover of the inventory. In [0, 2] window, the mean of TA in tested group is 0.17 which is higher than th at in con tro lled group (-0.95), which we think is due to the implementing of ERP, which push up the total assets, as well the strength of the companies by absorbing more fund and investment. As- set-liability ratio has little change while the total assets are stable in tested group in the two years after introduc- ing ERP. Meanwhile, it changes much in controlled group. Both of them are significant in t test. It represents that the net assets decreased and the liabilities increased in controlled group and the overall strength is weakened and the business operation is in the poor conditions. Meanwhile, ERP users are survived and maintain their stable capital structure and grow th. It shows that in all of the measurable indicators, the mean value of the indica- tors including APT, IT, Asset-liability ratio, and ㏑(TA), have little changes and others. And others have great changes which are significant in t test. Therefore, ERP has increased the users’ economic benefit, generally. 5.2 Variable and Results Analysis on Multi-Variance and Results Referring to Table 2(A) and 2(B), we find that the value of indicators in tested group is generally higher than that in controlled group two years before introducing ERP, which confirms the foregoing conclusion. Referring to Table 2(C) and 2(D ), we find that the value of indicators in tested group is generally higher than that in controlled group two years after introducing ERP and is significant in t test. We can see in Table 2(D) that the differences of the value of indicators in [0, 2] are significant, such as SC, APT, ART and this result is the same as those in the single variable analysis. Thus, we can conclude that these changes are brought by ERP. Meanwhile, we find that there is little change in NPR, CR which indicates the ultimate financial performance of the business. We con- sider the reason might be that it takes a long time for Copyright © 2009 SciRes JSSM  SONGSHENG CHEN, LINGBING LIU 166 Table 2. Results on multi-variance analysis between tested group and controlled group Sig. of F on absolute change Sig. of F on % change Sig. of F on absolute change Sig. of F on % change Item Pillais Single factor Pillais Single factorItemPillaisSingle factor Pillais Single factor A: Multivariate tests of significance [-2, 0] C: Multivariate tests of significance [0,1] Group 1: IT and FAT Group 1: IT and FAT IT 1.82 0.95 10.544***1.05 IT2.07 5.144** 6.45*** 8.578*** FAT 1.82 0 10.544***0.02 FAT2.07 0.05 6.45*** 1.44 Group 2: ART, APT and SC Group 2: ART, APT and SC ART 1.4 0.95 9.458*** 0.03 ART0.75 0.44 3.988*** 1.51 APT 1.4 0.55 9.458*** 1.09 APT0.75 3.141** 3.988*** 2.07 SC 1.4 0.82 9.458*** 2.41 SC0.75 0.81 3.988*** 1.04 Group 3: NPR and CR Group 3: NPR and CR NPR 6.519*** 0.309 7.328*** 0.69 NPR1.10 0.86 5.117*** 0 CR 6.519*** 0.592 7.328*** 0.001 CR1.1 1.89 5.117*** 0.87 B: Multivariate tests of significance [-1,0] D: Multivariate tests of significance [0,2] Group 1: IT and FAT Group 1: IT and FAT IT 0.55 0.07 6.5*** 1.74 IT0.11 0.55 2.01 0.94 FAT 0.55 2.17 6.5*** 0.2 FAT0.11 0.25 2.01 1.1 Group 2: ART, APT and SC Group 2: ART, APT and SC ART 0.7 2.21 5.558*** 0 ART0.32 0.27 5.56*** 0.53 APT 0.7 2.33 5.558*** 1.46 APT0.32 0.18 5.56*** 0.03 SC 0.7 0.91 5.558*** 0.29 SC0.32 0.26 5.56*** 1.76 Group 3: NPR and CR Group 3: NPR and CR NPR 4.389** 0.081 1.011 3.206** NPR17.175***0.351 19.399*** 0.28 CR 4.389** 0.044 1.011 0.023 CR17.175***1.129 19.399*** 0.277 t test of significance: <0.1; **<0.05; ***<0.01 ERP to produce some economic benefit and the time of two years is too short to ex amine the users’ benefit fro m ERP. Moreover, the users should not count on one man- agement software to solve all problems in their business operation without business process reengineering. Ac- cording to the investigation in some companies with ERP, the users think the main function of ERP is to speed up the business process. As for the financial performance, the users should not expect ERP bring the benefit in a short time. In conclusion , the analysis both on single v ariance and multi-variance shows that ERP can help users enhance the value of indicators on logistics, but can bring little benefit on other aspects. 6. Conclusions The ERP users generally have better performance in the three years before the introduction of ERP than the con- trolled group, if the effect of the industry and size factors is left out of account, which might represent that the corporations who introduce the costly ERP system are generally better performance and stronger ones. The total assets of the ERP users in tested group are increased and the asset-liability ration is stable after in- troducing ERP. Meanwhile, the total assets of the non- ERP users in controlled group are stable and the as- set-liability ration is decreased. The results show that ERP can help users maintain the capital structure and growth in the situation that the others’ strength becomes weak. The inventory turnover and account payable turnover of the ERP users have been slowed down instead of speeding up in the two years after introducing ERP, which might represents that the overall benefits of ERP are not brought into play within two years. Even, the new system might hinder the normal business operation in the Copyright © 2009 SciRes JSSM  SONGSHENG CHEN, LINGBING LIU 167 early. We consider there might be another reason for the decrease of account payable turnover that ERP help the users strengthen their strength and enhance the credit standing, in result, the companies in the buyer’s market who can defer the payments to vendors in order to mak- ing use of more non-cost funds and reduce their capital cost. In conclusion, the key finding in the analysis and discussion of the survey results is th at ERP can bring the users part changes and there might be no improvement on some indicators as expected in the first two years after introducing ERP. However, we should make conclusions carefully be- cause the study is based on the limited users’ data, which covers only 2 years after introducing ERP. If this ex- ploratory study can base on more private data, it will help to develop the value chain model and measure ERP benefits better. Of course, the conclusion will not be dif- ferent since the test on steadiness has been done. The conclusions above also remind ERP users that they should not expect the immediate effect and benefits of ERP. The business reengineering and time are neces- sary for ERP producing benefits. ERP may bring users some favorite changes but not all. Sometimes, it could also bring some harm. Besides, the software vendors also should pay attentio n to the way to reduce cost in order to absorb more potential customers, as well as better meet- ing the users’ requirements on software design. REFERENCES [1] M. L. Markus, C. Tanis, and F. P. Van, “Multi-site ERP implementations,” Communications of the ACM, Vol. 43, No. 4, pp. 42-46, 2000. [2] J. E. Hunton, B. Lippincott, and J. L. Reck, “Enterprise resource planning ERP systems: Comparing firm per- formance of adopters and non-adopters,” International Journal of Accounting Information Systems, Vol. 4, No. 3, pp. 165-184, 2003. [3] A. I. Nicolaou, T. D. Stratopoulos, and B. Dehning, “Fi- nancial analysis of potential benefits from ERP systems adoption,” Journal of Business and Information Tech- nology, Vol. 2, No. 1, pp. 40-50, 2003. [4] L. Y. Wang and J. D. Zhang, “Research on the perform- ance of listed companies with exposure on implementa- tion of ERP-evidence from listed companies 2003,” Management World, Vol. 15, No. 3, pp. 116-121, 2007. [5] W. H. DeLone and E. R. McLean, “Information system success: The quest for the dependent variable,” Informa- tion Systems Research, Vol. 3, No. 1, pp. 60-95, 1992. [6] W. H. DeLone and E. R. McLean, “The DeLone and McLean model of information systems success: A ten-year update,” Journal of Management Information Systems, Vol. 19, No. 4, pp. 9-30, 2003. [7] J. H. Huang and C. Yang, “Measuring satisfaction with business-to-employee systems,” Computer in Human Behavior, No. 1, pp. 17-35, 2004. [8] F. Calisir and F. Calisir, “The relation of interface usabil- ity characteristics, perceived usefulness, and perceived ease of use to end-user satisfaction with enterprise re- source planning ERP system,” Computer in Human Be- havior, Vol. 20, No. 4, pp. 505-515, 2004. [9] J. H. Wu and Y. M. Wang, “Measuring ERP success: The key-users’ viewpoint of the ERP to produce a viable IS in the organization,” Computers in Human Behavior, No. 6, pp. 1582-1596, 2007. [10] Z. P. Matolcsy, P. Booth, and B. Wieder, “Economic be- nefits of enterprise resource planning systems: Some em- pirical evidence,” Accounting and Finance, Vol. 45, No. 3, pp. 439-456, 2005. [11] R. Poston and S. Grabski, “Financial impacts of enter- prise resource planning implementations,” International Journal of Accounting Information Systems, Vol. 2, pp. 271-294, 2001. [12] B. Dehning and V. J. Richardson, “Returns on invest- ments in information technology: A research synthesis,” Journal of Information Systems, No. 16, pp. 7-30, 2002. [13] M. E. Porter, “Competitive advantage,” Free Press, New York/London, 1985. [14] T. H. Davenport, J. G. Harris, and S. Cantrell, “The re- turn of enterprise solutions: The director’s cut,” Accen- ture Institute for High Performance Business, 2002. [15] S. C. Gardiner, J. B. Hanna, and M. S. LaTour, “ERP and the reengineering of industrial marketing processes: A prescriptive overview for the new-age marketing man- ager,” Industrial Marketing Management, No. 31, pp. 357 -336, 2002. [16] S. S. Shang and P. B. Seddon, “Comprehensive frame- work for classifying the benefits of ERP system,” in Pro- ceedings of the Americas Conference on Information Systems, Long Beach California, pp. 1005-1014, 2000. Copyright © 2009 SciRes JSSM |