 Materials Sciences and Applicatio n, 2011, 2, 749-757 doi:10.4236/msa.2011.27103 Published Online July 2011 (http://www.SciRP.org/journal/msa) Copyright © 2011 SciRes. MSA FP-LMTO Investigation of the Structural and Electronic Properties of CuxAg1–xI Alloys Mohammed Ameri1*, Noureddine Bouzouira1, Mohammed Doui-Aici2, Rabah Khenata3,4, Abdelkader Yakoubi5, Boualem Abidri1, Nouredinne Moulay1, Mohammed Maachou1 1Département de Physique, Faculté des Sciences, Université Djillali Liabès, Sidi-Bel-Abbés, Algérie; 2Laboratoire des Matériaux Appliqués, Centre de Recherche (Ex:CFTE), Route de Mascara, Université de Sidi-Bel-Abbès, Sidi-Bel-Abbès, Algérie; 3Laboratoire de Physique Quantique et de Modélisation Mathématique de la Matière (LPQ3 M), Université de Mascara, Mascara, Algérie; 4Department of Physics and Astronomy, Faculty of Science, King Saud University, Riyadh, Saudi Arabia; 5Laboratoire Modeling and Simulation Materials Sciences Laboratory, Sidi-Bel-Abbès University, Sidi-Bel-Abbès,Algeria. Email: lttnsameri@yahoo.fr Received December 28th, 2010; revised March 28th, 2011; accepted May 8th, 2011. ABSTRACT The structural and electronic properties of the ternary CuxAg1–xI, alloy have been calculated, using the full-potential linear muffin-tin -orbital (FP-LMTO) method based on density functional theory, within both the local density ap proxi- mation and the generalized gradient approximation (GGA). The equilibrium lattice constants and the bu lk modulus are compared with previous theoretical calculations. The concentration dependence of the electronic band structure and the direct-indirect band gaps is also investigated. Using the approach of Zunger and co-workers the microscopic ori- gins of the gap bowing were also explained. Keywords: (FP-LMTO) Method, CuxAg1–xI Alloy 1. Introduction Silver iodide and copper iodide have received attention as promising materials for applications in technological devices and are used as model systems in both physical and numerical experiments [1]. These compounds which have four valence electrons per atoms, crystallize in a tetrahedral coordinated zinc-blende (ZB) structure [2,3] under ambient conditions. Silver iodide can exist in three crystal polymorphs at atmospheric pressure. Below 420 K silver iodide crystallizes in the hexagonal β phase (wurtzite structure). Copper iodide also has several transformations. The low-temperature cubic γ-CuI phase with the zinc blende structure, transforms to the β phase with a distorted hexagonal structure and a rock salt structure above 673 K (α-CuI). Another interesting fea- ture of these systems is that the lattice mismatch between CuI and AgI is very small and therefore it is useful to combine them for forming CuxAg1–xI alloys. Indeed, CuI and AgI binary compounds form a continuous series of alloys (CuxAg1–xI), where 0 < x < 1 denotes the molar fraction of Cu. Both CuI and AgI crystallizes in the cubic zinc blende structure. Hence, one would expect that the different properties of the ternary alloy to be vary smooth- ly between the end points. Moreover, it was shown ex- perimentally [4] that the α-CuxAg1–xI based solid solutions in the quasibinary AgI–CuI system exists over a wide temperature range. The ionic transport in CuxAg1–xI was studied by Nölting and co-workers and Kusakabe et al. [4,5]. They have observed that the electric conductivity reduced with increasing the copper concentration. Goldmann [6] reviewed detailed experimental and theoretical information of the valence and conduction band states in CuI, and AgI. He proposed a band struc- ture model which is able to interpret all available ex- perimental information extracted from optical absorption spectroscopy, soft X-ray absorption and emission spec- troscopy. Theoretically, many calculations using the mo- lecular dynamics simulations [7,8] have been done to characterize the structural, electronic, and optical proper- ties of these systems. Thus our main goal of this work is to study the effect of increasing concentration of copper on the structural and electronic properties band structure such as lattice constant, bulk modulus, band gaps and effective masses by using the full potential linear muffin-tin orbitals (FP-LMTO) method. In this work, we have used the “special quasirandom structures” (SQS) approach of  FP-LMTO Investigation of the Structural and Electronic Properties of Cu Ag I Alloys 750 x1–x Zunger et al. [9] to reproduce the randomness of the al- loys for the first few shells around a given site. This ap- proach is reasonably sufficient to describe the alloys with respect to many physical properties that are not affected by the errors introduced using the concept of the perio- dicity beyond the first few shells. The organization of the article is as follows. The computational method we have adopted for the calcula- tions is described in Section 2. We present our results in Section 3. Finally, conclusions are given in Section 4. 2. Method of Calculations The calculations reported here were carried out using the ab-initio full-potential linear muffin-tin orbital (FP- LMTO) method [10-13] as implemented in the Lmtart code [14]. The exchange and correlation potential was calculated using the local density approximation (LDA) [15] and the generalized approximation (GGA) [16]. This is an improved method compared to previous (LMTO) methods. The FP-LMTO method treats muffin-tin spheres and interstitial regions on the same footing, leading to improvements in the precision of the eingen- values. At the same time, the FP-LMTO method, in which the space is divided into an interstitial regions (IR) and non overlapping muffin-tin spheres (MTS) sur- rounding the atomic sites, uses a more complete basis than its predecessors. In the IR regions, the basis func- tions are represented by Fourier series. Inside the MTS spheres, the basis functions are represented in terms of numerical solutions of the radial Schrödinger equation for the spherical part of the potential multiplied by spherical harmonics. The charge density and the potential are represented inside the MTS by spherical harmonics up to lmax = 6. The integrals over the Brillouin zone are performed up to 42 special k-points for binary compounds and 32 special k-points for the alloys in the irreducible Brillouin zone (IBZ), using the Blöchl’s modified tetra- hedron method [17]. The self-consistent calculations are considered to be converged when the total energy of the system is stable within 10–5 Ry. In order to avoid the overlap of atomic spheres the MTS radius for each atomic position is taken to be different for each case. Both the plane waves cut-off are varied to ensure the total energy convergence. The values of the sphere radii (MTS), number of plane waves (NPLW), used in our calculation are summarized in Table 1. 3. Results and Discussions 3.1. Structural Properties As a first step we calculate the structural properties of the compounds CuI, AgI and their alloy in the cubic struc- ture by means of full-potential LMTO method. As for the semiconductor ternary alloys in the type BxA1–xC, we have started our FP-LMTO calculation of the structural properties with the zinc-blende structure and let the cal- culation forces to move the atoms to their equilibrium positions. We have chosen the basic cubic cell as the unit cell. In the unit cell there are four C anions and three A and one B, two A and two B, and one A and three B cations, respectively, for x = 0.25, 0.50 and 0.75. For the considered structures, we perform the structural optimi- zation by calculating the total energies for different vol- umes around the equilibrium cell volume V0 for CuI and AgI binary compounds and their alloys. The calculated total energies are fitted to the Murnaghan’s equation of state [18] to determine the ground state properties such as the equilibrium lattice constant a, and the bulk modulus Table 1. The plane wave number PW, energy cut-off (in Ry) and the muffin-tin radius (RMT) ( in a.u.) used in calculation for binary AgI and CuI and their alloy in zinc blende (ZB) structure. PW Ecut total (Ry) RMT (a.u) x LDA GGA LDA GGA LDA GGA 0 5064 12050 75.918 123.177 Ag 2.490 2.607 I 2.808 2.939 0.25 33400 65266 108.971 155.912 Cu 2.449 2.560 Ag 2.449 2.560 I 2.762 2.845 0.50 33400 65266 113.796 163.276 Cu 2.350 2.477 Ag 2 .350 2.477 I 2.750 2.845 0.75 33400 65266 118.805 171.247 Cu 2.300 2.418 Ag 2.300 2.418 I 2.691 2.778 1 5064 9984 90.1556 131.503 Cu 2.180 2.267 I 2.674 2.771 Copyright © 2011 SciRes. MSA  FP-LMTO Investigation of the Structural and Electronic Properties of Cu Ag I Alloys 751 x1–x B. The calculated equilibrium parameters (a and B) are given in Table 2 which also contains results of previous calculations as well as the experimental data. On the whole, our calculated structural parameters are in good agreement with those obtained by first-principles meth- ods within different approximations. The calculated lat- tice parameters values for the binary compounds are in good agreement with the measured data, which ensure the reliability of the present first-principles computations. The computed lattice parameters slightly underestimates and overestimates the measured data by using LDA and GGA, respectively, which are consistent with the general trend of these approximations. As it can be seen that the calculated lattice parameter for CuI (x = 1) is smaller than those of AgI (x = 0); a0 (CuI) < a0 (AgI). As the anion atom is the same in both compounds, this result can be easily explained by considering the atomic radii of Cu and Ag: R(Cu) = 1.35 Å, R(Ag) = 1.60 Å, i.e., the lattice constant increases with increasing atomic size of the cation element. The bulk modulus value for CuI is larger than those of AgI; B (CuI) > B (AgI); i.e., in in- verse sequence to a0—in agreement with the well-known relationship between B and the lattice constants: , where 0 is the unit cell volume. Furthermore, the values of the calculated bulk modulus using both ap- proximations decreases from CuI to AgI, suggesting that the compressibility increases from CuI to AgI. 1 0 BV V Usually, in the treatment of alloys when the experi- mental data are scare, it is assumed that the atoms are located at the ideal lattice sites and the lattice constant varies linearly with composition x according to the so- called Vegard’s law [19]. 1 1 xAC aABC xaxa BC (1) where AC and BC are the equilibrium lattice con- stants of the binary compounds AC and BC respectively, (AxB1–xC) is the alloy lattice constant. However, vio- a a a lation of Vegard’s law has been observed in semiconduc- tor alloys both experimentally [20] and theoretically [21]. Hence, the lattice constant can be written as: 1 1 1 x xACBC aABCxaxaxxb (2) where the quadratic term b is the bowing parameter. Figures 1 and 2, show the variation of the calculated equilibrium lattice constants and the bulk modulus versus concentration x for CuxAg1–xI alloy. The obtained results for the composition dependence of the calculated equi- librium lattice parameter show an excellent agreement to Vegard’s law [19]. In going from AgI to CuI; when the Cu-content increases, the values of the lattice parameters of the CuxAg1–xI alloy decrease. This is due to the fact that the size of the Cu atom is smaller than those of Ag atom. Oppositely, one can see from Figure 2 that the value of the bulk modulus increases with increasing Cu concentration. The values of the bowing parameters are determined by a polynomial fit. Using the LDA ap- proximation, we obtained upward and downward bowing parameters equal to –0.11543 Å and 0.01143 GPa for the lattice and the bulk modulus, respectively. The GGA approximation gave values of –0.11543 Å and 13.95429 GPa for the bowing lattice parameter and the bulk mod- ulus, respectively. In view of Table 2, it is clear that both approximations follow the tendency demonstrated by both experimental measurement and theoretical calcula- tions. To the best of our knowledge, there are no experi- mental work exploring the structural properties (e.g.; the bulk modulus B and it pressure derivatives B') and the bowing parameters of the investigated alloys, but our results are relatively close to those of Ref. [22] obtained by using the full potential-linear augmented plane wave (FP-LAPW) method. 3.2. Electronic Properties The energy band gaps of the binary compounds as well Table 2. Calculated lattice parameter a and bulk modulus B compared to experimental and other theoretical values of CuI and AgI and their alloys. Lattice constant a (Ǻ) Bulk modulus B (Gpa) this work. expt. other calc. this work. expt. other calc. LDA GGA LDA GGA x 0 6.476 6.779 6.499a 6.650c, 6.61d, 6.872e 34.26 23.82 24j 26.667c, 40l 0.25 6.37 6.646 6.516c, 6,39f, 6.38g 37.93 24.7 27.405c, 20,3f, 26.0g 0.5 6.234 6.505 6.396c, 6.31f, 6.30g 42.2 26.61 30,104c, 23f, 27g 0.75 6.101 6.352 6.256c, 6.19f, 6.18g 45.58 29.55 37.765c, 27f, 28g 1 5.943 6.175 6.054b 6.098c, 6.097h, 6.082i 49.7 36.02 36.6b, 31k 38.872c, 39.447h, 39.7i, 35.2m aRef. [29]; bRef. [30]; cRef. [22]; dRef. [31]; eRef. [32]; fRef. [7]; gRef. [33]; hRef. [34]; iRef. [35]; jRef. [36]; kRef. [37]; lRef. [38]; mRef. [39]. Copyright © 2011 SciRes. MSA  FP-LMTO Investigation of the Structural and Electronic Properties of Cu Ag I Alloys 752 x1–x 6.8 6.7 6.6 6.5 6.4 6.3 6.2 6.1 6.0 5.9 0.0 0.2 0.4 0.6 0.8 1.0 Figure 1. Composition dependence of the calculated lattice constants within LDA (Solid Circle) and GGA (Solid Triangle) of CuxAg1–xI alloy compared with Vegard’s prediction (doted line). 0.0 0.2 0.4 0.6 0.8 1.0 Figure 2. Composition dependence of the calculated bulk modulus within GGA (Solid Circle) and LDA (Solid Square) of CuxAg1–xI alloy. as for their investigated alloy were calculated within the LDA and GGA schemes. In Table 3 we show the ob- tained results for the energy band gap of the CuxAg1<-xI alloy from our ab initio calculations for different values of the concentration x. These values correspond to 25, 50, 75 and 100 % CuI and AgI substitution, respectively. The exact value of the band-gap is obviously a crucial point to be addressed because it enters in the applications in technological devices. However, it can be seen from Table 3 that there is a large discrepancy between the reported experimental and theoretical values. This dis- crepancy is mainly due to the fact that both the simple form of LDA or GGA do note take into account the qua- siparticle self energy correctly [23] which make them not sufficiently flexible to accurately reproduce both exchange and correlation energy and its charge deriva- tive. We worth also mention that in general, it is far to say that the experimental data are well reproduced by the calculation. On raison for this difference is that in our calculations we have assumed the crystal to be at T = 0 K and thus do not include contributions from lattice vibrations that are present at room temperature meas- urements. It is important to note that the density func- tional formalism is limited in its validity (see. Ref [24]) and the band structure derived from it cannot be used directly for comparison with experiment. The variation of the concentration (x) versus the value of the direct band gap energy ( is with both LDA and GGA a p- proximation is shown in Figure 3. It is clearly seen that the direct energy gap show a non linear variation with copper concentration. The obtained energy versus con- centration curve is well fitted by the following quadratic phenomenological function. Copyright © 2011 SciRes. MSA 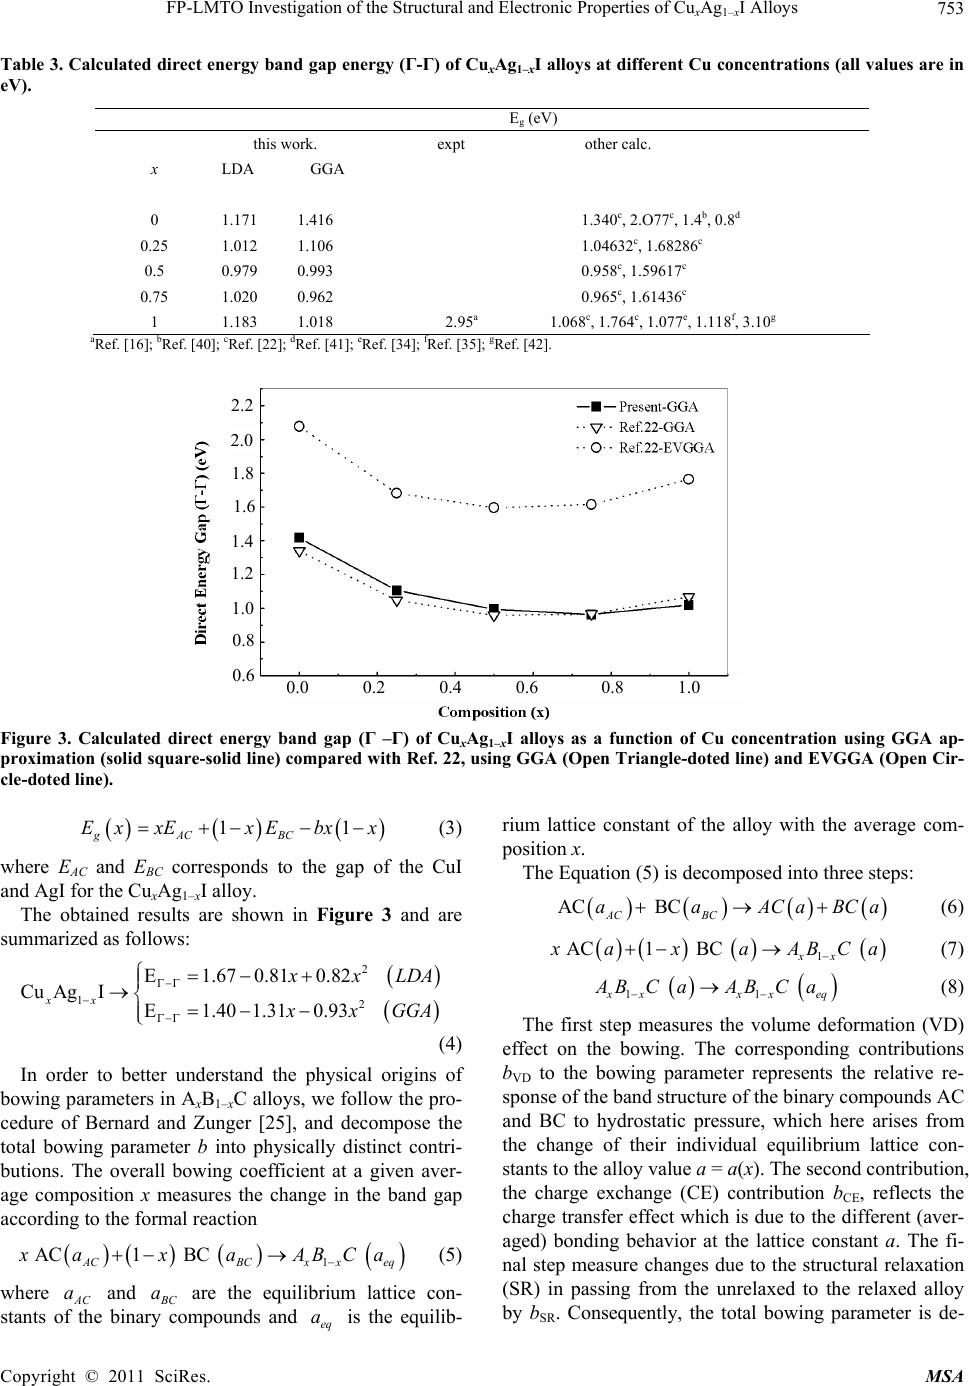 FP-LMTO Investigation of the Structural and Electronic Properties of Cu Ag I Alloys 753 x1–x Table 3. Calculated direct energy band gap energy (Γ-Γ) of CuxAg1–xI alloys at different Cu concentrations (all values are in eV). E g (eV) this work. expt other calc. x LDA GGA 0 1.171 1.416 1.340c, 2.O77c, 1.4b, 0.8d 0.25 1.012 1.106 1.04632c, 1.68286c 0.5 0.979 0.993 0.958c, 1.59617c 0.75 1.020 0.962 0.965c, 1.61436c 1 1.183 1.018 2.95a 1.068 c, 1.764c, 1.077e, 1.118f, 3.10g aRef. [16]; bRef. [40]; cRef. [22]; dRef. [41]; eRef. [34]; fRef. [35]; gRef. [42]. 2.2 2.0 1.8 1.6 1.4 1.2 1.0 0.8 0.6 0.0 0.2 0.4 0.6 0.8 1.0 Figure 3. Calculated direct energy band gap (Γ –Γ) of CuxAg1–xI alloys as a function of Cu concentration using GGA ap- proximation (solid square-solid line) compared with Ref. 22, using GGA (Open Triangle-doted line) and EVGGA (Open Cir- cle-doted line). 1 gAC BC Ex xExEbxx 1 (3) where EAC and EBC corresponds to the gap of the CuI and AgI for the CuxAg1–xI alloy. The obtained results are shown in Figure 3 and are summarized as follows: 2 12 E1.67 0.810.82 Cu AgIE1.40 1.310.93 xx xLDA x GGA (4) In order to better understand the physical origins of bowing parameters in AxB1–xC alloys, we follow the pro- cedure of Bernard and Zunger [25], and decompose the total bowing parameter b into physically distinct contri- butions. The overall bowing coefficient at a given aver- age composition x measures the change in the band gap according to the formal reaction 1 AC1 BC ACBCx xeq axaABC a (5) where AC and a C are the equilibrium lattice con- stants of the binary compounds and is the equilib- rium lattice constant of the alloy with the average com- position x. a eq a The Equation (5) is decomposed into three steps: AC BC AC BC aaACaBCa (6) 1 AC1 BC xx axaABC a (7) 11 xxxeq BCa ABCa (8) The first step measures the volume deformation (VD) effect on the bowing. The corresponding contributions bVD to the bowing parameter represents the relative re- sponse of the band structure of the binary compounds AC and BC to hydrostatic pressure, which here arises from the change of their individual equilibrium lattice con- stants to the alloy value a = a(x). The second contribution, the charge exchange (CE) contribution bCE, reflects the charge transfer effect which is due to the different (aver- aged) bonding behavior at the lattice constant a. The fi- nal step measure changes due to the structural relaxation (SR) in passing from the unrelaxed to the relaxed alloy by bSR. Consequently, the total bowing parameter is de- Copyright © 2011 SciRes. MSA 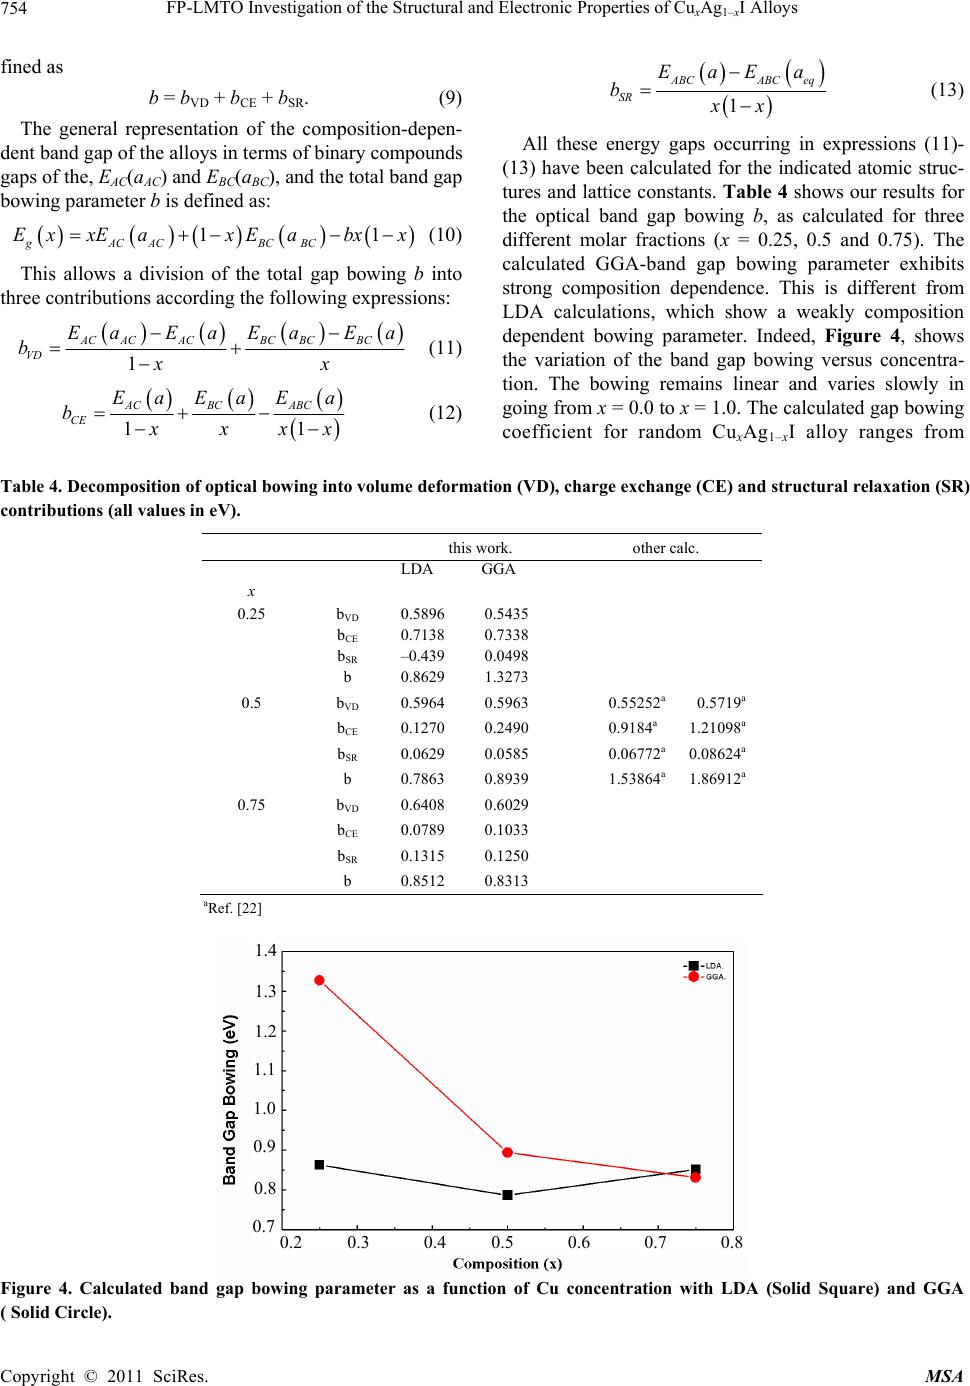 FP-LMTO Investigation of the Structural and Electronic Properties of Cu Ag I Alloys 754 x1–x 1 fined as b = bVD + bCE + bSR. (9) The general representation of the composition-depen- dent band gap of the alloys in terms of binary compounds gaps of the, EAC(aAC) and EBC(aBC), and the total band gap bowing parameter b is defined as: 1 gACAC BCBC ExxEaxE abxx (10) This allows a division of the total gap bowing b into three contributions according the following expressions: 1 ACACACBC BCBC VD EaEaEa Ea bxx (11) 11 AC BC ABC CE EaEaE a b xxx (12) 1 ABCABC eq SR EaEa bxx (13) All these energy gaps occurring in expressions (11)- (13) have been calculated for the indicated atomic struc- tures and lattice constants. Table 4 shows our results for the optical band gap bowing b, as calculated for three different molar fractions (x = 0.25, 0.5 and 0.75). The calculated GGA-band gap bowing parameter exhibits strong composition dependence. This is different from LDA calculations, which show a weakly composition dependent bowing parameter. Indeed, Figure 4, shows the variation of the band gap bowing versus concentra- tion. The bowing remains linear and varies slowly in going from x = 0.0 to x = 1.0. The calculated gap bowing coefficient for random CuxAg1–xI alloy ranges from Table 4. Decomposition of optical bowing into volume deformation (VD), charge exchange (CE) and structural relaxation (SR) contributions (all values in eV). this work. other calc. LDA GGA x 0.25 bVD 0.5896 0.5435 b CE 0.7138 0.7338 b SR –0.439 0.0498 b 0.8629 1.3273 0.5 bVD 0.5964 0.5963 0.55252a 0.5719a b CE 0.1270 0.2490 0.9184a 1.21098a b SR 0.0629 0.0585 0.06772a 0.08624a b 0.7863 0.8939 1.53864a 1.86912a 0.75 bVD 0.6408 0.6029 b CE 0.0789 0.1033 b SR 0.1315 0.1250 b 0.8512 0.8313 aRef. [22] 1.4 1.3 1.2 1.1 1.0 0.9 0.8 0.7 0.2 0.3 0.4 0.5 0.6 0.7 0.8 Figure 4. Calculated band gap bowing parameter as a function of Cu concentration with LDA (Solid Square) and GGA ( Solid Circle). Copyright © 2011 SciRes. MSA 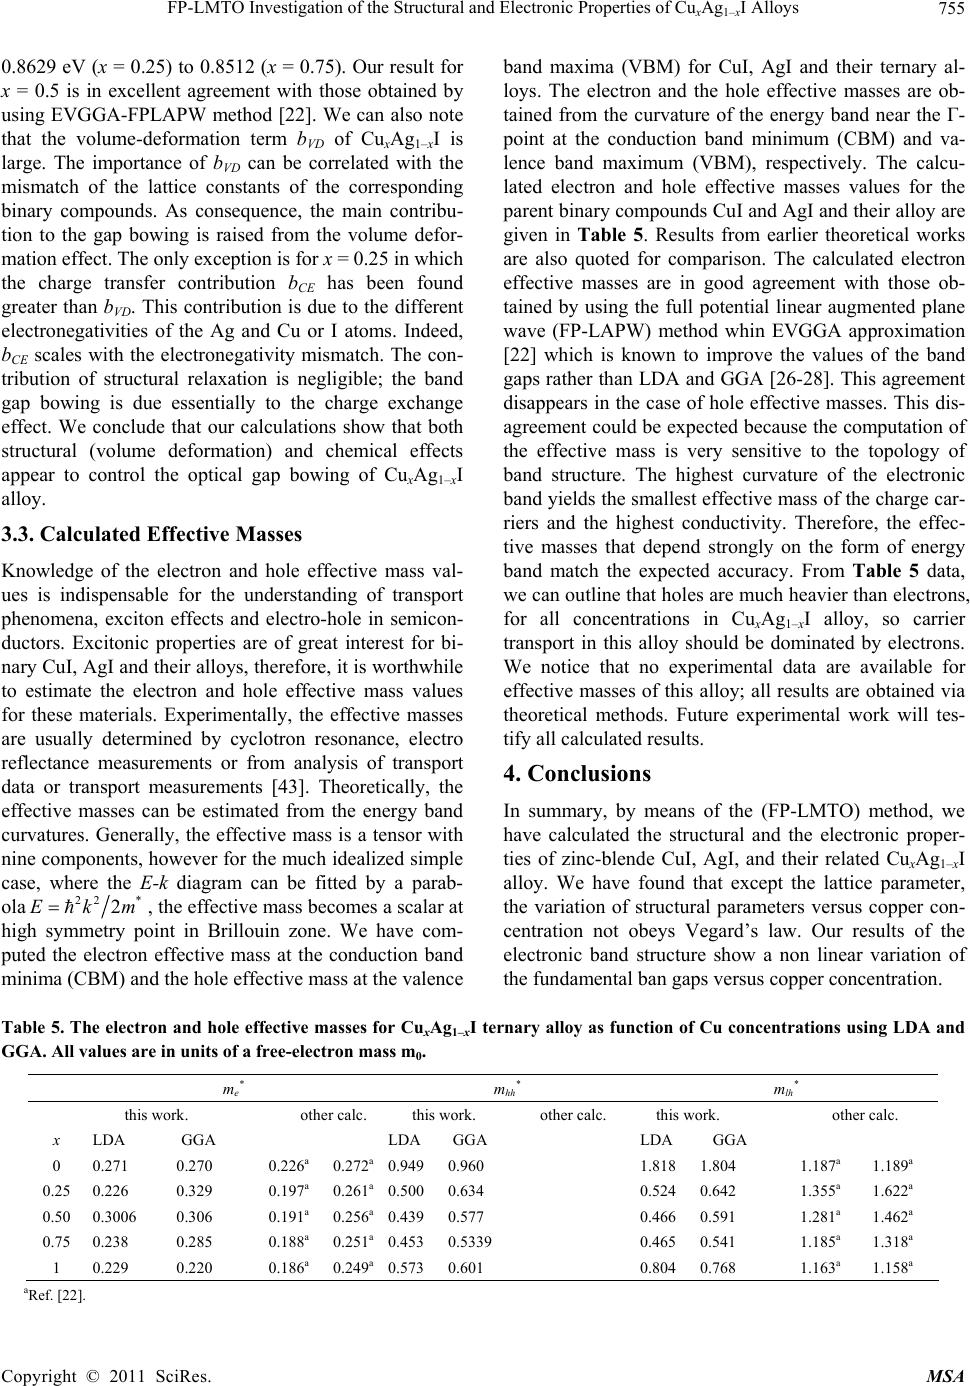 FP-LMTO Investigation of the Structural and Electronic Properties of Cu Ag I Alloys 755 x1–x 0.8629 eV (x = 0.25) to 0.8512 (x = 0.75). Our result for x = 0.5 is in excellent agreement with those obtained by using EVGGA-FPLAPW method [22]. We can also note that the volume-deformation term bVD of CuxAg1–xI is large. The importance of bVD can be correlated with the mismatch of the lattice constants of the corresponding binary compounds. As consequence, the main contribu- tion to the gap bowing is raised from the volume defor- mation effect. The only exception is for x = 0.25 in which the charge transfer contribution bCE has been found greater than bVD. This contribution is due to the different electronegativities of the Ag and Cu or I atoms. Indeed, bCE scales with the electronegativity mismatch. The con- tribution of structural relaxation is negligible; the band gap bowing is due essentially to the charge exchange effect. We conclude that our calculations show that both structural (volume deformation) and chemical effects appear to control the optical gap bowing of CuxAg1–xI alloy. 3.3. Calculated Effective Masses Knowledge of the electron and hole effective mass val- ues is indispensable for the understanding of transport phenomena, exciton effects and electro-hole in semicon- ductors. Excitonic properties are of great interest for bi- nary CuI, AgI and their alloys, therefore, it is worthwhile to estimate the electron and hole effective mass values for these materials. Experimentally, the effective masses are usually determined by cyclotron resonance, electro reflectance measurements or from analysis of transport data or transport measurements [43]. Theoretically, the effective masses can be estimated from the energy band curvatures. Generally, the effective mass is a tensor with nine components, however for the much idealized simple case, where the E-k diagram can be fitted by a parab- ola 22 * 2Ekm, the effective mass becomes a scalar at high symmetry point in Brillouin zone. We have com- puted the electron effective mass at the conduction band minima (CBM) and the hole effective mass at the valence band maxima (VBM) for CuI, AgI and their ternary al- loys. The electron and the hole effective masses are ob- tained from the curvature of the energy band near the Γ- point at the conduction band minimum (CBM) and va- lence band maximum (VBM), respectively. The calcu- lated electron and hole effective masses values for the parent binary compounds CuI and AgI and their alloy are given in Table 5. Results from earlier theoretical works are also quoted for comparison. The calculated electron effective masses are in good agreement with those ob- tained by using the full potential linear augmented plane wave (FP-LAPW) method whin EVGGA approximation [22] which is known to improve the values of the band gaps rather than LDA and GGA [26-28]. This agreement disappears in the case of hole effective masses. This dis- agreement could be expected because the computation of the effective mass is very sensitive to the topology of band structure. The highest curvature of the electronic band yields the smallest effective mass of the charge car- riers and the highest conductivity. Therefore, the effec- tive masses that depend strongly on the form of energy band match the expected accuracy. From Table 5 data, we can outline that holes are much heavier than electrons, for all concentrations in CuxAg1–xI alloy, so carrier transport in this alloy should be dominated by electrons. We notice that no experimental data are available for effective masses of this alloy; all results are obtained via theoretical methods. Future experimental work will tes- tify all calculated results. 4. Conclusions In summary, by means of the (FP-LMTO) method, we have calculated the structural and the electronic proper- ties of zinc-blende CuI, AgI, and their related CuxAg1–xI alloy. We have found that except the lattice parameter, the variation of structural parameters versus copper con- centration not obeys Vegard’s law. Our results of the electronic band structure show a non linear variation of the fundamental ban gaps versus copper concentration. Table 5. The electron and hole effective masses for CuxAg1–xI ternary alloy as function of Cu concentrations using LDA and GGA. All values are in units of a free-electron mass m0. me* mhh* m lh* this work. other calc. this work. other calc. this work. other calc. x LDA GGA LDA GGA LDA GGA 0 0.271 0.270 0.226a 0.272a 0.949 0.960 1.818 1.804 1.187a 1.189a 0.25 0.226 0.329 0.197a 0.261a 0.500 0.634 0.524 0.642 1.355a 1.622a 0.50 0.3006 0.306 0.191a 0.256a 0.439 0.577 0.466 0.591 1.281a 1.462a 0.75 0.238 0.285 0.188a 0.251a 0.453 0.5339 0.465 0.541 1.185a 1.318a 1 0.229 0.220 0.186a 0.249a 0.573 0.601 0.804 0.768 1.163a 1.158a aRef. [22]. Copyright © 2011 SciRes. MSA  FP-LMTO Investigation of the Structural and Electronic Properties of Cu Ag I Alloys 756 x1–x We have characterized the deviation from the linear be- havior by calculating the optical bowing parameter. The effective masses of the systems studied in this work were calculated and are found comparable to those obtained by FPLAPW method. 5. Acknowledgements Author Rabah KHENATA extends his appreciation to the Deanship of Scientific Research at King Saud Uni- versity for funding the work through the research group project N0 RPG-VPP-088 REFERENCES [1] A. K. Ivanov-Shits and I. V. Murin “Ionika Tverdogo tela,” Izd-vo SPbGU, S.-Peterburg, 2000. [2] J. G. P. Binner, G. Dimitrakis, D. M. Price1, M. Reading and B. Vaidhyanathan, “Hysterisis in the Phase Transition in Silver Iodide,” Journal of Thermal Analysis and Calo- rimetry, Vol. 84, No. 2, 2006, pp. 409-412. doi:10.1007/s10973-005-7154-1 [3] F. Wells, “Structural Inorganic Chemistry,” Oxford Uni- versity Press, Oxford, 1984. [4] J. Nölting and Ber. Bunsenges, Physik. Chem., Vol. 68. No. 10, 1964, p. 932. [5] M. Kusakabe, Y. Shirakawa, S. Tamaki and Y. Ito, “The Transport Properties of Cations in the Superionic Phase of AgxCu1−xI,” Journal of the Physical Society of Japan, Vol. 64, No. 01, 1995, pp. 170-176. [6] A. Goldmann, “Band Structure and Optical Properties of Tetrahedrally Coordinated Cu- and Ag-Halides,” Physica Status Solidi (B), Vol. 81, No 1, 1977, pp. 9-47. [7] W. Sekkal, A. Laref and H. Aourag, A. Zaoui and M. Certier, “The miscibility of CuxAg1−xI Using a Tersoff Potential,” Superlattice and Microstructures, Vol. 28, No. 1, 2000, pp. 55-66. doi:10.1006/spmi.1999.0782 [8] B. Jarosław and R. Jarosław, “Cation Diffusion Coeffi- cients in CuAgI via Molecular Dynamics Simulations,” Solid State Ionics, Vol. 157, No. 1-4, 2003, pp. 227-232. doi:10.1016/S0167-2738(02)00214-X [9] A. Zunger, S.-H. Wei, L. G. Ferreira and J. E. Bernard, “Special Quasirandom Structures,” Physical Review Let- ters, Vol. 65, No. 3, 1990, pp. 353-356. doi:10.1103/PhysRevLett.65.353 [10] S. Savrasov and D. Savrasov, “Full-Potential Linear- Muffin-Tin-Orbital Method for Calculating Total Ener- gies and Forces,” Physical Review B, Vol. 46, No. 19, 1992, pp. 12181-12195. doi:10.1103/PhysRevB.46.12181 [11] S. Y. Savrasov, “Linear-Response Theory and Lattice Dynamics: A Muffin-Tin-Orbital Approach,” Physical Review B, Vol. 54, No. 23, 1996, pp. 16470-16486. doi:10.1103/PhysRevB.54.16470 [12] P. Hohenberg and W. Kohn, “Inhomogeneous Electron Gas,” Physical Review, Vol. 136, No. 3B, 1964, pp. B864 -B871. [13] W. Kohn and L. J. Sham, “Self-Consistent Equations Including Exchange and Correlation Effects,” Physical Review A, Vol. 140 , No. 4A, 1965, pp. A1133- A1138. doi:10.1103/PhysRev.140.A1133 [14] S. Y. Savrasov, “Program LMTART for electronic struc- ture calculations,” Zeitschrift für Kristallogr, Vol. 220, 2005, pp. 555-557. [15] J. P. Perdew and Y. Wang, “Accurate and Simple Ana- lytic Representation of the Electron-Gas Correlation En- ergy,” Physical Review A, Vol. 45, No. 13, 1992, pp. 13244-13249. doi:10.1103/PhysRevB.45.13244 [16] J. P. Perdew, S. Burke and M. Ernzerhof, “Generalized Gradient Approximation Made Simple,” Physical Review Letters, Vol. 77, No.18, 1996, pp. 3865-3868. doi:10.1103/PhysRevLett.77.3865 [17] P. Blochl, O. Jepsen and O. K. Andersen, “Improved Tetrahedron Method for Brillouin-Zone Integrations,” Physical Review B, Vol. 49, No. 23, 1994, pp. 16223- 16233. doi:10.1103/PhysRevB.49.16223 [18] F. D. Murnaghan, “The Compressibility of Media under Extreme Pressures,” Proceedings of the National Acad- emy of Sciences USA, Vol. 30, 1944, pp. 244-247. doi:10.1073/pnas.30.9.244 [19] L. Vegard, “Formation of Mixed Crystals by Solid-Phase Contact,” Zeitschrift für Phys, Vol. 5, No. 5, 1921, pp. 393-395. [20] B. Jobst, D. Hommel, U. Lunz, T. Gerharda and G. Landwehr, “E0 Band-Gap Energy and Lattice Constant of Ternary Zn1−xMgxSe as Functions of Composition,” Ap- plied Physics Letters, Vol. 69, No. 1, 1996, pp. 97-100. doi:10.1063/1.118132 [21] F. El Haj Hassan and H. Akdarzadeh, “First-Principles Investigation of BNxP1−x, BNxAs1−x and BPxAs1−x Ternary Alloys,” Materials Science and Engineering, Vol. 121, 2005, pp. 171-178. [22] B. Amrani, F. El Haj Hassan, R. Khenata and H. Akbar- zadeh, “Theoretical Study of CuxAg1−xI Alloys,” Journal of Physics and Chemistry of Solids, Vol. 70, No. 7, 2009, pp. 1055-1061. doi:10.1016/j.jpcs.2009.05.003 [23] S. N. Rashkeev and W. R. L. Lambrecht, “Second-Har- monic Generation of I-III-VI2 Chalcopyrite Semiconduc- tors: Effects of Chemical Substitutions,” Physical Review B, Vol. 63, No. 16, 2001, pp. 165212-165224. doi:10.1103/PhysRevB.63.165212 [24] G. Onida, L. Reining, and A. Rubio, “Electronic Excita- tions: Density-Functional versus Many-Body Green’s- Function Approaches,” Reviews of Modern Physics, Vol. 74, 2002, pp. 601-659. doi:10.1103/RevModPhys.74.601 [25] J. E. Bernard and A. Zunger, “Optical Bowing in Zinc Chalcogenide Semiconductor Alloys,” Physical Review B, Vol. 34 , No. 8, 1986, pp. 5992-5995. doi:10.1103/PhysRevB.34.5992 [26] H. Baaziz, Z. Charifi, F. El Haj Hassan, S. J. Hashemifar, and H. Akbarzadeh, “FP-LAPW Investigations of Zn1–xBexS, Zn1–xBexSe and Zn1–xBexTe Ternary Alloys,” Physica Status Solidi (B), Vol. 243, No. 6, 2006, pp. 1296-1305. Copyright © 2011 SciRes. MSA  FP-LMTO Investigation of the Structural and Electronic Properties of CuxAg1–xI Alloys Copyright © 2011 SciRes. MSA 757 [27] A. Mokhtari and H. Akbarzadeh, “Ab Initio Calculations of the Electronic and Structural Properties of Beryllium-, Magnesium- and Calcium-Nitrides,” Physica B, Vol. 337, 2003, pp. 122-129. doi:10.1016/S0921-4526(03)00387-9 [28] A. Bouhemadou, R. Khenata, F. Zegrar, M. Sahnoun, H. Baltache and A. H. Reshak, “Ab Initio Study of Structural, Electronic, Elastic and High Pressure Properties of Bar- ium Chalcogenides,” Computational Materials Science, Vol. 38, No. 2, 2006, pp. 263-270. doi:10.1016/j.commatsci.2006.03.001 [29] S. Hull and D. A. Keen, “Pressure-Induced Phase Transi- tions in AgCl, AgBr, and AgI,” Physical Review B, Vol. 59, No. 2, 1999, pp. 750-761. doi:10.1103/PhysRevB.59.750 [30] S. Hull and D.A. Keen, “High-Pressure Polymorphism of the Copper(I) Halides: A Neutron-Diffraction Study to ∼ 10 GPa,” Physical Review B, Vol. 50, No. 9, 1994, pp. 5868-5885. doi:10.1103/PhysRevB.50.5868 [31] L.A. Palomino-Rojas, M. Lo´pez-Fuentes, G. H. Co- coletzi, G. Murrieta, R. de Coss and N. Takeuchi, “Den- sity Functional Study of the Structural Properties of Sil- ver Halides: LDA vs GGA Calculations,” Solid State Sci- ences, Vol. 10, No. 9, pp. 1228-1235. doi:10.1016/j.solidstatesciences.2007.11.022 [32] T. Söhnel, H. Hermann and P. Schwerdtfeger, “Solid State Density Functional Calculations for the Group 11 Monohalides,” Journal of Physical Chemistry B, Vol. 109, No. 1, 2005, pp. 526-531. [33] T. Ida, M. Mizuno, K. Endo, M. Suhara, K. Nishidate and K. Nishikawa, “Dynamical Structure of Alpha-Ag_{0.99} Cu_{0.01}I Crystal by ^{63}Cu NMR Chemical Shift, Spin-Lattice Relaxation Time and Molecular Dyanmics Simulation,” Journal of Physics and Chemistry of Solids, Vol. 63, 2002, pp. 249-256. doi:10.1016/S0022-3697(01)00137-8 [34] B. Amrani, T. Benmessabih, M. Tahiri, I. Chiboub, S. Hiadsi and F. Hamdache, “First Principles Study of Structural, Elastic, Electronic and Optical Properties of CuCl, CuBr and CuI Compounds under Hydrostatic Pressure,” Physica B, Vol. 381, 2006, pp. 179-186. doi:10.1016/j.physb.2006.01.447 [35] F. El Haj Hassan, A. Zaoui and W. Sekkal, “Structural Properties of Copper Halides,” Materials Science and Engineering: B, Vol. 87, 2001, pp. 40-47. doi:10.1016/S0921-5107(01)00687-0 [36] R. C. Hanson, T. A. Fjeldly and H. D. Hochheimer, “Ra- man Scattering from Five Phases of Silver Iodide,” Phy- sica Status Solidi (A), Vol. 70, No. 2, 1975, pp. 567-576. doi:10.1002/pssb.2220700216 [37] M. Hofmann, S. Hull and D. A. Keen, “High-Pressure Phase of Copper(I) Iodide,” Physical Review B, Vol. 51, No. 17, 1995, pp. 12022-12025. doi:10.1103/PhysRevB.51.12022 [38] G. S. Nunes, P. B. Allen and J. L. Martin, “Pressure In- duced Phase Transitions in Silver Halides,” Physical Re- view B, Vol. 57, No. 9, 1998, pp. 5098-5105. doi:10.1103/PhysRevB.57.5098 [39] W. Sekkal, A. Zaoui, A. Laref, M. Certier and H. Aourag, “Molecular Dynamics Simulation of CuI using a Three- Body Potential,” Journal of Physics: Condensed Matter, Vol. 12, No. 28, 2000, p. 6173. doi:10.1088/0953-8984/12/28/313 [40] R. H. Victora, “Calculated Electronic Structure of Silver Halide Crystals,” Physical Review B , Vol. 56, No. 8, 1997, pp. 4417-4421. [41] V. P. Krüger and J. Pollmann, “Ab Initio Electronic Structure of Silver Halides Calculated with Self-Interac- tion and Relaxation-Corrected Pseudopotentials,” Physi- cal Review B, Vol. 58, No. 7, 1998, pp. 3865-3869. doi:10.1103/PhysRevB.58.3865 [42] M. Ferhat, A. Zaoui, M. Certier, J. P. Dufour and B. Khe- lifa, “Electronic Structure of the Copper Halides CuCl, CuBr and Cul,” Materials Science and Engineering, Vol. 39, 1996, pp. 95-100. doi:10.1016/0921-5107(95)01518-3 [43] O. Zakharov, A. Rubio, X. Blase, M. L. Cohen and S. G. Louie, “Quasiparticle Band Structures of Six II-VI Com- pounds: ZnS, ZnSe, ZnTe, CdS, CdSe, and CdTe,” Phys- ical Review B, Vol. 50, No. 15, 1994, pp. 10780-10787. doi:10.1103/PhysRevB.50.10780
|