Paper Menu >>
Journal Menu >>
 Energy and Power En gi neering, 2011, 3, 382-391 doi:10.4236/epe.2011.33049 Published Online July 2011 (http://www.SciRP.org/journal/epe) Copyright © 2011 SciRes. EPE Preparation of La0.6Ba0.4Co0.2Fe0.8O3 (LBCF) Nanoceramic Cathode Powders by Sol-Gel Process for Solid Oxide Fuel Cell (SOFC) Application Yousef M. Al-Yousef, Mohammad Ghouse* Energy Research Institute, King Abdulaziz City for Science and Technology (KACST), Riyadh, Saudi Arabia E-mail: *msheikh@kacst.edu.sa, alyousef@kacst.edu.sa Received January 29, 2011; revised March 14, 2011; accepted April 10, 2011 Abstract The La0.6Ba0.4Co0.2Fe0.8O3 (LBCF) nano ceramic powders were prepared by Sol-Gel process using nitrate based chemicals for SOFC applications since these powders are considered to be more promising cathode materials for SOFC. Citric acid was used as a chelant agent and ethylene glycol as a dispersant. The powders were calcined at 650˚C/6 h, 900˚C/3 h in air using Thermolyne 47,900 furnace. These powders were charac- terized by SEM/EDS, XRD and Porosimetry techniques. The SEM images indicate that the particle sizes of the LBCF powders are in the range of 50 - 200 nm. The LBCF perovskite phases are seen from the XRD patterns. From XRD Line broadening technique, the average particle size for the powders (as prepared and calcined at 650˚C/6 h and 900˚C/3 h) were found to be around 12.97 nm, 22.24 nm and 26 nm respectively. The surface area of the LBCF powders for the as prepared and calcined at 650˚C were found to be 28.92 and 19.54 m2/g respectively. Keywords: XRD, SEM/EDS, La0.6Ba0.4Co0.2Fe0.8O3 (LBCF), Porosimetry 1. Introduction The Solid oxide fuel cells (SOFCs) are prominent candi- dates of power generators that covert chemical energy directly and with high efficiency, into electricity while causing little pollution. These power generating systems have attracted a considerable attention because of their environmental friendliness, and fuel flexibility [1,2]. The current status of the development of a cell unit is based on yttria-stabilized zirconia (YSZ) solid electrolyte and electrodes consisting of Sr-doped LaMnO3 (Cathode) and Ni-YSZ cermet (Anode) [3,4]. Among the cathode materials reported (La, Sr) MnO3 (LSM) based perov- skite, due to their stability and high electrocatalytic ac- tivity for oxygen reduction at high temperatures, are the most extensively studied and investigated materials for O2 reduction [5-9]. In spite of significant efforts by vari- ous researchers, fundamental questions on the mecha- nism and kinetics of the O2 reduction reaction and on the electrode behavior of LSM materials under fuel-cell op- eration conditions still remain unsolved. Although LSM has shown promising performance for SOFC operating at temperature around 800˚C, its performance decreases rapidly as the operating temperature decreases [10]. Therefore, considerable research interest is currently di- rected towards cobalt containing perovskite oxides which tends to exhibit mixed-conduction characteristics and relatively higher ionic conductivities than LSM due to a greater concentration of oxygen vacancies [11-13]. Re- cently, several new compositions that show mixed ionic and electronic conductivity (MIEC) have been developed as promising SOFC cathodes [14-17]. Amongst these, the perovskite based compounds having the general for- mula La1–xSrxM1–yCyO3, where 0 ≤ x ≤ 0.5 and 0 ≤ y ≤ 0.8 (M is a transitional metal Mn or Fe) has found wide attention because of their superior MIEC behavior [15,16] as well as enhanced oxygen reduction reactions (ORR) kinetics [17-19]. Most recently Ba0.5Sr0.5Co0.8Fe0.2O3 (BSCF) oxide has been found to exhibit excellent activity as a new cathode material as reported in [20].Therefore replacing Sr with Ba in LSCF would reduce Cr deposition according to the proposed strategy [21,22] and to maintain high electro- catalytic activity for O2 reduction reaction. Several re- searchers have reported different techniques [23-24] for preparing La0.6Ba0.4Co0.2Fe0.8O3 (LBCF) materials for  Y. M. AL-YOUSEF ET AL. 383 SOFC cathode materials due to their attractive properties. Table 1 shows the suitable materials for SOFC compo- nents [25]. The main design requirements for SOFC cathode ma- terials [26] include: 1) High electronic conductivity; 2) Chemically compatible with neighboring cell compo- nents (electrolyte); 3) Stable in oxidizing environment; 4) Large triple phase boundary; 5) High ionic conductivity; 6) Thermal expansion coefficient similar to other SOFC materials; 7) Relative simple fabrication; 8) Relatively inexpensive materials. In this paper, nanocrystalline LBCF powders for cathode material were prepared by the Sol-Gel process since it is a simple and more economical way of making nanopowders. The powders were characterized using SEM/EDS, XRD, porosimetry techniques. 2. Experimental Procedure 2.1. Preparation of LBCF Powders The La0.6Ba0.4Co0.2Fe0.8O3 (LBCF) nanoceramic powders were prepared by modified Sol-Gel Process [27-29] us- ing La(NO3)3 6H2O (BDH), Ba(NO3)2(BDH), Co(NO)3. 9H2O (Fluka), Fe(NO3)39H2O, citric acid (BDH) ethy- lene glycol (BDH), ammonia solution and distilled water. The precursor solution was prepared by mixing indi- vidual aqueous solutions of the above chemicals in a molar ratio of 0.6:0.4 and 0.2:0.8 respectively. To the mixed all nitrate solutions, required citric acid, ammonia solution and ethylene glycol were added. The citrate/ nitrate (c/n) ratio used in the present experiments was 0.5. The solution was heated in a pyrex glass beaker on a hotplate using magnetic stirrer until a chocolate colored gel was formed. When heated further, the gel burns to a light fragile ash. The ash was calcined at 650˚C/6 h, and 900oC/3h in air in a Barnstead Thermolyne 47900 Fur- nace (USA). Figure 1 shows the flow Sheet for the preparation of La0.6Ba0.4Co0.2Fe0.8O3 powder using the Sol-Gel process. Table 2 shows cathode materials pre- pared by the Sol-Gel process. 2.2. SEM/EDS Characterization Small amounts of the samples were spread on adhesive conductive aluminum tapes attached to sample holders, coated with thin films of gold and examined with a FEI Quanta 200 Scanning Electron Microscope. An attached OXFORD INCA250 Energy Dispersive Spectroscopy (EDS) unit was used to determine the area and spot ele- mental compositions. Images at higher magnification were collected with a FEI Quanta 3DF SEM. Imaging was performed in Secondary Electron (SEI) mode only using an accelerating voltage of 20 keV. 2.3. XRD Characterization A part of the samples were analyzed with a PANnytical X’Pert PRO XRD for phase characterization. The X-ray diffractometry with CuK radiation at 35 KV and 20 mA was used for phase analysis with a diffraction angle 2 theta range 10˚ - 80˚ and particle size determination from X-ray line broadening technique using the following Debye Scherrer Equation [30]: t = 0.9λ/B cos Ø where t = average particle size in nm, λ = the wave length (0.15418 nm) of Cu Kα radiation, B the width (in radian) of the XRD diffraction peak at half of its maxi- mum intensity (FWHM), and Ø the Bragg diffraction angle of the line, and B is the line width at half peak in- tensity. 2.4. Porosimetry Characterization 2.4.1. Particle Size Distribution Particle size distribution analysis was done using particle size analyzer Mastersizer 2000 manufactured by Malvern Instruments UK. This instrument works on the basis of laser diffraction and is equipped with Hydro 2000S li- quid feeder with a capacity of 50 to 120 ml. The feeder has a built-in ultrasound probe with an inline pump and stirrer. The instrument is capable to measure particle size Table 1. Suitable materials for SOFC components [25]. Component Requirements Preferred Materials Possible Alternatives Electrolyte i > 0.05 S·cm−1 ZrO2-Y2O3 (3 - 10 mol%) ZrO2-Sc2O3, CeO2-Gd2O3, (Sm2O3) Cathode >100 S·cm−1 (electronic/mixed) La1–xSrx MnO3 (La1–x Srx)Co, FeO3 Anode >100 S·cm−1 (electronic/ mixed) Ni/ZrO2-Y2O3 Ru/ZrO2-Y2O3 Ni/CeO2-ZrO2-M2O3 cermets Interconnect Inert material, high temperature stabilityHigh temp. alloys La1–x (Sr ,Ca, Mg)xCrO3- Manifold Non-volatile, inert Ceramics, metals - Seal Non-volatile, inert Glass, glass-ceramic, Metal/ceramic - C opyright © 2011 SciRes. EPE 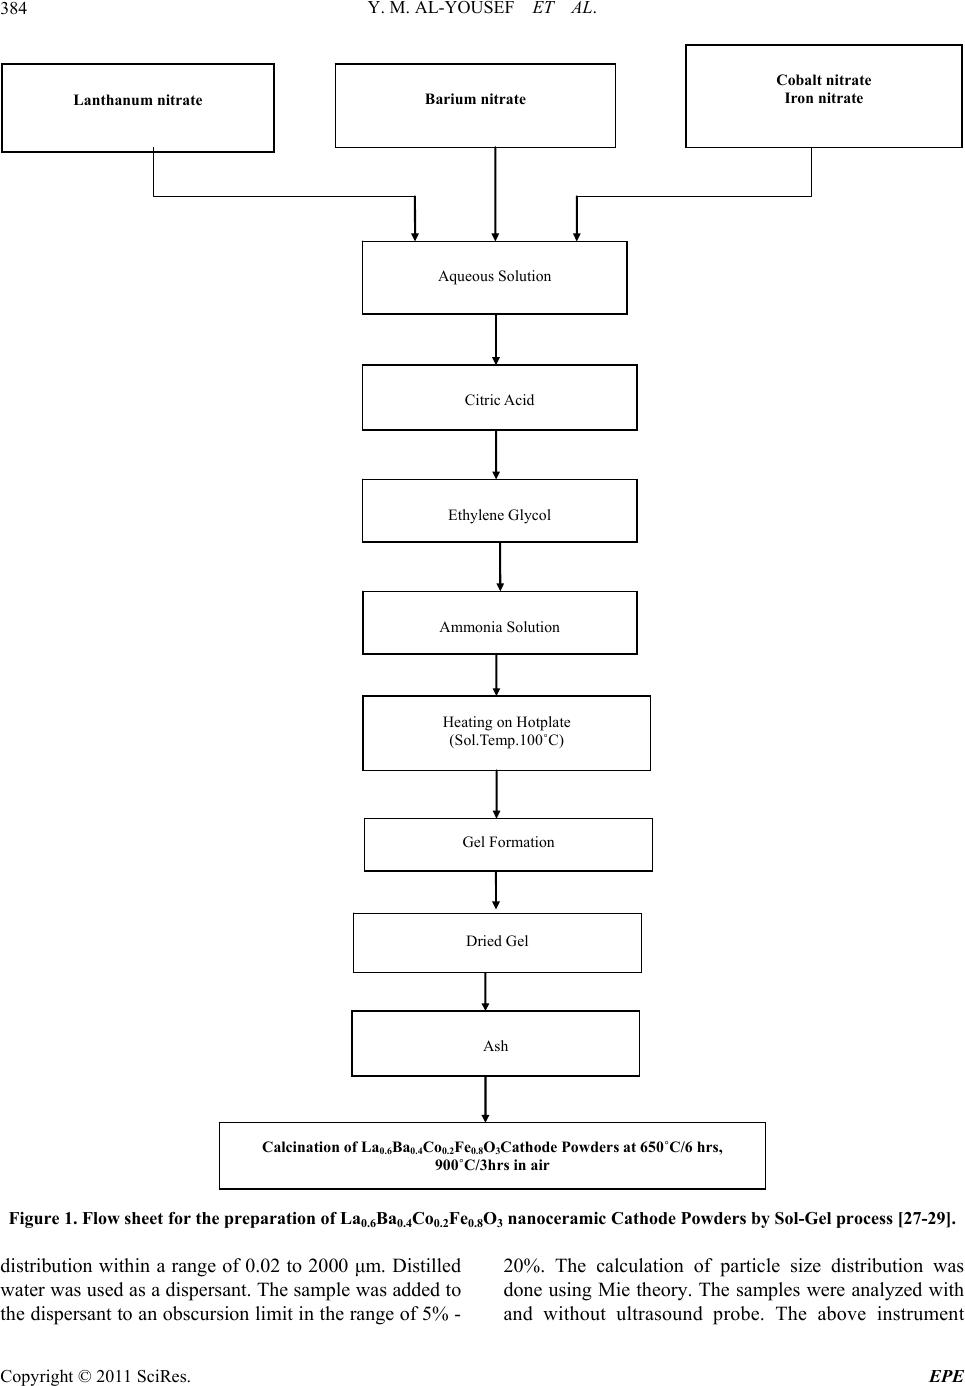 Y. M. AL-YOUSEF ET AL. 384 Lanthanum nitrate Barium nitrate Cobalt nitrate Iron nitrate Aqueous Solution Citric Acid Ethylene Glycol Ammonia Solution Heating on Hotplate (Sol.Temp.100˚C) Ash Calcination of La 0.6 Ba 0.4 Co 0.2 Fe 0.8 O 3 Cathode Powders at 650˚C/6 hrs, 900˚C/3hrs in air Dried Gel Gel Formation Figure 1. Flow sheet for the preparation of La0.6Ba0.4Co0.2Fe0.8O3 nanoceramic Cathode Powders by Sol-Gel process [27-29]. distribution within a range of 0.02 to 2000 μm. Distilled water was used as a dispersant. The sample was added to the dispersant to an obscursion limit in the range of 5% - 20%. The calculation of particle size distribution was done using Mie theory. The samples were analyzed with and without ultrasound probe. The above instrument Copyright © 2011 SciRes. EPE 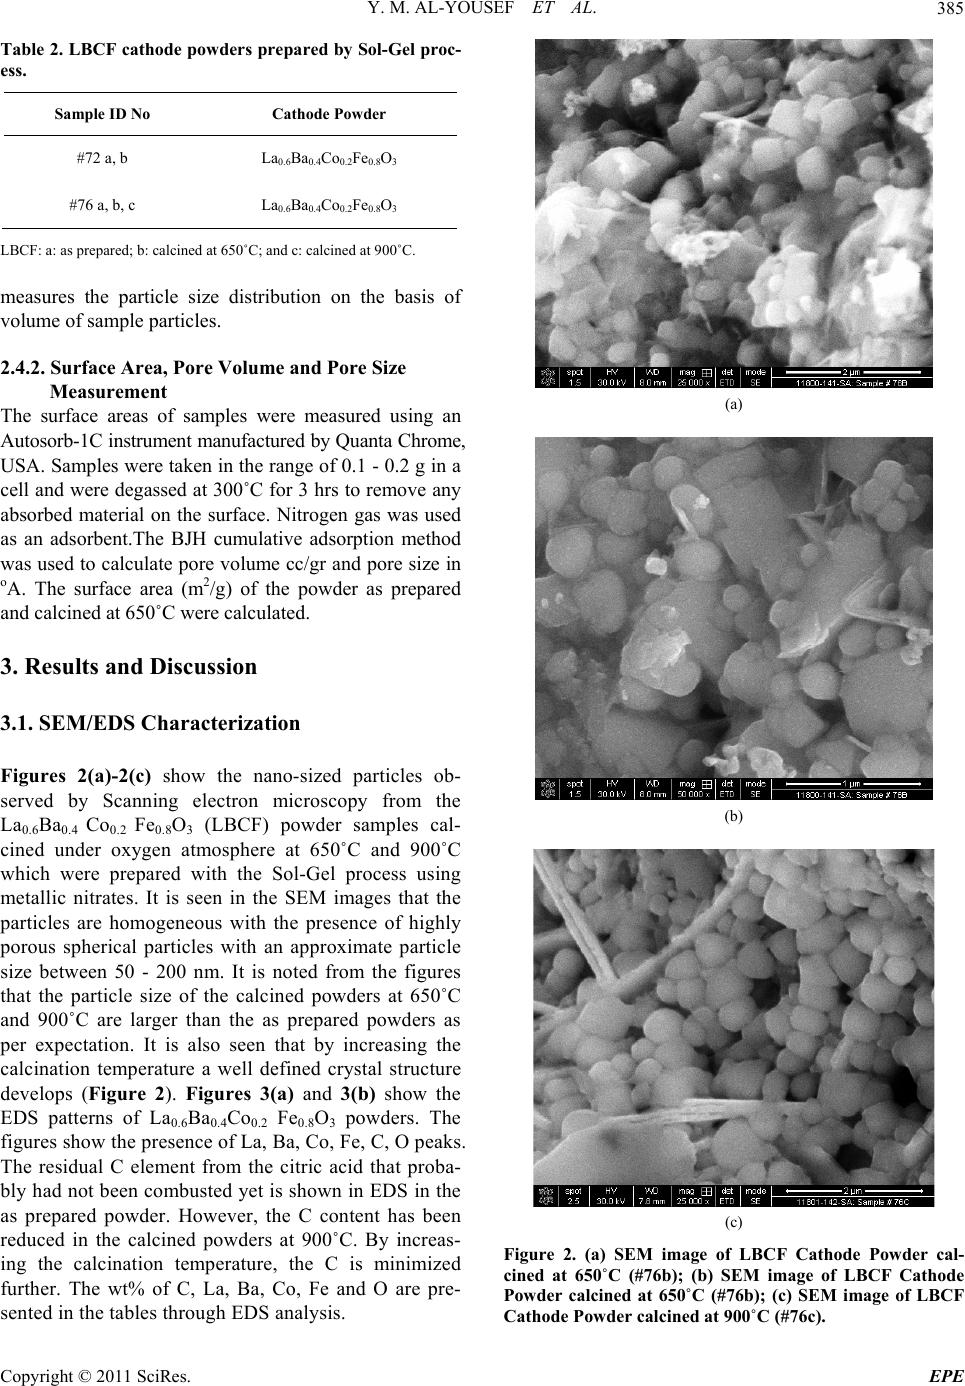 Y. M. AL-YOUSEF ET AL. 385 Table 2. LBCF cathode powders prepared by Sol-Gel proc- ess. Sample ID No Cathode Powder #72 a, b La0.6Ba0.4Co0.2Fe0.8O3 #76 a, b, c La0.6Ba0.4Co0.2Fe0.8O3 LBCF: a: as prepared; b: calcined at 650˚C; and c: calcined at 900˚C. measures the particle size distribution on the basis of volume of sample particles. 2.4.2. Surface Area, Pore Volume and Pore Size Measurement The surface areas of samples were measured using an Autosorb-1C instrument manufactured by Quanta Chrome, USA. Samples were taken in the range of 0.1 - 0.2 g in a cell and were degassed at 300˚C for 3 hrs to remove any absorbed material on the surface. Nitrogen gas was used as an adsorbent.The BJH cumulative adsorption method was used to calculate pore volume cc/gr and pore size in oA. The surface area (m2/g) of the powder as prepared and calcined at 650˚C were calculated. 3. Results and Discussion 3.1. SEM/EDS Characterization Figures 2(a)-2(c) show the nano-sized particles ob- served by Scanning electron microscopy from the La0.6Ba0.4 Co0.2 Fe0.8O3 (LBCF) powder samples cal- cined under oxygen atmosphere at 650˚C and 900˚C which were prepared with the Sol-Gel process using metallic nitrates. It is seen in the SEM images that the particles are homogeneous with the presence of highly porous spherical particles with an approximate particle size between 50 - 200 nm. It is noted from the figures that the particle size of the calcined powders at 650˚C and 900˚C are larger than the as prepared powders as per expectation. It is also seen that by increasing the calcination temperature a well defined crystal structure develops (Figure 2). Figures 3(a) and 3(b) show the EDS patterns of La0.6Ba0.4Co0.2 Fe0.8O3 powders. The figures show the presence of La, Ba, Co, Fe, C, O peaks. The residual C element from the citric acid that proba- bly had not been combusted yet is shown in EDS in the as prepared powder. However, the C content has been reduced in the calcined powders at 900˚C. By increas- ing the calcination temperature, the C is minimized further. The wt% of C, La, Ba, Co, Fe and O are pre- sented in the tables through EDS analysis. (a) (b) (c) Figure 2. (a) SEM image of LBCF Cathode Powder cal- cined at 650˚C (#76b); (b) SEM image of LBCF Cathode Powder calcined at 650˚C (#76b); (c) SEM image of LBCF athode Powder calcined at 900˚C (#76c). C C opyright © 2011 SciRes. EPE 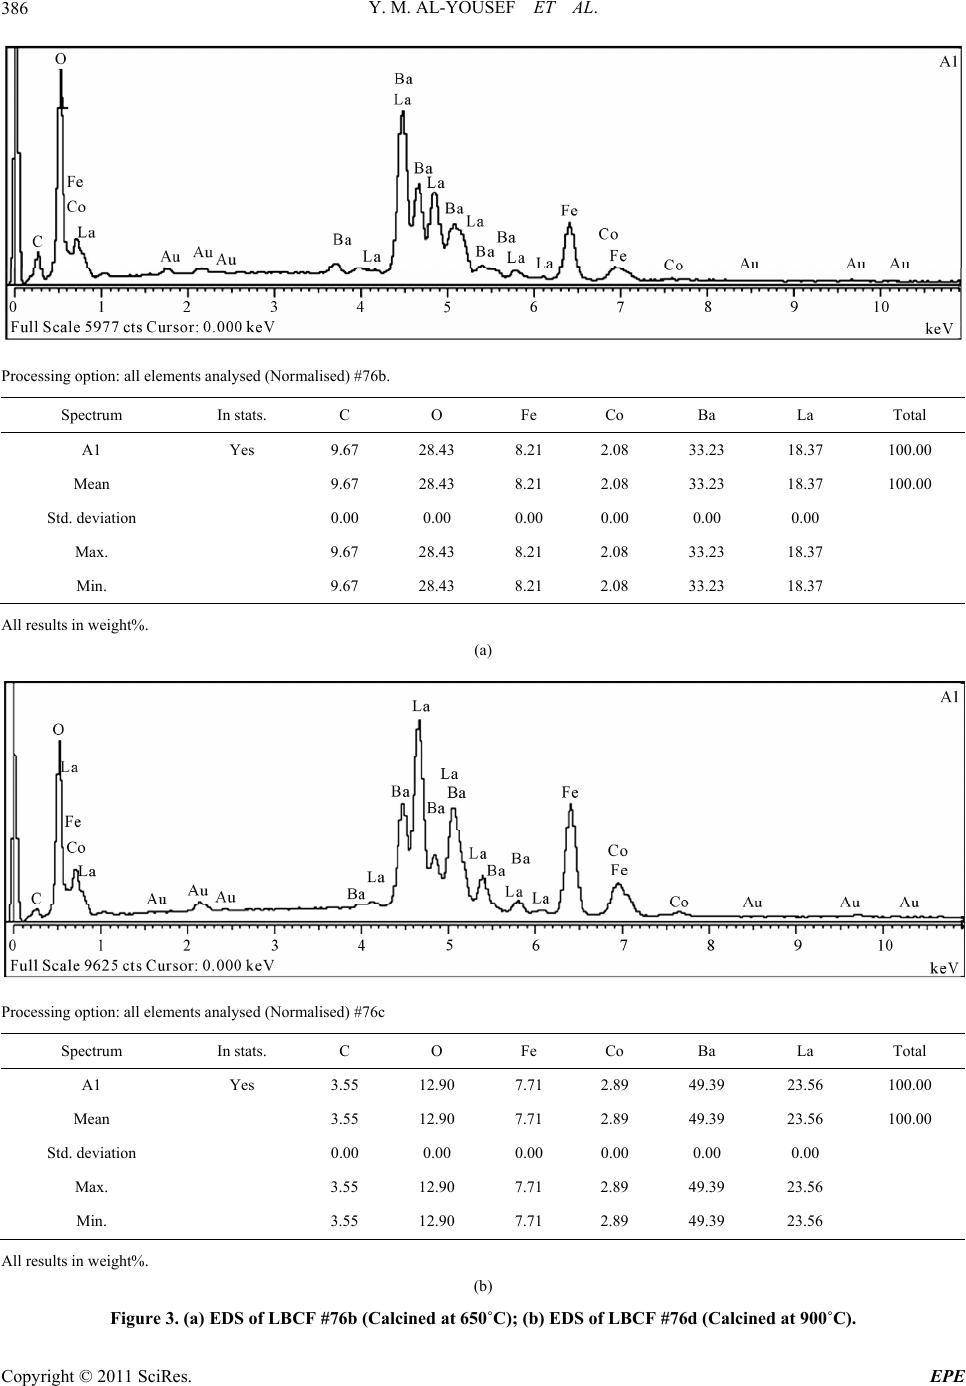 Y. M. AL-YOUSEF ET AL. Copyright © 2011 SciRes. EPE 386 Processing option: all elements analysed (Normalised) #76b. Spectrum In stats. C O Fe Co Ba La Total A1 Yes 9.67 28.43 8.21 2.08 33.23 18.37 100.00 Mean 9.67 28.43 8.21 2.08 33.23 18.37 100.00 Std. deviation 0.00 0.00 0.00 0.00 0.00 0.00 Max. 9.67 28.43 8.21 2.08 33.23 18.37 Min. 9.67 28.43 8.21 2.08 33.23 18.37 All results in weight%. (a) Processing option: all elements analysed (Normalised) #76c Spectrum In stats. C O Fe Co Ba La Total A1 Yes 3.55 12.90 7.71 2.89 49.39 23.56 100.00 Mean 3.55 12.90 7.71 2.89 49.39 23.56 100.00 Std. deviation 0.00 0.00 0.00 0.00 0.00 0.00 Max. 3.55 12.90 7.71 2.89 49.39 23.56 Min. 3.55 12.90 7.71 2.89 49.39 23.56 All results in weight%. (b) Figure 3. (a) EDS of LBCF #76b (Calcined at 650˚C); (b) EDS of LBCF #76d (Calcined at 900˚C). 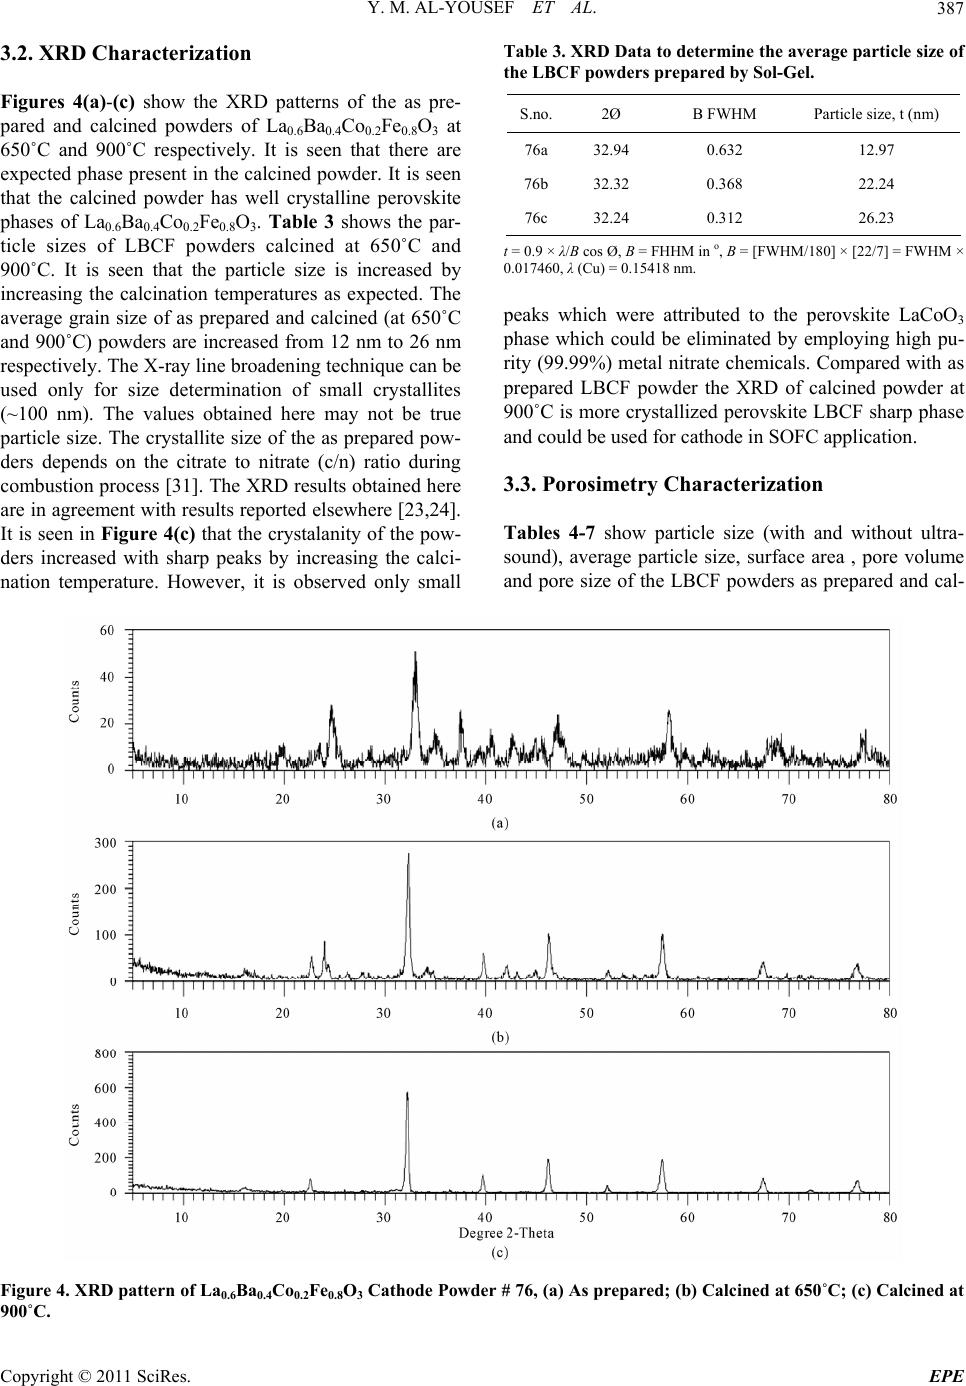 Y. M. AL-YOUSEF ET AL. C opyright © 2011 SciRes. EPE 387 3.2. XRD Characterization Figures 4(a)-(c) show the XRD patterns of the as pre- pared and calcined powders of La0.6Ba0.4Co0.2Fe0.8O3 at 650˚C and 900˚C respectively. It is seen that there are expected phase present in the calcined powder. It is seen that the calcined powder has well crystalline perovskite phases of La0.6Ba0.4Co0.2Fe0.8O3. Table 3 shows the par- ticle sizes of LBCF powders calcined at 650˚C and 900˚C. It is seen that the particle size is increased by increasing the calcination temperatures as expected. The average grain size of as prepared and calcined (at 650˚C and 900˚C) powders are increased from 12 nm to 26 nm respectively. The X-ray line broadening technique can be used only for size determination of small crystallites (~100 nm). The values obtained here may not be true particle size. The crystallite size of the as prepared pow- ders depends on the citrate to nitrate (c/n) ratio during combustion process [31]. The XRD results obtained here are in agreement with results reported elsewhere [23,24]. It is seen in Figure 4(c) that the crystalanity of the pow- ders increased with sharp peaks by increasing the calci- nation temperature. However, it is observed only small Table 3. XRD Data to determine the average particle size of the LBCF powders prepared by Sol-Gel. S.no.2Ø B FWHM Particle size, t (nm) 76a 32.94 0.632 12.97 76b 32.32 0.368 22.24 76c 32.24 0.312 26.23 t = 0.9 × λ/B cos Ø, B = FHHM in o, B = [FWHM/180] × [22/7] = FWHM × 0.017460, λ (Cu) = 0.15418 nm. peaks which were attributed to the perovskite LaCoO3 phase which could be eliminated by employing high pu- rity (99.99%) metal nitrate chemicals. Compared with as prepared LBCF powder the XRD of calcined powder at 900˚C is more crystallized perovskite LBCF sharp phase and could be used for cathode in SOFC application. 3.3. Porosimetry Characterization Tables 4-7 show particle size (with and without ultra- sound), average particle size, surface area , pore volume and pore size of the LBCF powders as prepared and cal- Figure 4. XRD pattern of La0.6Ba0.4Co0.2Fe0.8O3 Cathode Powder # 76, (a) As prepared; (b) Calcined at 650˚C; (c) Calcined at 00˚C. 9 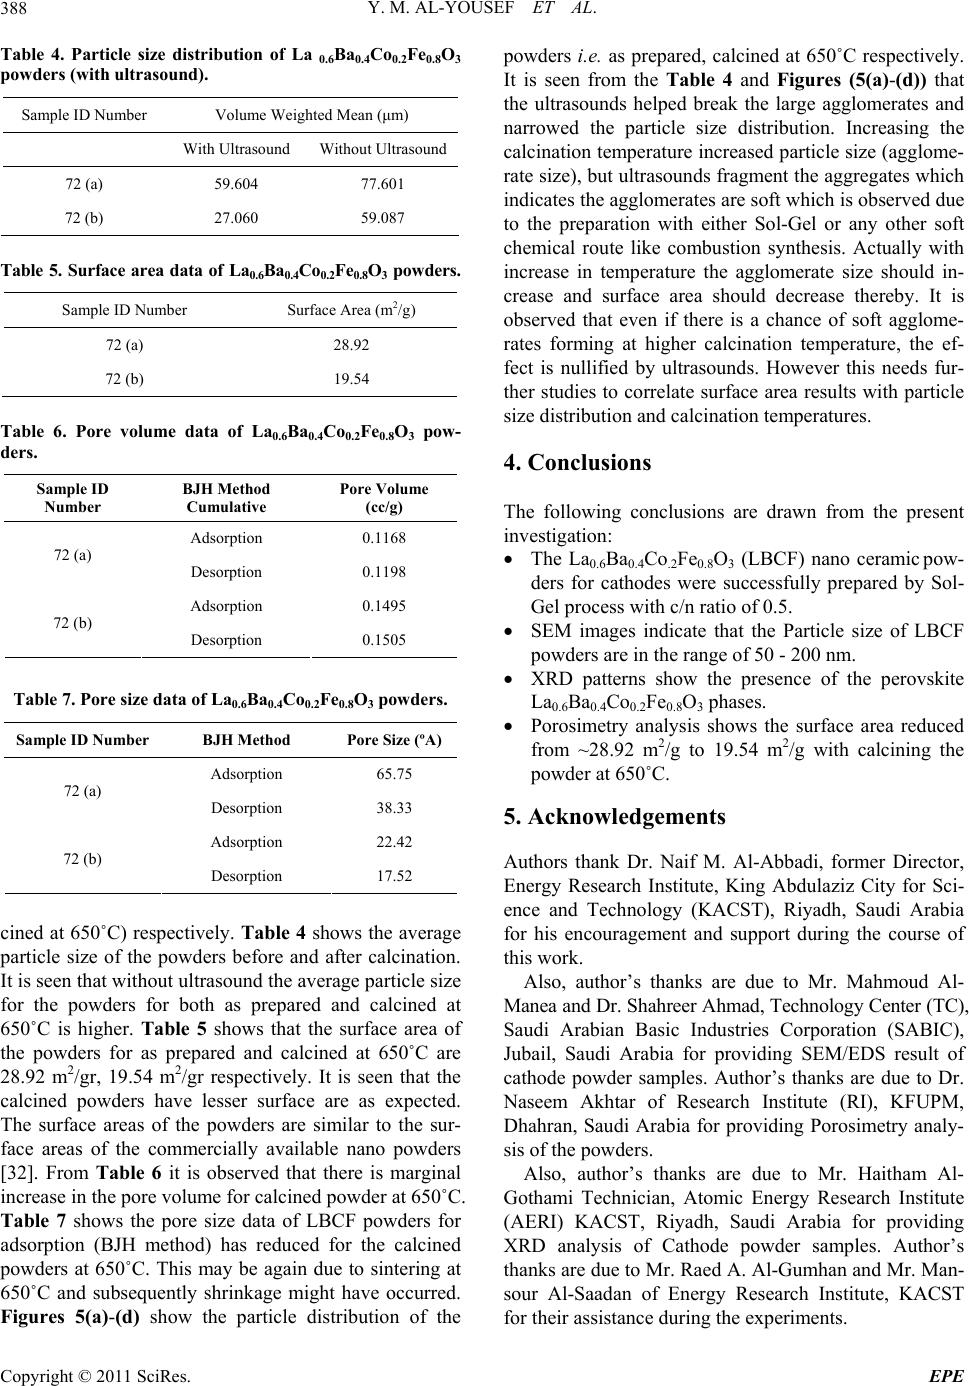 Y. M. AL-YOUSEF ET AL. Copyright © 2011 SciRes. EPE 388 Table 4. Particle size distribution of La 0.6Ba0.4Co0.2Fe0.8O3 powders (with ultrasound). Sample ID Number Volume Weighted Mean (μm) With Ultrasound Without Ultrasound 72 (a) 59.604 77.601 72 (b) 27.060 59.087 Table 5. Surface area data of La0.6Ba0.4Co0.2Fe0.8O3 powders. Sample ID Number Surface Area (m2/g) 72 (a) 28.92 72 (b) 19.54 Table 6. Pore volume data of La0.6Ba0.4Co0.2Fe0.8O3 pow- ders. Sample ID Number BJH Method Cumulative Pore Volume (cc/g) Adsorption 0.1168 72 (a) Desorption 0.1198 Adsorption 0.1495 72 (b) Desorption 0.1505 Table 7. Pore size data of La0.6Ba0.4Co0.2Fe0.8O3 powders. Sample ID Number BJH Method Pore Size (ºA) Adsorption 65.75 72 (a) Desorption 38.33 Adsorption 22.42 72 (b) Desorption 17.52 cined at 650˚C) respectively. Table 4 shows the average particle size of the powders before and after calcination. It is seen that without ultrasound the average particle size for the powders for both as prepared and calcined at 650˚C is higher. Table 5 shows that the surface area of the powders for as prepared and calcined at 650˚C are 28.92 m2/gr, 19.54 m2/gr respectively. It is seen that the calcined powders have lesser surface are as expected. The surface areas of the powders are similar to the sur- face areas of the commercially available nano powders [32]. From Table 6 it is observed that there is marginal increase in the pore volume for calcined powder at 650˚C. Table 7 shows the pore size data of LBCF powders for adsorption (BJH method) has reduced for the calcined powders at 650˚C. This may be again due to sintering at 650˚C and subsequently shrinkage might have occurred. Figures 5(a)-(d) show the particle distribution of the powders i.e. as prepared, calcined at 650˚C respectively. It is seen from the Table 4 and Figures (5(a)-(d)) that the ultrasounds helped break the large agglomerates and narrowed the particle size distribution. Increasing the calcination temperature increased particle size (agglome- rate size), but ultrasounds fragment the aggregates which indicates the agglomerates are soft which is observed due to the preparation with either Sol-Gel or any other soft chemical route like combustion synthesis. Actually with increase in temperature the agglomerate size should in- crease and surface area should decrease thereby. It is observed that even if there is a chance of soft agglome- rates forming at higher calcination temperature, the ef- fect is nullified by ultrasounds. However this needs fur- ther studies to correlate surface area results with particle size distribution and calcination temperatures. 4. Conclusions The following conclusions are drawn from the present investigation: The La0.6Ba0.4Co.2Fe0.8O3 (LBCF) nano ceramic pow- ders for cathodes were successfully prepared by Sol- Gel process with c/n ratio of 0.5. SEM images indicate that the Particle size of LBCF powders are in the range of 50 - 200 nm. XRD patterns show the presence of the perovskite La0.6Ba0.4Co0.2Fe0.8O3 phases. Porosimetry analysis shows the surface area reduced from ~28.92 m2/g to 19.54 m2/g with calcining the powder at 650˚C. 5. Acknowledgements Authors thank Dr. Naif M. Al-Abbadi, former Director, Energy Research Institute, King Abdulaziz City for Sci- ence and Technology (KACST), Riyadh, Saudi Arabia for his encouragement and support during the course of this work. Also, author’s thanks are due to Mr. Mahmoud Al- Manea and Dr. Shahreer Ahmad, Technology Center (TC), Saudi Arabian Basic Industries Corporation (SABIC), Jubail, Saudi Arabia for providing SEM/EDS result of cathode powder samples. Author’s thanks are due to Dr. Naseem Akhtar of Research Institute (RI), KFUPM, Dhahran, Saudi Arabia for providing Porosimetry analy- sis of the powders. Also, author’s thanks are due to Mr. Haitham Al- Gothami Technician, Atomic Energy Research Institute (AERI) KACST, Riyadh, Saudi Arabia for providing XRD analysis of Cathode powder samples. Author’s thanks are due to Mr. Raed A. Al-Gumhan and Mr. Man- sour Al-Saadan of Energy Research Institute, KACST for their assistance during the experiments. 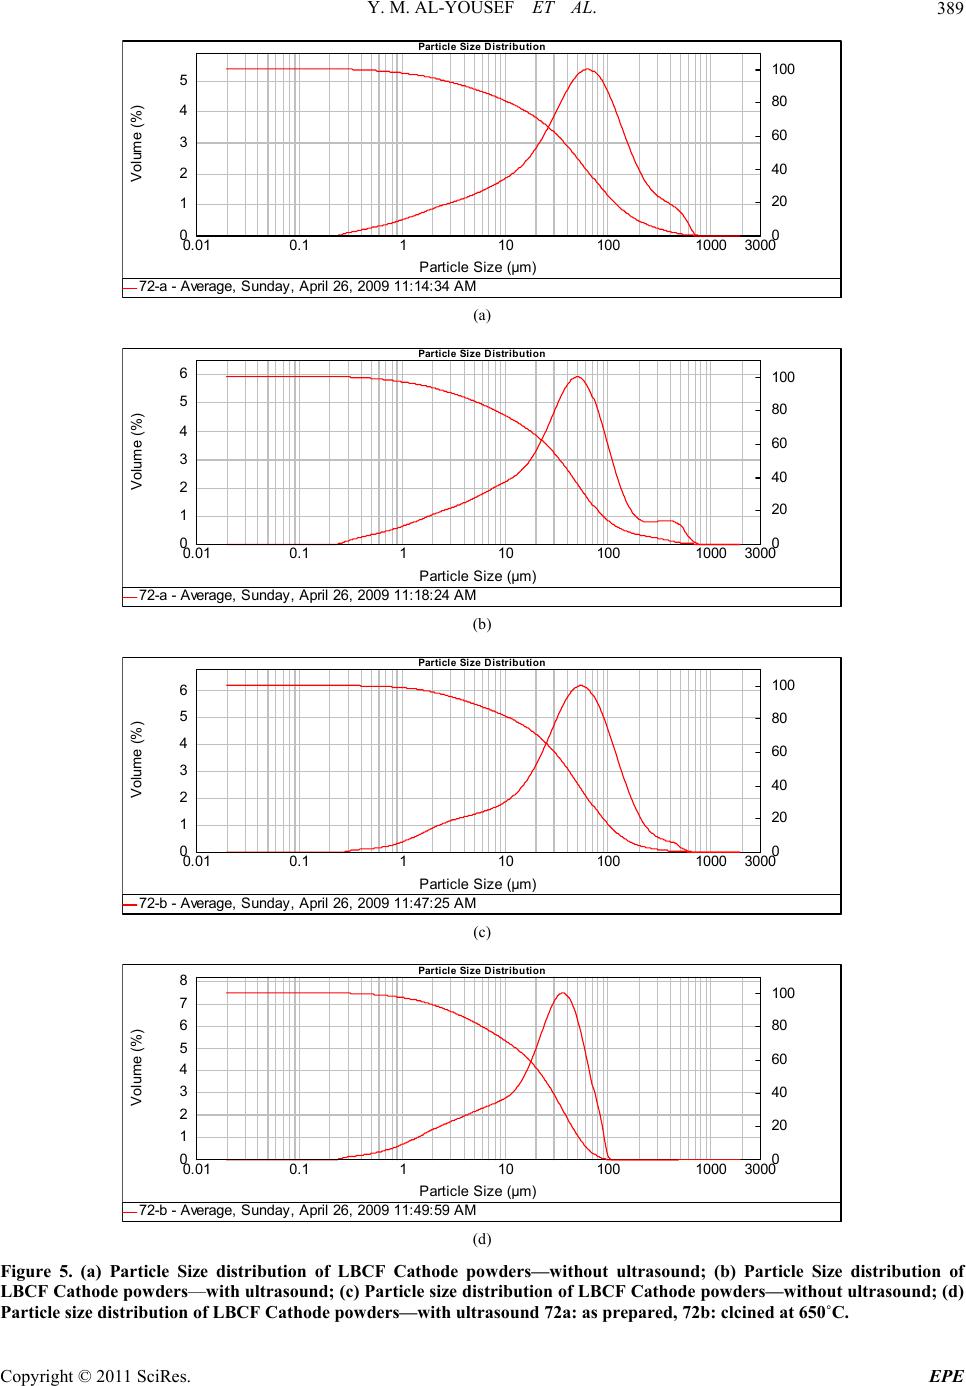 Y. M. AL-YOUSEF ET AL. 389 Particle Size Distribution 0. 0 1 0.1 1 10 100 1000 3000 Particle Size (µm) 0 1 2 3 4 5 Volume (%) 72-a - A verage, S und ay, A pri l 26, 2 009 11:1 4:34 A M 0 20 40 60 80 100 (a) Particle Size Distribution 0. 0 1 0. 1 1 10 100 1000 3000 Particle Size (µm) 0 1 2 3 4 5 6 Volume (%) 72-a - A verage, S und ay, A pri l 26, 2 009 11:18: 24 A M 0 20 40 60 80 100 (b) Particle Size Distribution 0. 0 1 0.1 1 10 100 1000 3000 Particle Size (µm) 0 1 2 3 4 5 6 Volume (%) 72-b - A verage, S und ay, A pri l 26, 2 009 11:4 7:25 A M 0 20 40 60 80 100 (c) Particle Size Distribution 0. 0 1 0.1 1 10 100 1000 3000 Particle Size (µm) 0 1 2 3 4 5 6 7 8 Volume (%) 72-b - A verage, S und ay, A pri l 26, 2 009 11:4 9:59 A M 0 20 40 60 80 100 (d) Figure 5. (a) Particle Size distribution of LBCF Cathode powders—without ultrasound; (b) Particle Size distribution of LBCF Cathode powders—with ultrasound; (c) Particle size distribution of LBCF Cathode powders—w ithout ultrasound; (d) article size distribution of LBCF Cathode powders—with ultrasound 72a: as prepared, 72b: clcined at 650˚C. P C opyright © 2011 SciRes. EPE  Y. M. AL-YOUSEF ET AL. Copyright © 2011 SciRes. EPE 390 6. References [1] S. C. Singhal and K. Kendell, “High-Temperature Solid Oxide Fuel Cells: Fundamentals, Design and Applica- tions,” Elsevier Science, Oxford, 2003. [2] T.-L. Wen, D. Wang, M. Chen, H. Z. Zhang, H. Nie and W. Huang, “Material Research for Planar SOFC Stack,” Solid State Ionics, Vol. 148, No. 3-4, 2002, pp. 513-519. doi:10.1016/S0167-2738(02)00098-X [3] N. Sakai, T. Kawada, H. Yokokawa, M. Dokia and T. Iwata, “Sinterability and Electrical Conductivity of Calcium- Doped Lanthanum Chromiyes,” Journal of Materials Science, Vol. 25, No. 10, 1990, pp. 4531-4534. doi:10.1007/BF00581119 [4] N. Sakai, T. Horita, H. Yokokawa, M. Dokiya and T. Kawada, “Oxygen Permeation Measurement of La1–xCa CrO3–σ by Using an Electrochemical Method,” Solid State Ionics, 1996; Vol. 86-88, Part 2, pp. 1273-1278. doi:10.1016/0167-2738(96)00300-1 [5] T. Horita, K. Jamaji, M. Ishikawa, N. Sakai, H. Yokokawa and T. Kawada, “Active Sites Imaging for Oxygen Reduc- tion at La0.9 Sr0.1 MnO3–x /Yttria-Stabilized Zirconia Interface by Secondary-Ion Mass Spectrometry,” Journal of the Electrochemical Society, Vol. 145, No. 9, 1998, pp. 3196-3202. [6] J. Mizusaki, H. Tagawa, K. Naraya and T. Sasamoto, “Electronic Conductivity, Seebeck Coefficient, Defect and Electronic Structure of Nonstoichiometric La1–xSrx MnO3,” Solid State Ionics, Vol. 132, No. 3-4, 2000, pp. 167-180. doi:10.1016/S0167-2738(00)00662-7 [7] S. P. Jiang, J. P. Zhang, Y. Ramaprakash, D. Milosevic and K. Wilshier, “An Investigation of Shelf-Life of Strontium Doped LaMnO3 Materials,” Journal of Materials Science, Vol. 35, No. 11, 2000, pp. 735-741. doi:10.1023/A:1004766212164 [8] S. P. Jiang, J. G. Love, J. P. Zhang, M. Hoang, Y. Ramaprakash and A. E. Hughes, “The Electrochemical Performance of LSM/Zirconia-Yttria Interface as a Function of a-Site Non-stoichiometry and Cathodic Current Treatment,” Solid State Ionics, Vol. 121, No. 1-4, 1999, pp. 1-10. doi:10.1016/S0167-2738(98)00295-1 [9] P. Decorse, G. Caboche and L.-C. Dufour, “A Compara- tive Study of the Surface and Bulk Properties of Lantha- num-Strontium-Manganese Oxides La1−xSrxMnO3±δ as a Function of Sr-Content, Oxygen Potential and Tempera- ture,” Solid State Ionics, Vol. 117, No. 1-2, 1999, pp. 161-169. doi:10.1016/S0167-2738(98)00260-4 [10] Z. Tang, Y. Xie, H. Hawthorne and D. Ghosh, “Sol-Gel Processing of Sr0.5Sm0.5CoO3 Film,” Journal of Power Sources, Vol. 157, No. 1, 2006, pp. 385-388. doi:10.1016/j.jpowsour.2005.07.041 [11] B. C. H. Steele, “Appraisal of LCe1-yGdyO2-y/2 Electyro- lytes for IT-SOFC Operation at 500˚C,” Solid State Ionics, Vol. 129, No. 1-4, 2000, pp. 95-110. doi:10.1016/S0167-2738(99)00319-7 [12] E. B. Mitberg, M. V. Patrakeev, I. A. Leonidov, V. L. Kozhevnikov and K. R. Poeppelmeier, “High-Temperature Electrical Conductivity and Thermopower in Nonstoi- chiometric La1−xSrxCoO3−δ (x = 0.6),” Solid State Ionics, Vol. 127, No. 3-4, 2000, pp. 325-330. doi:10.1016/S0167-2738(00)00670-6 [13] C.-F. Kao and C.-L. Zheng, “Electrochemical Behaviour of Oxygen at Nickel Nest Cathodic Material with Cata- lyst La1−xSrxCoO3,” Solid State Ionics, Vol. 120, No. 1-4, 1999, pp. 163-171. doi:10.1016/S0167-2738(98)00561-X [14] S. P. Simner, J. F. Bonnett, N. L. Canfield, K. D. Meinhardt, V. L. Sprenkle and J. W. Stevenson, “Optimized Lanthanum Ferrite-Based Cathodes for Anode-Supported SOFCs,” Electrochemical and Solid-State Letters, Vol. 5, No. 7, 2002, pp. 173-175. [15] A. Mai, V. A. C. Haanappel, S. Uhlenbruck, F. Tietz and D. Stover, “Ferrite-Based Perovskites as Cathode Materi- als for Anode-Supported Solid Oxide Fuel Cells: Part I. Variation of Composition,” Solid State Ionics, Vol. 176, No. 15-16, 2005, pp. 341-350. doi:10.1016/j.ssi.2005.03.009 [16] Y. Teraoka, H. M. Zhang, K. Okamoto and N. Yamazoe, “Mixed Ionic -Electronic Conductivity of La1–xSrxCo1–y FeyO3–σ Perovskite-Type Oxide,” Materials Research Bulletin, Vol. 23, No. 1, 1988, pp. 51-58. doi:10.1016/0025-5408(88)90224-3 [17] J. A. Kilner, R. A. De Souza and I. C. Fullarton, “Surface Exchange of Oxygen in Mixed Conducting Perovskite Oxide,” Solid State Ionics, Vol. 86-88, Part 2, 1996, pp. 703-709. doi:10.1016/0167-2738(96)00153-1 [18] S. Tanasescu, N. D. Totir and I. Marchidan, “Thermody- namic Properties of Some Perovskite Type Oxide Used as SOFC Cathode Materials,” Solid State Ionics, Vol. 119, No. 1-4, 1999, pp. 311-315. doi:10.1016/S0167-2738(98)00520-7 [19] J. Holc, D. Kuščer, M. Hrovat, S. Bernik and D. Kolar, “Electrical and Microstructural Characterization of (La0.8Sr0.2) (Fe1–xAlx)O3 and (La0.8Sr0.2) (Mn1–xAlx)O3 as Possible SOFC Cathode Materials,” Solid State Ionics, Vol. 95, No. 3-4, 1997, pp. 259-268. doi:10.1016/S0167-2738(96)00595-4 [20] Z. P. Shao and S. M. Haile, “A High-Performance Cath- ode for the Next Generation of Solid Oxide Fuel Cells,” Nature, Vol. 431, 2004, pp. 170-173. doi:10.1038/nature02863 [21] Y. D. Zhen, A. I. Y. Tok, S. P. Jiang and F. Boey, “La(Ni,Fe)O3 as a Cathode Material with High Tolerance to Chromium Poisoning for Solid Oxide Fuel Cells,” Journal of Power Sources, Vol. 170, No. 1, 2007, pp. 61-66. doi:10.1016/j.jpowsour.2007.03.079 [22] Y. D. Zhen, S. P. Jiang and A. I. Y. Tok, “Strategy of the Development of Cr-Tolerant Cathodes of Solid Oxide Fuel Cells,” ECS Transactions, Vol. 7, No. 1, 2007, pp. 263-269. doi:10.1149/1.2729100 [23] S. Lee, Y. Lim, E. A. Lee, H. J. Hwang and J.-W. Moon, “Ba0.5Sr0.5C00.8Fe0.2O3–δ (BSCF) and La0.6Ba0.4C00.2Fe0.8 O3–δ (LBCF) Cathodes Prepared by Combined Citrtate-EDTA Method for IT-SOFCs,” Journal of Power Sources, Vol. 157, No. 2, 2006, pp. 848-854. doi:10.1016/j.jpowsour.2005.12.028 [24] Y. Zhen and S. P. Jiang, “Characterization and Perform-  Y. M. AL-YOUSEF ET AL. 391 ance of (La,Ba)(Co,Fe)O3 Cathode for Solid Oxide Fuel Cells with Iron-Chromium Metallic Interconnect,” Jour- nal of Power Sources, Vol. 180, No. 2, 2008, pp. 695-703. doi:10.1016/j.jpowsour.2008.02.093 [25] http://azom.com.details.asp?ArticleID=157 [26] K. C. Wincewicz and J. S. Cooper, “Taxonomies of SOFC Material and Manufacturing Alternatives,” Journal of Power Sources, Vol. 140, No. 2, 2005, pp. 280-296. [27] M. Ghouse, A. Al-Musa, Y. Al-Yousef and M. F. Al- Otaibi, “Synthesis of Mg Doped LaCrO3 Nano Powders by Sol-Gel Process for Solid Oxide Fuel Cell Applica- tion,” Journal of New Materials for Electrochemical Sys- tems, Vol. 13, No. 2, 2010, pp. 99-106. [28] M. Ghouse, Y. Al-Yousef, A. Al-Musa and M. F. Al- Otaibi, “Preparation of La0.6Sr0.4Co0.2Fe0.8O3 Nanoce- ramic Cathode Powders for Solid Oxide Fuel Cell (SOFC) Application,” International Journal of Hydrogen Energy, Vol. 35, No. 17, 2010, pp. 9411-9419. doi:10.1016/j.ijhydene.2010.04.144 [29] M. Ghouse, Y. Al-Yousef, A. Al-Musa and M. F. Al- Otaibi, “Preparation of La0.7Ca0.3CrO3 Nanoceramic Powders for Solid Oxide Fuel Cell (SOFC) Application,” World Journal of Engineering, Vol. 6, No. 1, 2009, pp. 149-155. [30] B. D. Cullity, “Elements of X-Ray Diffraction,” 2nd Edition, Addison-Wesley Publication Co., Reading, 1978, p. 102. [31] R. D. Purohit, S. Saha and A. K. Tyagi “Nanocrystalline thoria Powders via Glycine-Nitrate Combustion,” Journal of Nuclear Materials, Vol. 288, No. 1, 2001, pp. 7-10. doi:10.1016/S0022-3115(00)00717-0 [32] http://www.advancedmaterials.us/S572726Sr.htm C opyright © 2011 SciRes. EPE |