Paper Menu >>
Journal Menu >>
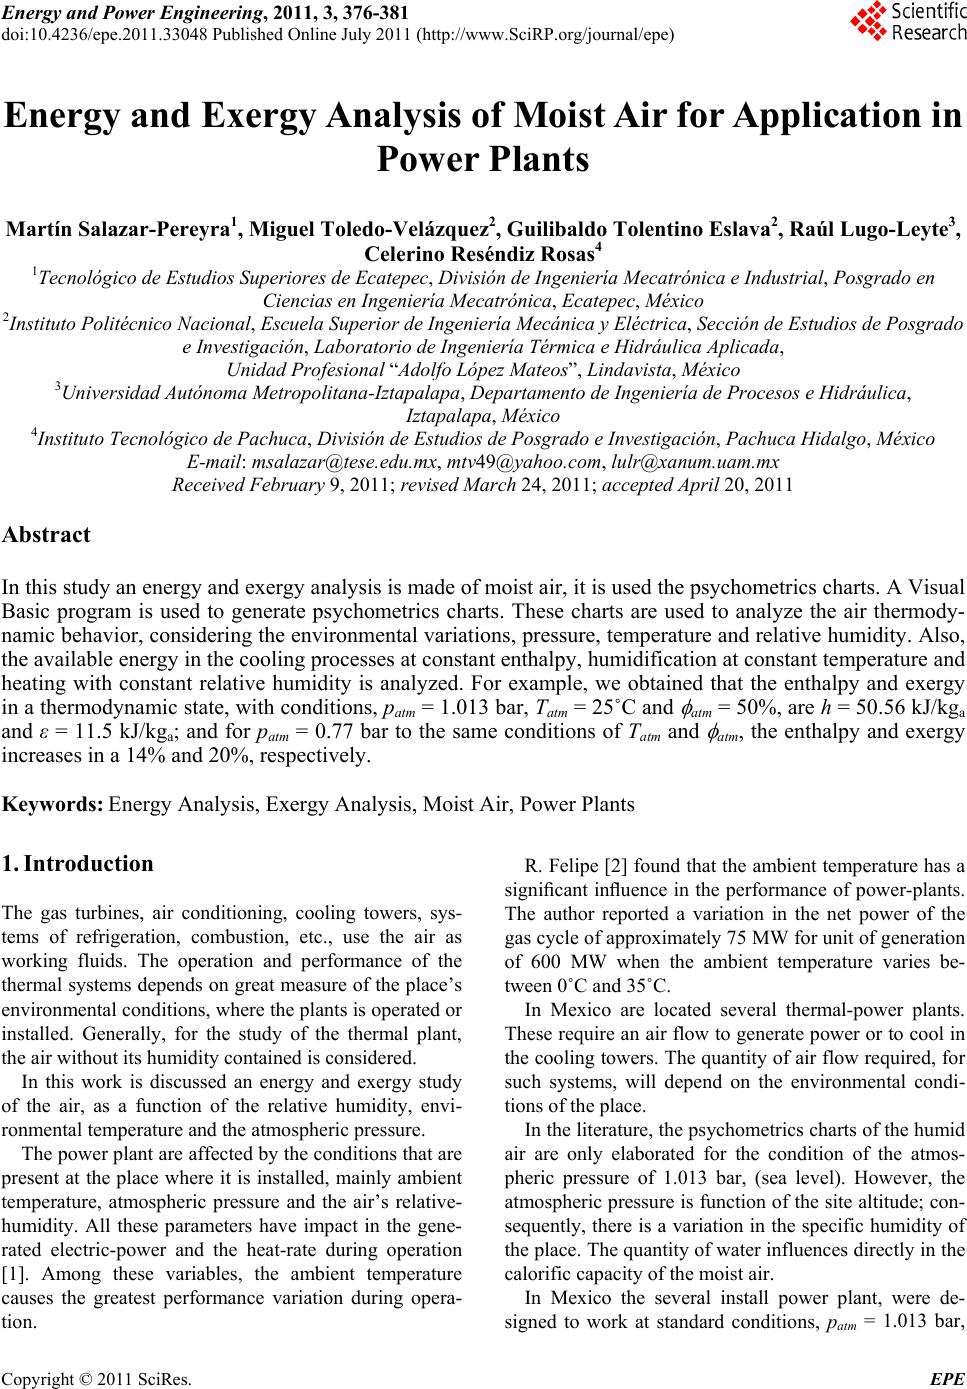 Energy and Power En gi neering, 2011, 3, 376-381 doi:10.4236/epe.2011.33048 Published Online July 2011 (http://www.SciRP.org/journal/epe) Copyright © 2011 SciRes. EPE Energy and Exergy Analysis of Moist Air for Application in Power Plants Martín Salazar-Pereyra1, Miguel Toledo-Velázquez2, Guilibaldo Tolentino Eslava2, Raúl Lugo-Leyte3, Celerino Reséndiz Rosas4 1Tecnológico de Estudios Superiores de Ecatepec, División de Ingeniería Mecatrónica e Industrial, Posgrado en Ciencias en Ingeniería Mecatrónica, Ecatepec, México 2Instituto Politécnico Nacional, Escuela Superior de Ingeniería Mecánica y Eléctrica, Sección de Estudios de Posgrado e Investigación, Laboratorio de Ingeniería Térmica e Hidráulica Aplicada, Unidad Profesional “Adolfo López Mateos”, Lindavista, México 3Universidad Autónoma Metropolitana-Iztapalapa, Departamento de Ingeniería de Procesos e Hidráulica, Iztapalapa, México 4Instituto Tecnológico de Pachuca, División de Estudios de Posgrado e Investigación, Pachuca Hidalgo, México E-mail: msalazar@tese.edu.mx, mtv49@yahoo.com, lulr@xanum.uam.mx Received February 9, 2011; revised March 24, 2011; accepted April 20 , 2 0 1 1 Abstract In this study an energy and exergy analysis is made of moist air, it is used the psychometrics charts. A Visual Basic program is used to generate psychometrics charts. These charts are used to analyze the air thermody- namic behavior, considering the environmental variations, pressure, temperature and relative humidity. Also, the available energy in the cooling processes at constant enthalpy, humidification at constant temperature and heating with constant relative humidity is analyzed. For example, we obtained that the enthalpy and exergy in a thermodynamic state, with conditions, patm = 1.013 bar, Tatm = 25˚C and atm = 50%, are h = 50.56 kJ/kga and ε = 11.5 kJ/kga; and for patm = 0.77 bar to the same conditions of Tatm and atm, the enthalpy and exergy increases in a 14% and 20%, respectively. Keywords: Energy Analysis, Exergy Analysis, Moist Air, Power Plants 1. Introduction The gas turbines, air conditioning, cooling towers, sys- tems of refrigeration, combustion, etc., use the air as working fluids. The operation and performance of the thermal systems depends on great measure of the place’s environmental conditions, where the plants is operated or installed. Generally, for the study of the thermal plant, the air without its humidity contained is considered. In this work is discussed an energy and exergy study of the air, as a function of the relative humidity, envi- ronmental temperature and the atmospheric pressure. The power plant are affected by the conditio ns that are present at the place where it is installed, mainly ambient temperature, atmospheric pressure and the air’s relative- humidity. All these parameters have impact in the gene- rated electric-power and the heat-rate during operation [1]. Among these variables, the ambient temperature causes the greatest performance variation during opera- tion. R. Felipe [2] found that the ambient temperature has a significant influence in the performance of power-plants. The author reported a variation in the net power of the gas cycle of approximately 75 MW for unit of generation of 600 MW when the ambient temperature varies be- tween 0˚C and 35˚C. In Mexico are located several thermal-power plants. These require an air flow to generate power or to cool in the cooling towers. The quantity of air flow req uired, for such systems, will depend on the environmental condi- tions of the p lace. In the literature, the psychometrics ch arts of the humid air are only elaborated for the condition of the atmos- pheric pressure of 1.013 bar, (sea level). However, the atmospheric pressure is function of the site altitu de; con- sequently, there is a variation in the specific humidity of the place. The quantity of water influences directly in the calorific capacity of the moist air. In Mexico the several install power plant, were de- signed to work at standard conditions, patm = 1.013 bar, 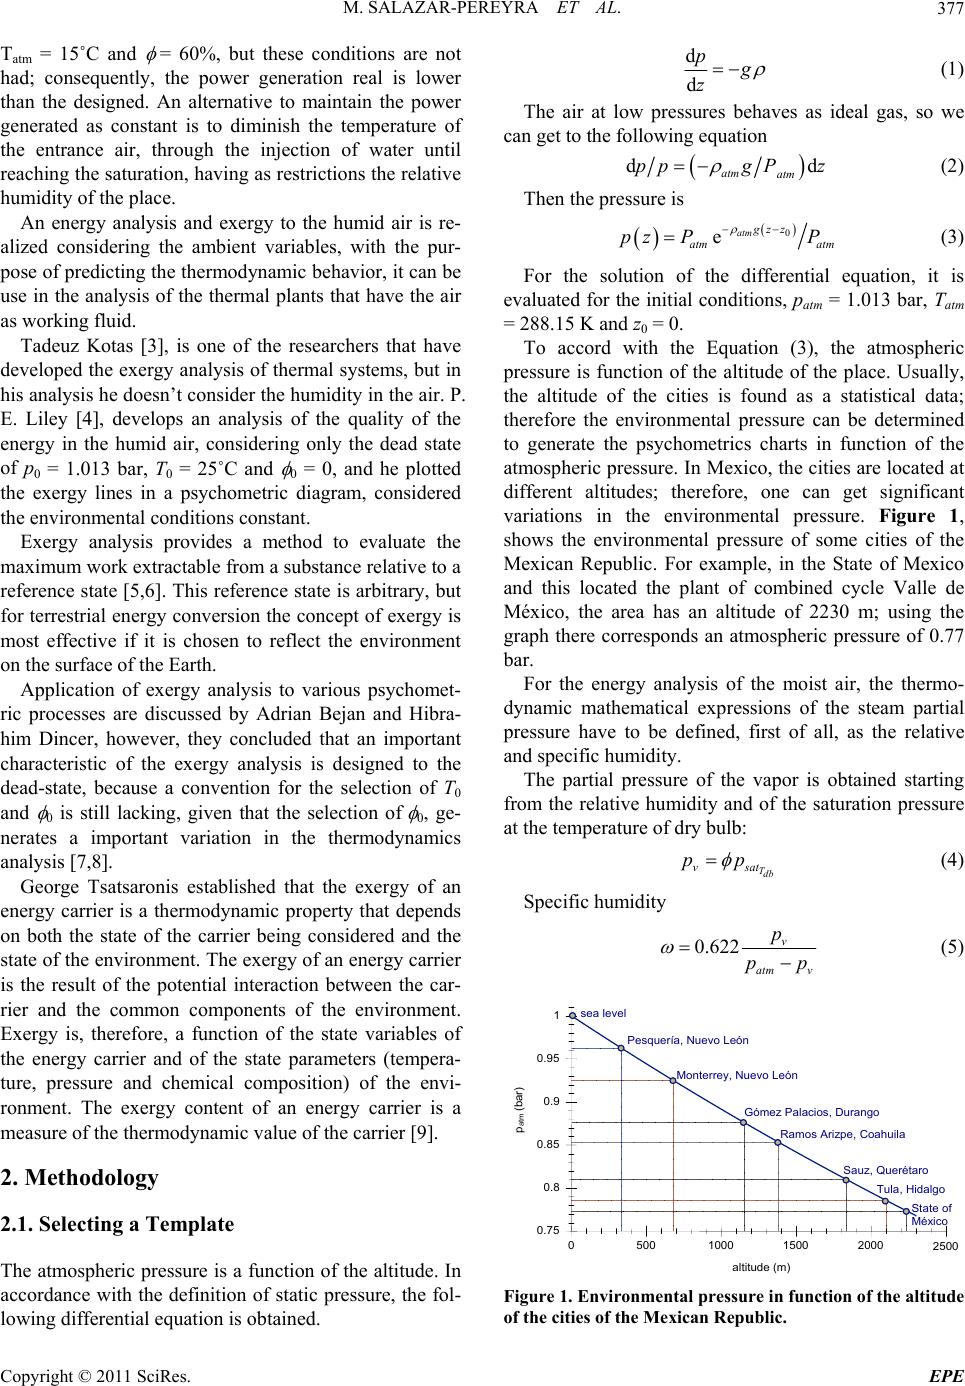 M. SALAZAR-PEREYRA ET AL.377 Tatm = 15˚C and = 60%, but these conditions are not had; consequently, the power generation real is lower than the designed. An alternative to maintain the power generated as constant is to diminish the temperature of the entrance air, through the injection of water until reaching the saturation, having as restrictions the relative humidity of the place. An energy analysis and exergy to the humid air is re- alized considering the ambient variables, with the pur- pose of predicting the thermodynamic behavior, it can be use in the analysis of the thermal plants that have the air as working fluid. Tadeuz Kotas [3], is one of the researchers that have developed the exergy analysis of thermal systems, but in his analysis he doesn’t consider the humidity in the air. P. E. Liley [4], develops an analysis of the quality of the energy in the humid air, considering only the dead state of p0 = 1.013 bar, T0 = 25˚C and 0 = 0, and he plotted the exergy lines in a psychometric diagram, considered the environmental cond itions constant. Exergy analysis provides a method to evaluate the maximum work extractable fro m a substance relativ e to a reference state [5,6]. This reference state is arbitrary, but for terrestrial energy conversio n the concept of ex ergy is most effective if it is chosen to reflect the environment on the surface of the Earth. Application of exergy analysis to various psychomet- ric processes are discussed by Adrian Bejan and Hibra- him Dincer, however, they concluded that an important characteristic of the exergy analysis is designed to the dead-state, because a convention for the selection of T0 and 0 is still lacking, given that the selection of 0, ge- nerates a important variation in the thermodynamics analysis [7,8]. George Tsatsaronis established that the exergy of an energy carrier is a thermodynamic property that depends on both the state of the carrier being considered and the state of the environment. The exergy of an energy carrier is the result of the potential interaction between the car- rier and the common components of the environment. Exergy is, therefore, a function of the state variables of the energy carrier and of the state parameters (tempera- ture, pressure and chemical composition) of the envi- ronment. The exergy content of an energy carrier is a measure of the therm o dyn amic value of the carrier [9]. 2. Methodology 2.1. Selecting a Template The atmospheric pressure is a function of the altitud e. In accordance with the definition of static pressure, the fol- lowing differential equation is obtained. d d p g z (1) The air at low pressures behaves as ideal gas, so we can get to the following equation dd atm atm ppgP z (2) Then th e pressur e is 0 eatm gz z atm atm pz PP (3) For the solution of the differential equation, it is evaluated for the initial conditions, patm = 1.013 bar, Tatm = 288.15 K and z0 = 0. To accord with the Equation (3), the atmospheric pressure is function of the altitude of the place. Usually, the altitude of the cities is found as a statistical data; therefore the environmental pressure can be determined to generate the psychometrics charts in function of the atmospheric pressure. In Mexico, the cities are located at different altitudes; therefore, one can get significant variations in the environmental pressure. Figure 1, shows the environmental pressure of some cities of the Mexican Republic. For example, in the State of Mexico and this located the plant of combined cycle Valle de México, the area has an altitude of 2230 m; using the graph there corresponds an atmospheric pressure of 0.77 bar. For the energy analysis of the moist air, the thermo- dynamic mathematical expressions of the steam partial pressure have to be defined, first of all, as the relative and specific humidity. The partial pressure of the vapor is obtained starting from the relative humidity and of the saturation pressure at the temperature of dry bulb: Tdb vsat pp (4) Specific humidity 0.622 v atm v p pp (5) 05001000 1500 2000 2500 altitude (m) 0.75 0.8 0.85 0.9 0.95 1 p atm (bar) sea level Gómez Palacios, Durango Sauz, Querétaro Tula, Hidalgo Pesquería, Nuevo León Ramos Arizpe, Coahuila Monterrey, Nuevo León State of México Figure 1. Environmental pressure in function of the altitude of the cities of the Mexican Republic. Copyright © 2011 SciRes. EPE 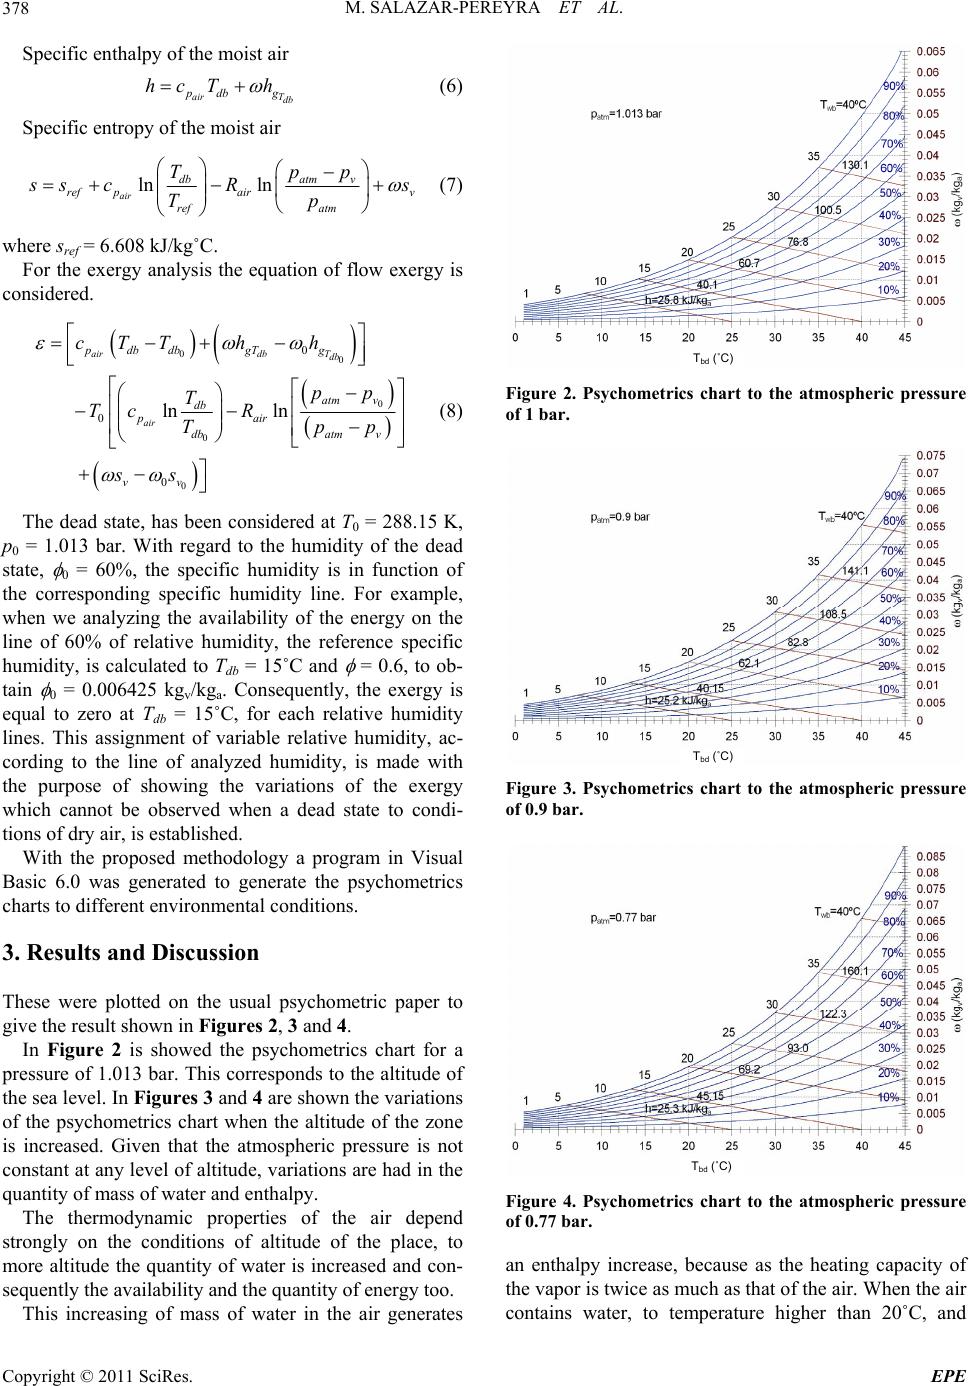 M. SALAZAR-PEREYRA ET AL. 378 Specific enthalpy of the moist air air Tdb pdb g hcT h (6) Specific entropy of the moist air ln ln air dbatm v ref pairv ref atm Tpp s sc Rs Tp (7) where sref = 6.608 kJ/kg˚C. For the exergy analysis the equation of flow exergy is considered. 00 0 0 0 0 0 0 lnln airdb Tdb air pdbdbgT g atm v db pair dbatm v vv cTTh h pp T Tc R Tp ss p (8) The dead state, has been considered at T0 = 288.15 K, p0 = 1.013 bar. With regard to the humidity of the dead state, 0 = 60%, the specific humidity is in function of the corresponding specific humidity line. For example, when we analyzing the availability of the energy on the line of 60% of relative humidity, the reference specific humidity, is calculated to Tdb = 15˚C and = 0.6, to ob- tain 0 = 0.006425 kgv/kga. Consequently, the exergy is equal to zero at Tdb = 15˚C, for each relative humidity lines. This assignment of variable relative humidity, ac- cording to the line of analyzed humidity, is made with the purpose of showing the variations of the exergy which cannot be observed when a dead state to condi- tions of dry air, is established. With the proposed methodology a program in Visual Basic 6.0 was generated to generate the psychometrics charts to different environmental conditions. 3. Results and Discussion These were plotted on the usual psychometric paper to give the resu l t shown in Figures 2, 3 and 4. In Figure 2 is showed the psychometrics chart for a pressure of 1.013 bar. This correspo nds to the altitude of the sea level. In Figures 3 and 4 are shown the v ar iations of the psychometrics chart when the altitude of the zone is increased. Given that the atmospheric pressure is not constant at any level of altitude, variations are had in the quantity of mass of water and enthalpy. The thermodynamic properties of the air depend strongly on the conditions of altitude of the place, to more altitude the quantity of water is increased and con- sequently the availab ility and the quantity of energy too. This increasing of mass of water in the air generates Tbd (˚C) Figure 2. Psychometrics chart to the atmospheric pressure of 1 bar. Tbd (˚C) Figure 3. Psychometrics chart to the atmospheric pressure of 0.9 bar. Tbd (˚C) Figure 4. Psychometrics chart to the atmospheric pressure of 0.77 bar. an enthalpy increase, because as the heating capacity of the vapor is twice as much as that of the air. When the air contains water, to temperature higher than 20˚C, and Copyright © 2011 SciRes. EPE 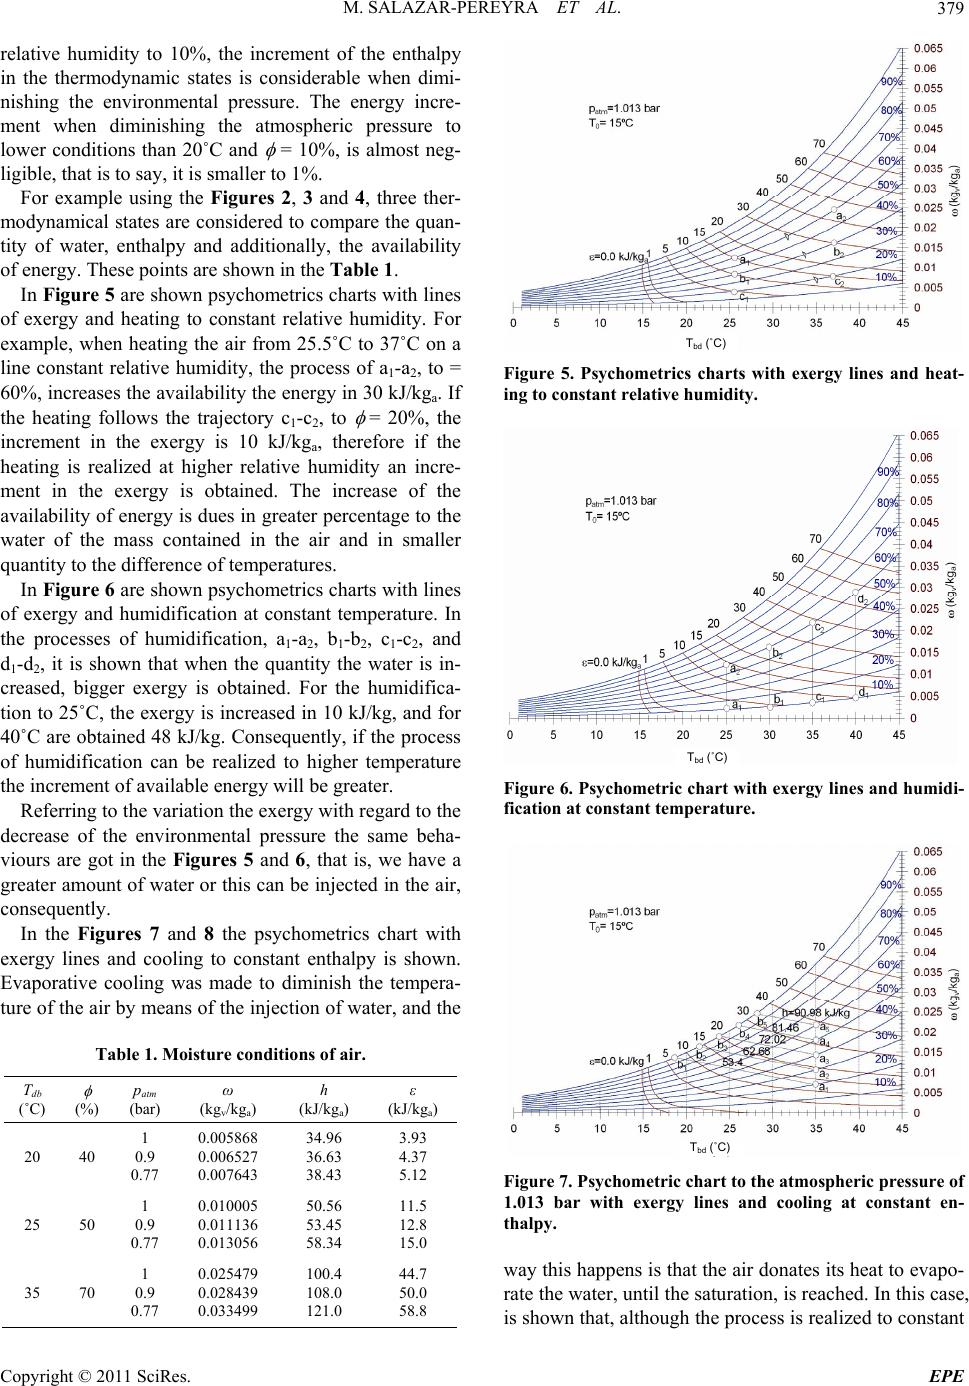 M. SALAZAR-PEREYRA ET AL.379 relative humidity to 10%, the increment of the enthalpy in the thermodynamic states is considerable when dimi- nishing the environmental pressure. The energy incre- ment when diminishing the atmospheric pressure to lower conditions than 20˚C and = 10%, is almost neg- ligible, that is to say, it is smaller to 1%. For example using the Figures 2, 3 and 4, three ther- modynamical states are considered to compare the quan- tity of water, enthalpy and additionally, the availability of energy. These points are shown in the Table 1. In Figure 5 are shown psychometrics charts with lines of exergy and heating to constant relative humidity. For example, when heating the air from 25.5˚C to 37˚C on a line constant relative humidity, the process of a1-a2, to = 60%, increases the availabilit y the energy in 30 k J/kga. If the heating follows the trajectory c1-c2, to = 20%, the increment in the exergy is 10 kJ/kga, therefore if the heating is realized at higher relative humidity an incre- ment in the exergy is obtained. The increase of the availability of energ y is dues in greater percentage to the water of the mass contained in the air and in smaller quantity to the difference of temperatures. In Figure 6 are shown psychometrics charts with lines of exergy and humidification at constant temperature. In the processes of humidification, a1-a2, b1-b2, c1-c2, and d1-d2, it is shown that when the quantity the water is in- creased, bigger exergy is obtained. For the humidifica- tion to 25˚C, the exergy is increased in 10 kJ/kg, and for 40˚C are obtained 48 kJ/kg . Consequently, if the pro cess of humidification can be realized to higher temperature the increment of available energy will be greater. Referring to the variation the exergy with regard to the decrease of the environmental pressure the same beha- viours are got in the Figures 5 and 6, that is, we have a greater amount of water or this can be injected in the air, consequently. In the Figures 7 and 8 the psychometrics chart with exergy lines and cooling to constant enthalpy is shown. Evaporative cooling was made to diminish the tempera- ture of the air by means of the injection of water, and the Table 1. Moisture conditions of air. Tdb (˚C) (%) patm (bar) ω (kgv/kga) h (kJ/kga) ε (kJ/kga) 20 40 1 0.9 0.77 0.005868 0.006527 0.007643 34.96 36.63 38.43 3.93 4.37 5.12 25 50 1 0.9 0.77 0.010005 0.011136 0.013056 50.56 53.45 58.34 11.5 12.8 15.0 35 70 1 0.9 0.77 0.025479 0.028439 0.033499 100.4 108.0 121.0 44.7 50.0 58.8 Tbd (˚C) Figure 5. Psychometrics charts with exergy lines and heat- ing to constant relative humidity. Tbd (˚C) Figure 6. Psychometric chart with exergy lines and humidi- fication at constant temperature. Tbd (˚C) Figure 7. Psychometric chart to the atmospheric pressure of 1.013 bar with exergy lines and cooling at constant en- thalpy. way this happens is that the air donates its h eat to evapo- rate the water, until the saturation, is reached. In this case, is shown that, although the process is realized to constant Copyright © 2011 SciRes. EPE 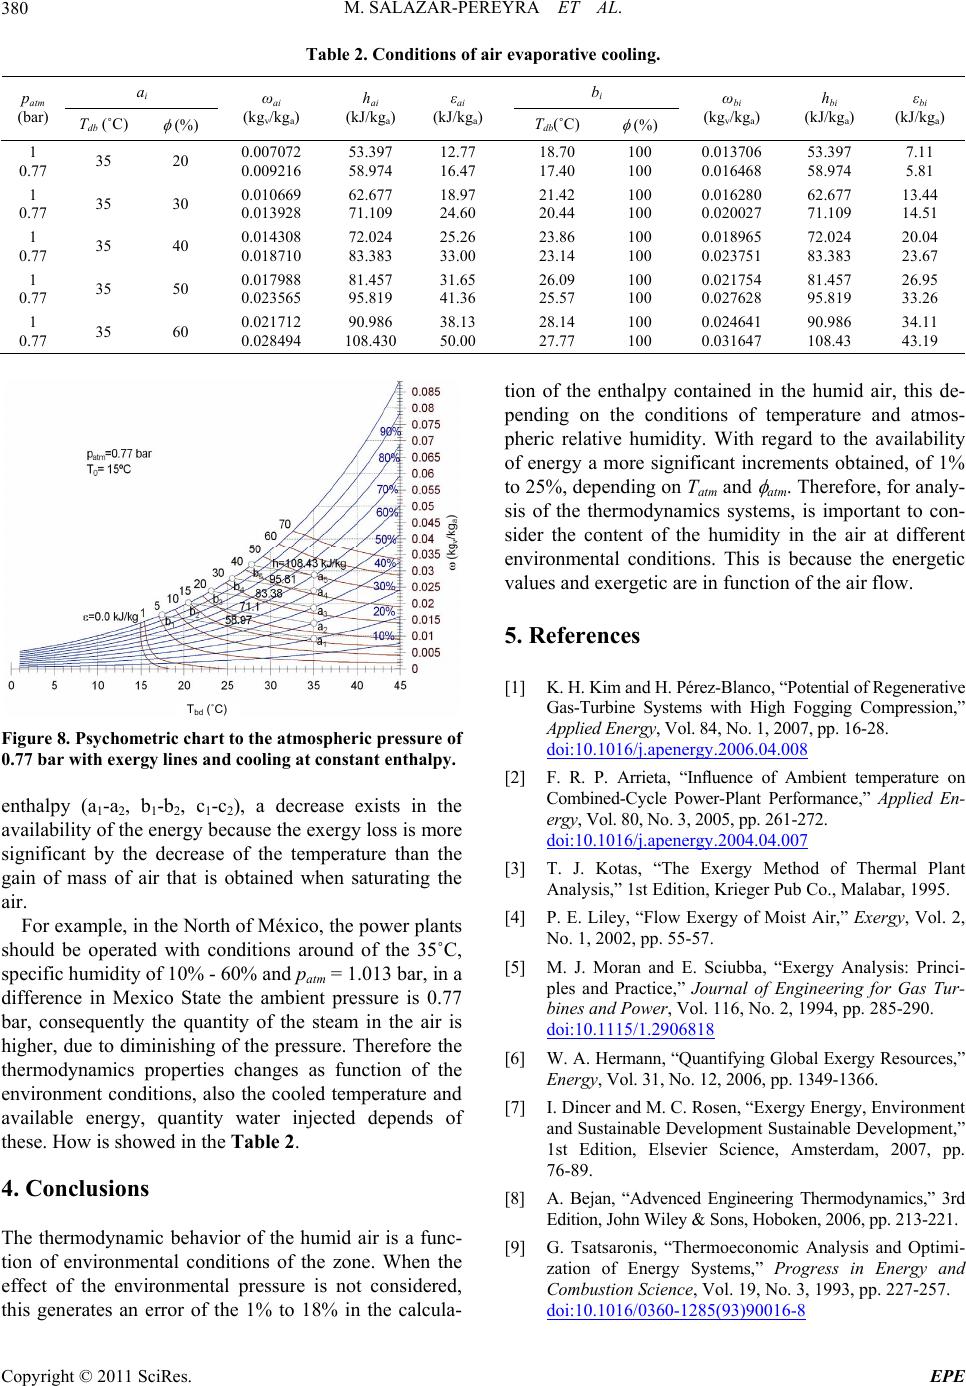 M. SALAZAR-PEREYRA ET AL. Copyright © 2011 SciRes. EPE 380 Table 2. Conditions of air evaporative cooling. ai b i patm (bar) Tdb (˚C) (%) ωai (kgv/kga) hai (kJ/kga) εai (kJ/kga) Tdb(˚C) (%) ωbi (kgv/kga) hbi (kJ/kga) εbi (kJ/kga) 1 0.77 35 20 0.007072 0.009216 53.397 58.974 12.77 16.47 18.70 17.40 100 100 0.013706 0.016468 53.397 58.974 7.11 5.81 1 0.77 35 30 0.010669 0.013928 62.677 71.109 18.97 24.60 21.42 20.44 100 100 0.016280 0.020027 62.677 71.109 13.44 14.51 1 0.77 35 40 0.014308 0.018710 72.024 83.383 25.26 33.00 23.86 23.14 100 100 0.018965 0.023751 72.024 83.383 20.04 23.67 1 0.77 35 50 0.017988 0.023565 81.457 95.819 31.65 41.36 26.09 25.57 100 100 0.021754 0.027628 81.457 95.819 26.95 33.26 1 0.77 35 60 0.021712 0.028494 90.986 108.430 38.13 50.00 28.14 27.77 100 100 0.024641 0.031647 90.986 108.43 34.11 43.19 Figure 8. Psychometric chart to the atmospheric pressure of 0.77 bar with exergy lines and cooling at constant enthalpy. enthalpy (a1-a2, b1-b2, c1-c2), a decrease exists in the availability of the en ergy becau se the ex ergy loss is more significant by the decrease of the temperature than the gain of mass of air that is obtained when saturating the air. For example, in the North of México, the power plants should be operated with conditions around of the 35˚C, specific humidity of 10% - 60% and patm = 1.013 bar, in a difference in Mexico State the ambient pressure is 0.77 bar, consequently the quantity of the steam in the air is higher, due to diminishing of the pressure. Therefore the thermodynamics properties changes as function of the environment conditions, also the cooled temperature and available energy, quantity water injected depends of these. How is showed in the Table 2. 4. Conclusions The thermodynamic behavior of the humid air is a func- tion of environmental conditions of the zone. When the effect of the environmental pressure is not considered, this generates an error of the 1% to 18% in the calcula- tion of the enthalpy contained in the humid air, this de- pending on the conditions of temperature and atmos- pheric relative humidity. With regard to the availability of energy a more significant increments obtained, of 1% to 25%, depending on Tatm and atm. Therefore, for analy- sis of the thermodynamics systems, is important to con- sider the content of the humidity in the air at different environmental conditions. This is because the energetic values and exergetic are in function of the air flow. 5. References [1] K. H. Kim and H. Pérez-Blanco, “Potential of Regenerative Gas-Turbine Systems with High Fogging Compression,” Applied Energy, Vol. 84, No. 1, 2007, pp. 16-28. doi:10.1016/j.apenergy.2006.04.008 Tbd (˚C) [2] F. R. P. Arrieta, “Influence of Ambient temperature on Combined-Cycle Power-Plant Performance,” Applied En- ergy, Vol. 80, No. 3, 2005, pp. 261-272. doi:10.1016/j.apenergy.2004.04.007 [3] T. J. Kotas, “The Exergy Method of Thermal Plant Analysis,” 1st Edition, Krieger Pub Co., Malabar, 1995. [4] P. E. Liley, “Flow Exergy of Moist Air,” Exergy, Vol. 2, No. 1, 2002, pp. 55-57. [5] M. J. Moran and E. Sciubba, “Exergy Analysis: Princi- ples and Practice,” Journal of Engineering for Gas Tur- bines and Power, Vol. 116, No. 2, 1994, pp. 285-290. doi:10.1115/1.2906818 [6] W. A. Hermann, “Quantifying Global Exergy Resources,” Energy, Vol. 31, No. 12, 2006, pp. 1349-1366. [7] I. Dincer and M. C. Rosen, “Exergy Energy, Environment and Sustainable Development Sustainable Development,” 1st Edition, Elsevier Science, Amsterdam, 2007, pp. 76-89. [8] A. Bejan, “Advenced Engineering Thermodynamics,” 3rd Edition, John Wiley & Sons, Hoboken, 2006, pp. 213-221. [9] G. Tsatsaronis, “Thermoeconomic Analysis and Optimi- zation of Energy Systems,” Progress in Energy and Combustion Science, Vol. 19, No. 3, 1993, pp. 227-257. doi:10.1016/0360-1285(93)90016-8  M. SALAZAR-PEREYRA ET AL.381 Nomenclature cp specific heat to constant pressure; [kJ/kgK], g gravitational acceleration; [=9.81 m/s2], h specific enthalpy; [kJ/kg], p pressure; [bar, Pa], pv partial pressure of the vapor; [bar, Pa], s specific entropy; [kJ/kg K]. Greek letters specific exergy; [kJ/kg], relative humidity; [–, %], Ρ density; [kg/m3], specific humidity; [kgv/kga], z altitude; [m]. Subscript a dry air, atm atmospheric, wb wet bulb, db dry bulb, g sutured vapor, ref reference state, sat saturation, v water vapor, 0 dead state. Copyright © 2011 SciRes. EPE |