Paper Menu >>
Journal Menu >>
 Modern Economy, 2011, 2, 194-202 doi:10.4236/me.2011.23025 Published Online July 2011 (http://www.SciRP.org/journal/me) Copyright © 2011 SciRes. ME The Pricing for Interest Sensitive Products of Life Insurance Firms James C. Hao Associate Professor, Department of Insurance, Tamkang University, N E-mail: cjhao@mail.tku.edu.tw Received February 10, 2011; revised April 15, 2011 ; accepted April 26, 2011 Abstract The major purpose of this paper is to construct interest rate risk models for interest sensitive products issued by life insurance firms in Taiwan. With interest declines in late 1990s, single paid interest sensitive annuity takes up about 20% of new policy premiums in Taiwan; this implies its risk and profitability become critical to insurers’ financial health. The paper constructs the Black-Derman-Toy model combining with op- tional-adjusted spread analysis model to price the spread on asset required to yield to make such products break even, with further extension to measure the impact of interest shock on asset liability management. We choose two different crediting strategy products to illustrate the option value of the insurance firms- the op- tion to reset rates based on the path of interest rates and the expenses charges as well as the option of poli- cyholders-the option to surrender policy if not satisfied with crediting rate. With our implemenTable models, insurance firm will have capacity to quantify its risk exposure and source of profitability as well as to seek an optimal strategy balancing sale volume and aggressiveness of crediting policy. Keywords: Cash Flow Analysis, Interest Sensitive Annuity, Arbitrage Free Interest Rate Model, Optional-Adjusted Spread Analysis Model 1. Introduction Interest rate risk is an important concern for life insur- ance firms. Insurers issue debt instruments for which the amount and timings of benefits payment are unknown at time of policy issuance and invest the premiums to maximize the return. The asset cash flow is composed of investment income and principal repayments while the liability cash flow in any future time is defined as the sum of the policy claims, policy surrenders and expenses minus the premium income expected to occur in that time period. When interest rates fall as the net cash flows are positive, the net flows will have to be reinvested at rates lower than the initial rates. The reinvestment risk emerges. On the other hand, negative net cash flows mean shortages of cash needed to meet liability obliga- tions. A cash shortage requires the liquidation of assets or borrowing. If interest rates rise when the net cash flows are negative, capital losses can occur as a result of liquidation of bonds and other fixed-income securities whose values have fallen. And the price risk occurs. Taiwan insurance companies are exposed largely to interest risk even though the popular products change over time. Prior to 1990, market was featured with fixed interest rate products which guarantee 20 or more years of fixed return to policyholders. With interest starts to decline in late 1990s, Taiwan insurers realize that high fixed interest products are too costly to issue but low fixed-interest rate products won’t be attractive to poten- tial buyers. With the sale pressure, insurance companies start to issue unit-linked products as well as interest sen- sitive products to attract buyers. Single paid deferred annuities (SPDA) which belongs to interest sensitive family quickly takes up almost 20% of new premiums in the market and therefore its risk exposure becomes vital to insurers’ insolvency. With single premium payment, SPDA policyholders earn interest at the company-declared annual interest rate which is guaranteed for one year at a time. Before the annuity commencement date, policyholders can with- draw all of the annuity value or part of it. With the above features SPDA involves two options. One option is in the policy holder’s hands, the option to surrender the con- tract early. As interest rates rise, SPDA owners tend to surrender and reinvest in higher yielding investments which is similar to the mortgage borrowers’ behavior. 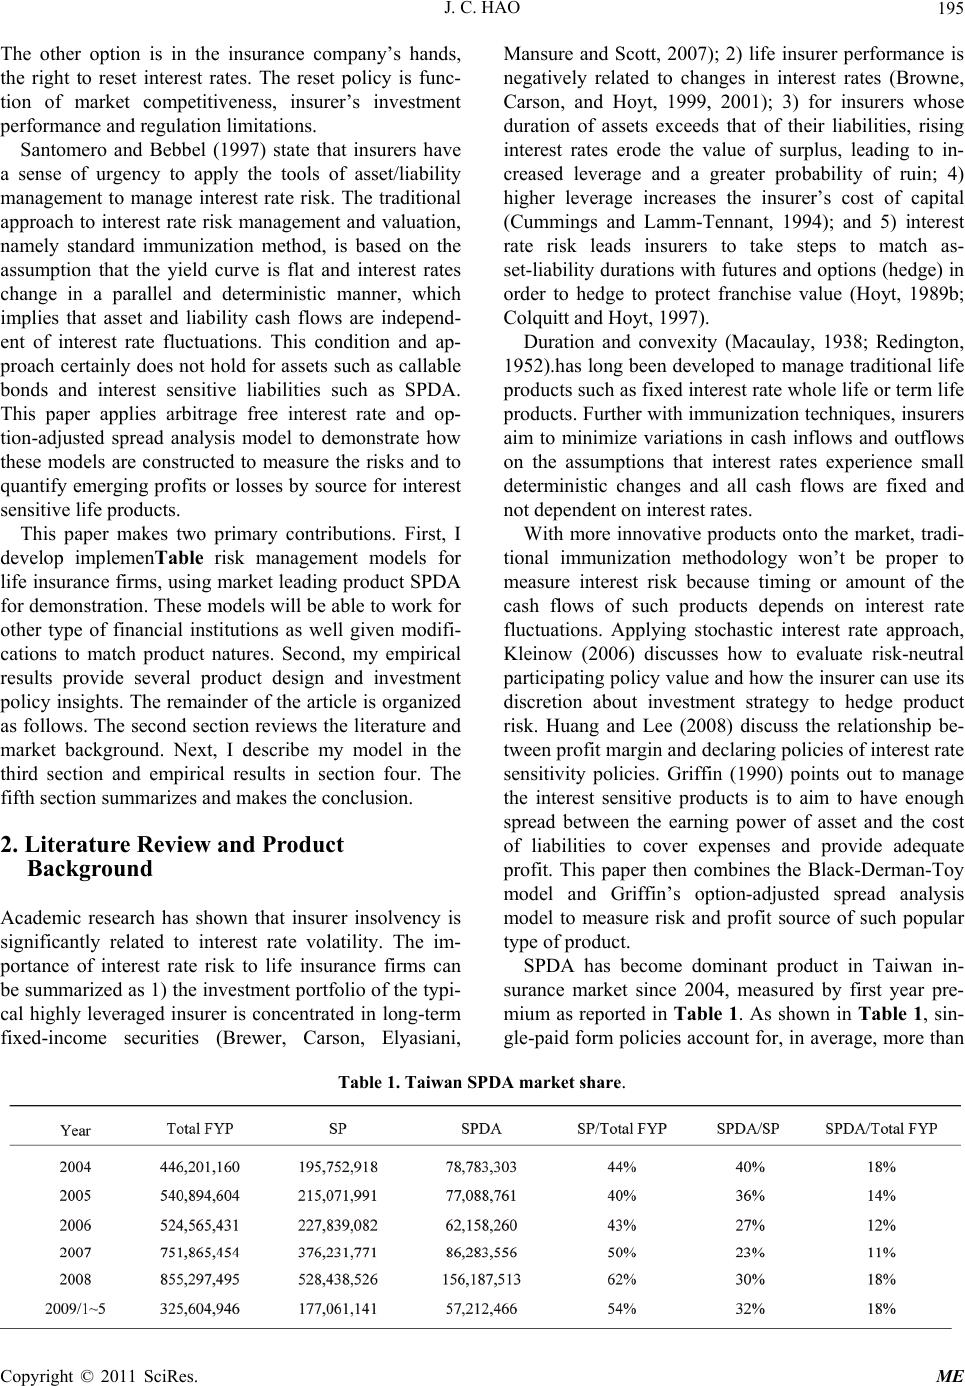 J. C. HAO195 The other option is in the insurance company’s hands, the right to reset interest rates. The reset policy is func- tion of market competitiveness, insurer’s investment performance and regulation limitations. Santomero and Bebbel (1997) state that insurers have a sense of urgency to apply the tools of asset/liability management to manage interest rate risk. The traditional approach to interest rate risk management and valuation, namely standard immunization method, is based on the assumption that the yield curve is flat and interest rates change in a parallel and deterministic manner, which implies that asset and liability cash flows are independ- ent of interest rate fluctuations. This condition and ap- proach certainly does not hold for assets such as callable bonds and interest sensitive liabilities such as SPDA. This paper applies arbitrage free interest rate and op- tion-adjusted spread analysis model to demonstrate how these models are constructed to measure the risks and to quantify emerging profits or losses by source for interest sensitive life products. This paper makes two primary contributions. First, I develop implemenTable risk management models for life insurance firms, using market leading product SPDA for demonstration. These models will be able to work for other type of financial institutions as well given modifi- cations to match product natures. Second, my empirical results provide several product design and investment policy insights. The remainder of the article is organized as follows. The second section reviews the literature and market background. Next, I describe my model in the third section and empirical results in section four. The fifth section summarizes and makes the conclusion. 2. Literature Review and Product Background Academic research has shown that insurer insolvency is significantly related to interest rate volatility. The im- portance of interest rate risk to life insurance firms can be summarized as 1) the investment portfolio of the typi- cal highly leveraged insurer is concentrated in long-term fixed-income securities (Brewer, Carson, Elyasiani, Mansure and Scott, 2007); 2) life insurer performance is negatively related to changes in interest rates (Browne, Carson, and Hoyt, 1999, 2001); 3) for insurers whose duration of assets exceeds that of their liabilities, rising interest rates erode the value of surplus, leading to in- creased leverage and a greater probability of ruin; 4) higher leverage increases the insurer’s cost of capital (Cummings and Lamm-Tennant, 1994); and 5) interest rate risk leads insurers to take steps to match as- set-liability durations with futures and options (hedge) in order to hedge to protect franchise value (Hoyt, 1989b; Colquitt and Hoyt, 1997). Duration and convexity (Macaulay, 1938; Redington, 1952).has long been developed to manage traditional life products such as fixed interest rate whole life or term life products. Further with immunization techniques, insurers aim to minimize variations in cash inflows and outflows on the assumptions that interest rates experience small deterministic changes and all cash flows are fixed and not dependent on interest rates. With more innovative products onto the market, tradi- tional immunization methodology won’t be proper to measure interest risk because timing or amount of the cash flows of such products depends on interest rate fluctuations. Applying stochastic interest rate approach, Kleinow (2006) discusses how to evaluate risk-neutral participating policy value and how the insurer can use its discretion about investment strategy to hedge product risk. Huang and Lee (2008) discuss the relationship be- tween profit margin and declaring policies of interest rate sensitivity policies. Griffin (1990) points out to manage the interest sensitive products is to aim to have enough spread between the earning power of asset and the cost of liabilities to cover expenses and provide adequate profit. This paper then combines the Black-Derman-Toy model and Griffin’s option-adjusted spread analysis model to measure risk and profit source of such popular type of product. SPDA has become dominant product in Taiwan in- surance market since 2004, measured by first year pre- mium as reported in Table 1. As shown in Table 1, sin- gle-paid form policies account for, in average, more than Table 1. Taiwan SPDA market share. Copyright © 2011 SciRes. ME 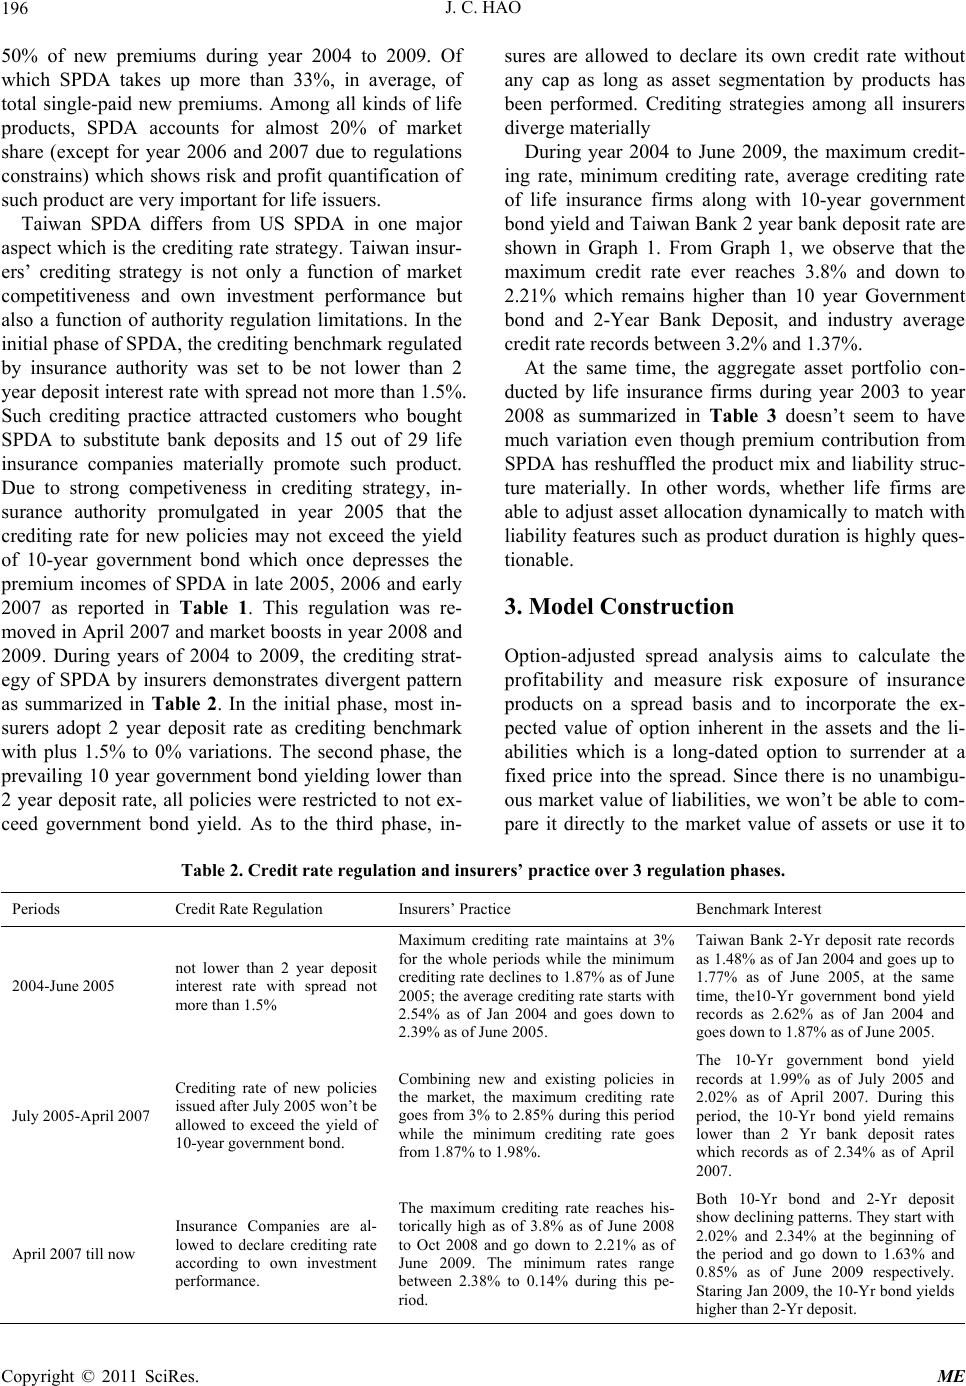 J. C. HAO Copyright © 2011 SciRes. ME 196 50% of new premiums during year 2004 to 2009. Of which SPDA takes up more than 33%, in average, of total single-paid new premiums. Among all kinds of life products, SPDA accounts for almost 20% of market share (except for year 2006 and 2007 due to regulations constrains) which shows risk and profit quantification of such product are very important for life issuers. Taiwan SPDA differs from US SPDA in one major aspect which is the crediting rate strategy. Taiwan insur- ers’ crediting strategy is not only a function of market competitiveness and own investment performance but also a function of authority regulation limitations. In the initial phase of SPDA, the crediting benchmark regulated by insurance authority was set to be not lower than 2 year deposit interest rate with spread not more than 1.5%. Such crediting practice attracted customers who bought SPDA to substitute bank deposits and 15 out of 29 life insurance companies materially promote such product. Due to strong competiveness in crediting strategy, in- surance authority promulgated in year 2005 that the crediting rate for new policies may not exceed the yield of 10-year government bond which once depresses the premium incomes of SPDA in late 2005, 2006 and early 2007 as reported in Table 1. This regulation was re- moved in April 2007 and market boosts in year 2008 and 2009. During years of 2004 to 2009, the crediting strat- egy of SPDA by insurers demonstrates divergent pattern as summarized in Table 2. In the initial phase, most in- surers adopt 2 year deposit rate as crediting benchmark with plus 1.5% to 0% variations. The second phase, the prevailing 10 year government bond yielding lower than 2 year deposit rate, all policies were restricted to not ex- ceed government bond yield. As to the third phase, in- sures are allowed to declare its own credit rate without any cap as long as asset segmentation by products has been performed. Crediting strategies among all insurers diverge materially During year 2004 to June 2009, the maximum credit- ing rate, minimum crediting rate, average crediting rate of life insurance firms along with 10-year government bond yield and Taiwan Bank 2 year bank deposit rate are shown in Graph 1. From Graph 1, we observe that the maximum credit rate ever reaches 3.8% and down to 2.21% which remains higher than 10 year Government bond and 2-Year Bank Deposit, and industry average credit rate records between 3.2% and 1.37%. At the same time, the aggregate asset portfolio con- ducted by life insurance firms during year 2003 to year 2008 as summarized in Table 3 doesn’t seem to have much variation even though premium contribution from SPDA has reshuffled the product mix and liability struc- ture materially. In other words, whether life firms are able to adjust asset allocation dynamically to match with liability features such as product duration is highly ques- tionable. 3. Model Construction Option-adjusted spread analysis aims to calculate the profitability and measure risk exposure of insurance products on a spread basis and to incorporate the ex- pected value of option inherent in the assets and the li- abilities which is a long-dated option to surrender at a fixed price into the spread. Since there is no unambigu- ous market value of liabilities, we won’t be able to com- pare it directly to the market value of assets or use it to Table 2. Credit rate regulation and insurers’ practice over 3 regulation phases. Periods Credit Rate Regulation Insurers’ Practice Benchmark Interest 2004-June 2005 not lower than 2 year deposit interest rate with spread not more than 1.5% Maximum crediting rate maintains at 3% for the whole periods while the minimum crediting rate declines to 1.87% as of June 2005; the average crediting rate starts with 2.54% as of Jan 2004 and goes down to 2.39% as of June 2005. Taiwan Bank 2-Yr deposit rate records as 1.48% as of Jan 2004 and goes up to 1.77% as of June 2005, at the same time, the10-Yr government bond yield records as 2.62% as of Jan 2004 and goes down to 1.87% as of June 2005. July 2005-April 2007 Crediting rate of new policies issued after July 2005 won’t be allowed to exceed the yield of 10-year government bond. Combining new and existing policies in the market, the maximum crediting rate goes from 3% to 2.85% during this period while the minimum crediting rate goes from 1.87% to 1.98%. The 10-Yr government bond yield records at 1.99% as of July 2005 and 2.02% as of April 2007. During this period, the 10-Yr bond yield remains lower than 2 Yr bank deposit rates which records as of 2.34% as of April 2007. April 2007 till now Insurance Companies are al- lowed to declare crediting rate according to own investment performance. The maximum crediting rate reaches his- torically high as of 3.8% as of June 2008 to Oct 2008 and go down to 2.21% as of June 2009. The minimum rates range between 2.38% to 0.14% during this pe- riod. Both 10-Yr bond and 2-Yr deposit show declining patterns. They start with 2.02% and 2.34% at the beginning of the period and go down to 1.63% and 0.85% as of June 2009 respectively. Staring Jan 2009, the 10-Yr bond yields higher than 2-Yr deposit.  J. C. HAO197 0.00% 0.50% 1.00% 1.50% 2.00% 2.50% 3.00% 3.50% 4.00% 2003/06 2004/01 2004/08 2005/02 2005/092006/03 2006/102007/04 2007/11 2008/06 2008/122009/07 2010/01 Maximum Minimum Average 10-Yr Gov Bnd2 Year Deposit Graph 1. The maximum/minimum/average crediting rate and 10-year government bond yield and Taiwan Bank 2 year bank deposit rate from Jan of 2004 to June of 2009. Table 3. Life firms asset allocation by year. calculate an option-adjusted spread on the liabilities. As suggested by Griffin (1990), I use the market value of assets, which is known, to calculate the required spread on assets which represents the spread over Treasuries that must be earned in order to satisfy the liabilities. To start to calculate the required spread on asset to earn for interest sensitive liabilities, I first need to de- velop a set of Treasury interest rate paths. I adopt Black-Derman-Toy model as shown in equation (1). dd. dln d rt attt dzt r rttdz (1) The symbol d means differentiate and r denotes inter- est rate, and a(t) is the stationary process, as well as θ(t) is the non-stationary process, σ(t) means error terms. There are two reasons that BDT model is adopted in this paper. First, due to simplicity of its calibration and straightforward analytic results, its solutions are avail- able and practical in term of business application (Ang and Sherris, 1997). Second, due to arbitrage-free condi- tions, BDT dictates that the means of short rates are im- plied by the term structure of the prevailing Treasury yield curve at the time of valuation. Next I continue to calculate asset and liability cash flows and expenses. For interest sensitive liabilities, this will be a matrix of cash flows, one for each future period of time along each interest rate path. I define the following notations and cash flows. 1 I E denotes initial expense when policy issues, which includes the 1st year maintenance expense (1 M E), front-end loading (1 l) , commission to agents (1) and others (ot) such as premium tax and security fund con- tribution, that is, Cm 11 11 Eot Cm l IE M (2) I P denotes single premium collected. M VA denotes market value of assets. At the point of product pricing and design, the market value of asset is the premium assumed to be received on the product less up-front expenses, 1 *1 M VA IPIE (3) Copyright © 2011 SciRes. ME  J. C. HAO 198 4. Illustrative Outcomes ,ii CV and denotes cash value and credit rate matrix in period i and interest path node j, the cash value in the 1st period ( ,ii CR 1, j CV ) and the following periods ( 1, j CV )are shown in equation (4) and (5), 1, 1 1 jIP CV l (4) ,1, 1 iji jij CV CVCR , (5) In equation (6) and (7), ,ij and ,ij withdraw I nforce denote the withdrawing and inforce policy numbers in period i. ,ij in equation (8) denotes the surrender rate in period i and interest rate path j which is a function of basic surrender rate (()i), which is non-sensitive to credit strategy, surrender charge(i), deviation of company’s credit rate ( ,ij CR ) and market credit rate () and sensitivity factor ( qq BSR SC ,ij MCR s ensitivity ). ,1, , ij ij ij I nforce Inforce withdraw (6) ,1, 1 ijij ij Inforce Inforceqq 1, (7) , ,, min max, 0,1 i ij ij ij i sensitivity qq BSR MCR CRSC (8) Additionally, with i and i SE M Edenoting, surrender expenses and maintenance expenses in period i respec- tively, the liability expected cash flow in period i interest rate node j will be stated in equation (9). ,,1, 1 ,1 , 1 iii jiji i ij iij ECFwithdraw CVSC Inforce withdraw SEME 1 (9) Finally, Determine the spread that, when added to the corresponding treasury rates, will discount the liability and expense cash flows in equation (9) to the market value of assets ( M VA ). This spread is the required spread on asset (RSA). I further measure effective duration as in equation (10) and convexity as in equation (11) to have full scope of interest risk management. I adopt interest path derived from the above BDT model to calculate the original pre- sent value of cash flow, following the interest change of up and down 50bp respectively and recalculate the cash flow. 11 PP PP dP ED dy pPSpPS (10) 2 2 11 E 2 dPd dpdD Cdypdy dypdy PPpp DDP PP PS PS SSP This section deals with empirical results which come from a case study. With term structure downloaded from Gre Tai Security Market as of July 30th of 2009 and flat shot rate volatility assumptions of 9.2%1, I first choose one of the aggressive SPDA issued in January of 2008, that is, the 3rd phase of crediting regulation during which insurer’s discretion on crediting policy is allowed. This SPDA claims its credit rate as of June of 2009 to be 2.2% which is about 130bp more than prevailing 2 year deposit, at the same time, the most aggressive SPDA claims 2.21% which is only 1bp more than our model SPDA. Since the model SPDA issuer ranks middle in term of employees’ size among life competitors, I use the indus- try average as overhead-related expenses parameters which include inflation adjusted surrender expenses, maintenance expenses, underwriting and issuing ex- penses. Other pricing factors which are disclosed on Policy Form include surrender charge, starting with 1.5% in the 1st policy year and decreasing to 0% in the 4th pol- icy year, 2% of up-front loading and 1.25% of compen- sation to brokers. Regulation related expenses include 2% of loading as premium tax and 0.1% of loading as insurance security fund tax. We also include surrender sensitivity of 5 to top on the base surrender rate of 1%. Parameter details are summarized in Table 4. S (11) Table 5 reports the analysis results. As shown in col- umn (1), the required spread on asset is estimated to be 144bp which implied the spread over Treasuries must be earned on the assets in order to satisfy the liability side. This also means all- costs, including expenses and value of the options granted to the policyholder, should be 144bp more than the yield earned from equivalent Treasury cash flows. Column (2) illustrates the marginal effect on RSA of the feature introduced on that line. As shown, 2% of loading in line (4) is not enough to cover cost of 2 year deposit rate plus up-front and renewal ex- penses, and crediting policy of 130bp spread will require another 129.3bp over Treasuries, in line (5), to recoup the liability side. Though the surrender charge in the early years will reduce the RSA by 0.3bp, the reducing benefit is very limited since our model SPDA punishes its policyholders for only 3 years. In addition, the interest sensitive surrender doesn’t add up marginal RSA which is due to the aggressive crediting strategy of model SPDA. Column (3) measures effective duration due to specific feature and totals up to 0.99 which is consistent to current market practice since resetting rates annually will give the SPDA an effective duration which is close to he time to the next rate reset. t 1Flat volatility is estimated from yield of 31-90 days commercial paper as of Jan of 2000 to June of 2009. Copyright © 2011 SciRes. ME  J. C. HAO Copyright © 2011 SciRes. ME 199 Table 4. Insurer-directed spda pricing parameters. Table 5. Risk Measurement for insurer-directed SPDA. In summary, Column (1) of Table 5 conveys the in- formation that investment portfolio dedicated to such products should yield at least 143.5 bp over Treasuries, on a risk option-adjusted basis to break and Column (2) reports marginal required spread on asset for each pric- ing feature, for example renewal expenses on in-force polices requires additional 14.2bp over Treasuries to cover the expenses. Column (3) indicates the effective duration of asset dedicated to such products should be approximate 1. From the Table 5, I observe the challenge of manag- ing interest risk of such interest sensitive products, that is, life firms will bear the interest loss if they choose to match SPDA duration with assets dedicating to, for ex- ample, 1 or 2 years bank deposits, on the contrary, life firms will suffer the duration mismatch risk if premiums from SPDA are dedicated to higher yield assets such as 10 year government bond. But if the issuer is able to re- duce the overhead-related expenses through scale of eco- nomics, then RSA will be expected to be further miti- gated, for example, if we reduce the maintenance ex- penses by NT$100 per policy, then RSA will be down to 135 bp (not reported), this proves the expenses spread can increase the potential profitability. Thus insurers need to come up a strategy to balance sale volume and aggressiveness of crediting policy. Alternatively, if in- surers are able to reduce the unit compensation rate by compensating brokers and agents with better service quality and negotiations, RSA will be effectively reduced as well. I also test another SPDA of same insurer which was issued late 2005 and regulated by cap of 10 year gov- ernment bond yield. The expenses related parameters and other disclosed factors are summarized in Table 6. As shown in Table 6, the old SPDA is sold through bankas- surance channel and compensation rate is set to 1.75%  J. C. HAO 200 Table 6. 10-Year government bond cap SPDA pricing parameters. Table 7. Risk measurement for 10-year government bond cap SPDA. while loading only takes up 1% to attract customers who look for substitute products of time deposit. With more conservative crediting strategy, the RSA over Treasuries is materially reduced to 37bp, and effective duration re- mains about 1.The lower RSA is evidence of the value of the insurance firm’s option- the option to reset rates based on the path of interest rates and the prevailing sur- render charge. But still, what challenge the investment strategy is to balance between interest income and dura- tion matching. In order to further grasp the impact of interest shock on interest sensitive products of life firms, I conduct in- terest sensitive analysis as reported in Table 8. By given the fair value of assets segmented specifically for SPDA, we calculate the present value of projected cash flows with an aggregate discount rate plus up and down 50bp respectively to measure price change on various asset classes. In the meantime, I apply duration and convexity of both SPDA products and measure liability price change as shown in equation (12). As in our model, when interest rate goes up 50bp, the assets, usually with longer duration, will depreciate faster than liability and end up cash shortage. On the contrary, when interest rate goes down 50 bp, the asset and liability of our model company result in 0.9% and 0.5% of appreciation respec- tively. With all the procedures and reported establish, life firm will fully monitor its risk exposure and financial health of issuing interest sensitive products. 2 SPDA Price Change %2 EC ED dydy (12) 5. Conclusions With interest starts to decline in late 1990s, Taiwan in- surers start to issue interest sensitive products to replace the traditional fixed interest life products. Single paid deferred annuities (SPDA) which belongs to interest sen- Copyright © 2011 SciRes. ME  J. C. HAO201 Table 8. Interest sensitive analysis of SPDA. sitive family quickly takes up about 20% of new premi- ums and becomes dominant product in the market. Due to its vital impact on life insurers’ financial status but little literature devoted to risk and profit identification, this paper develops BDT model and optional-adjusted spread analysis model to demonstrate risk measurement procedures and analysis results, with further extension to measure the impact of interest shock on asset liability management of SPDA. As shown in our model, the RSA for aggressive cred- iting strategy requires 144bp while more conservative crediting strategy only requires 37bp and effective dura- tion of both SPDA approximates 1. This implies aggres- sive and conservative products should yield at least 144bp and 37bp over Treasuries respectively, on a risk option-adjusted basis to break even, and the effective duration of asset dedicated to such products approxi- mates 1. The analysis results convey two facts. First, the lower RSA is evidence of the value of the insurance firm’s option- the option to reset rates based on the path of interest rates and the prevailing surrender charge Sec- ond, Challenge of managing interest risk of such interest sensitive products is to dynamically balance the interest income and duration match. Given the common practice of longer asset duration allocation among life insurers, the impact on both sides of balance sheet due to interest shocks are analyzed and reported. Additionally, I also indicate if the issuers are able to reduce the over- head-related expenses, such as maintenance expenses per policy or unit commission rate, through generating large premium volume, then RSA will be effectively mitigated. Not only has this proved the expenses spread can in- crease the potential profitability of SPDA but insurers would need to focus on strategies to balance sale volume and aggressiveness of crediting policy. In all, this paper makes valuable contributions to insurer firms by con- structing an implemenTable model to quantify risk ex- posure and sources of profitability of interest sensitive products. Further research might explore the impact of dynamic reset strategies on RSA, for example to adopt strategy following new money rates less closely instead of 100% pegging new money rate. And other interest generating models could be tried out as well. 6. Reference [1] A. Ang and M. Sherris, “Interest Rate Risk Management: Developments in Interest Rate Term Structure Modeling for Risk Management and Valuation of Interest-Rate- Dependent Cash Flows,” North American Actuarial Copyright © 2011 SciRes. ME  J. C. HAO 202 Journal, Vol. 1, No. 2, 1997, pp. 1-26. [2] M. J. Browne, J. M. Carson and R. E. Hoyt, “Economic and Market Predictors of Insolvency in the Life-Health Insurance Industry,” Journal of Risk and Insurance, Vol. 66, 1999, pp. 643-659. [3] M. J. Browne, J. M. Carson and R. E. Hoyt, “Dynamic Financial Models of Life Insurers,” North American Ac- tuarial Journal, Vol. 5, 2001, pp. 11-26. [4] Colquitt, L. L. and Hoyt, R. E., “Determinants of Corpo- rate Hedging Behavior: Evidence from the Life Insurance Industry,” Journal of Risk and Insurance, Vol. 64, 1997, pp. 649-671. [5] J. D. Cummings and J. Lamm-Tennant, “Capital Struc- ture and the Cost of Capital in Property-Liability Insur- ance,” Insurance: Mathematics and Economics, Vol. 15, 1994, pp.187-201. [6] B. Elijah III, J. M. Carson, E. Elyasiani, I. Mansur and W. L. Scott, “Interest Rate Risk and Equity Values of Life Insurance Companies: A Garch-M Model,” Journal of Risk and Insurance, Vol. 74, No. 2, 2007, pp. 401-423. [7] B. Fisher, E. Derman and W. Toy, “A One-Factor Model of Interest Rates and Its Application to Treasury Bond Options,” Financial Analysts Journal, Vol. 46, No. 1, 1990, pp. 33-39. [8] M. W. Griffin, “An Excess Spread Approach to Nonpar- ticipating Insurance Products,” Transactions of Society of Actuaries, Vol. 42, 1990, pp. 231-258. [9] R. E. Hoyt, “Use of Financial Futures by Life Insurers,” Journal of Risk and Insurance, Vol. 56, 1989, pp. 740-748. [10] H. Z. Huang and Y. C. Lee, “The Risk Management of Interest Rate Sensitivity Policies: Interest Rate Declaring Strategies and Investment Strategies,” Insurance Journal, Vol. 24, No. 1, 2008, pp. 1-28. [11] T. Kleinow, “Fair Valuation and Hedging of Participating Life-Insurance Policies under Management Discretion,” Working Paper, Heriot-Watt University, 2006. [12] A. M. Santomero and D. F. Babbel, “Financial Risk Management by Insurers: An Analysis of the Process,” Journal of Risk and Insurance, Vol. 64, 1997, pp. 231-270. Copyright © 2011 SciRes. ME |