 Journal of Biosciences and Medicines, 2016, 4, 38-43 Published Online March 2016 in SciRes. http://www.scirp.org/journal/jbm http://dx.doi.org/10.4236/jbm.2016.43007 How to cite this paper: Nagayama, K., Tanaka, H., Oshiumi, Y., Shirakigawa, N. and Ijima, H. (2016) 2D Numerical Simulation of Liver Cell Proliferation with Angiogenesis for Hepatic Lobule Formation. Journal of Biosciences and Medicines, 4, 38-43. http://dx.doi.org/10.4236/jbm.2016.43007 2D Numerical Simulation of Liver Cell Proliferation with Angiogenesis for Hepatic Lobule Formation Katsuya Nagayama1, Hiroto Tanaka1, Yuki Oshiumi1, Nana Shirakigawa2, Hiroyuki Ijima2 1Kyushu Institute of Technology, Fukuoka, Japan 2Kyushu University, Fukuoka, Japan Received 20 October 2015; accepted 10 March 2016; published 17 March 2016 Abstract The liver has the ability to reform and regenerate in our body. However, the mechanisms of re- formation or regeneration of the liver have not been elucidated. In this study, we propose an analysis model using a Particle Model to elucidate the mechanism of liver formation. The object of analysis is a hepatic lobule, which is the basic component of the liver. First, a 2-dimensional cell proliferation around one blood vessel was modeled. Second, angiogenesis was added and consi- dered. And finally, the model was applied to the hepatic lobule and the 2D formation of the hepatic lobule was revealed. We used experimentally derived parameters such as diffusivity, oxygen con- centration, and oxygen consumption of a cell. The model will be expected to facilitate in develop- ing tissue-engineered liver using regenerative medicine technology. Keywords Particle Simulation, Liver Proliferation, Angiogenes i s 1. Introduction The liver is the main organ of metabolism. Serious loss of liver function may prove fatal. Moreover, the liver is has the ability to reform and regenerate in our body. Recently, the prevalence of viral hepatitis patients has been increasing. Therefore, the reconstruction of liver based on tissue engineering has attracted attention [1]. Howev- er, the formation or regeneration mechanisms of the liver have not been elucidated; therefore, practical regener- ative medicine technology based on tissue engineered liver has not been accomplished. Through this research, we aim to construct models of cell proliferation and angiogenesis using a Particle Model and elucidate the me- chanism of the formation of liver. We set parameters and aimed to find out information from ideal experimental conditions, which we could analyze and provide to researchers. This would permit further calibration of the model and subsequent experiments. We focused on the hepatic lobule [2], which is the basic component of the liver. As shown in Figure 1, the shape of a hepatic lobule is a hexagonal prism and a sectional shape of this is a hexagon. It has portal veins at 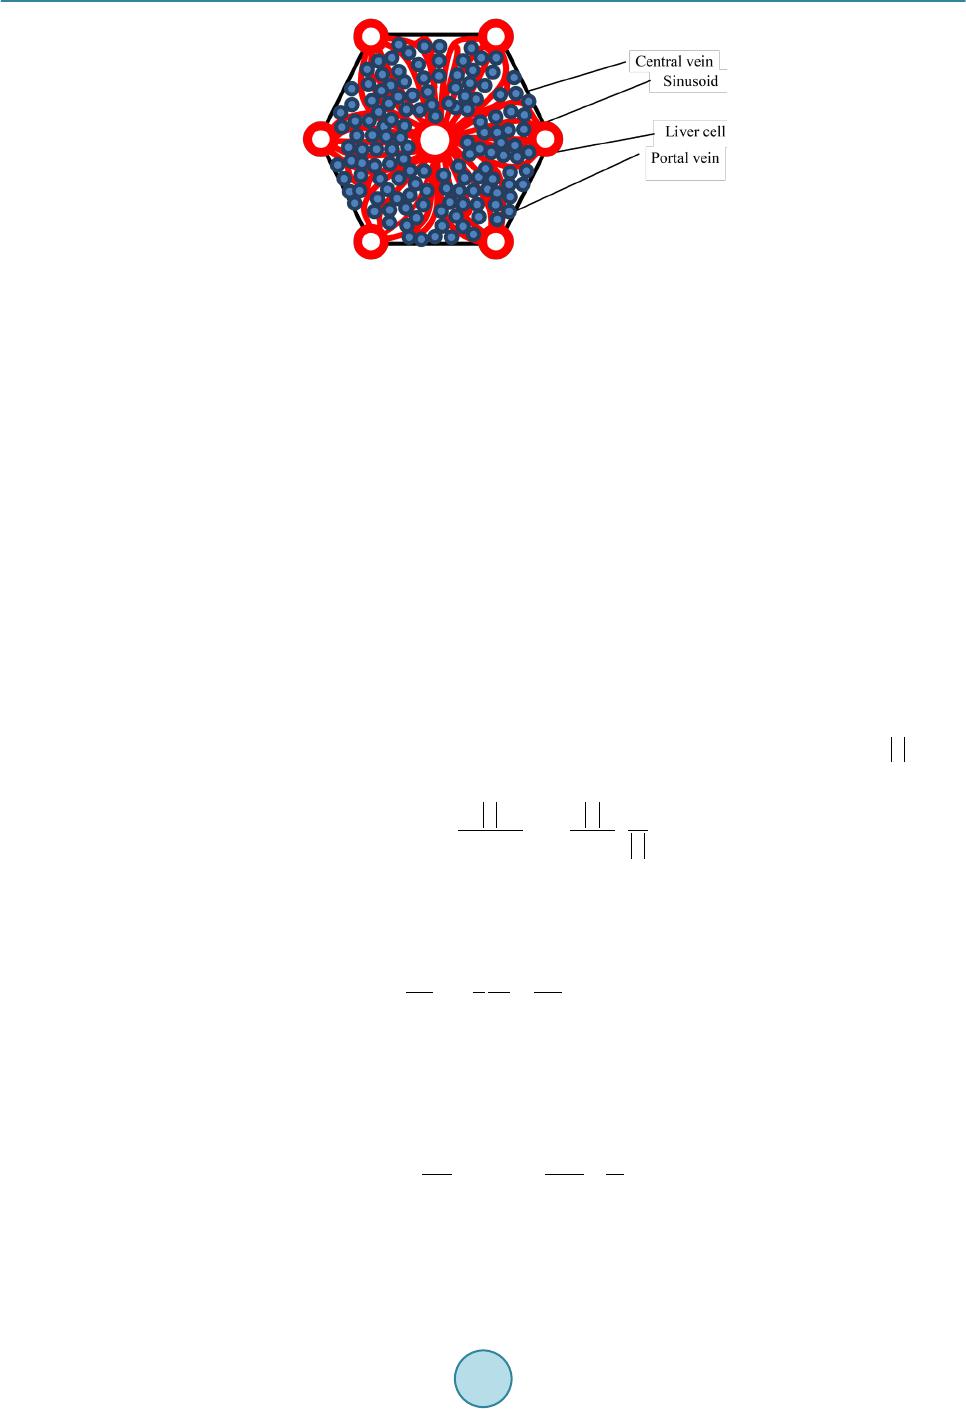 K. Nagayama et al. Figure 1. Hepatic lobule. six vertices and a central vein at the center. Moreover, sinusoids (capillaries) exist between the six portal veins and the central vein. Liver cell proliferation is stimulated through oxygen diffusion from the sinusoids to liver cells. Liver cells are present in rows radiating out from a central point. Thus, they have a characteristic harness structure. Numerical simulations of the hepatic lobule were conducted [3] but there are no examples of numeri- cal simulations including angiogenesis. In this study, we focus on a two dimensional hexagonal area as a refer- ence shape of the hepatic lobule. 2. Model Description We used a Particle Model as an analysis model. The Particle Model is based on the Lagrange method, which is a numerical simulation method using calculation points that assess physical quantities and movement. Each par- ticle (calculation point) has a physical effect on others. Weuseda Particle Model in simulations of cancer growth [3], skin formation, and hair formation [4] [5]. In this study, we used it for numerical simulation of liver forma- tion. We used two types of particle to represent a liver cell: a liver cell particle and a liver cell particle including blood vessels in this numerical simulation. Therefore, the diameter of a blood vessel is a virtual parameter and does not influence inter-particle force. The inter-particle distance for this numerical simulation requires it to be longer than the reference distance because a particle will stabilize as the densest structure from the arrangement. This is why liver cells have a hexagonal structure. By using the packing ratio of 0.741 for hexagonal structure, inter-particle force F is signified as the following (Equation (1)). k is the inter-particle coefficient. is the target particle distance from reference particle. dr is the reference inter-particle distance. 11 1.106 1.5 kdr dr =−− rr r Fr (1) In the model of oxygen diffusion from blood vessels, we can approximate the oxygen diffusion equation (Eq- uation (2)) using a center difference method. However, we calculate oxygen diffusion using one step as a state of equilibrium. M0 is the oxygen consumption rate. ρ is liver cell density. D is the oxygen diffusion coefficient. 0 1CC Dr M trr r ρ ∂ ∂∂ = − ∂ ∂∂ (2) Moreover, we calculate analytical solution from the oxygen diffusion equation by Equation (3) to verify whether numerical solutions of discrete equations on numerical simulation correspond to the analytical solution. R is the maximum range of oxygen diffusion distance. r0 is theminimum range of oxygen diffusion distance and the radius of an element of a blood vessel. ( ) 2 22 0 0 ln 1 42 r R C rr D Dr αα = −++ (3) Reconstruction of the cell survival area by oxygen depletion is the most serious problem in liver cell prolife- ration technology development. Therefore, it is necessary to extend the cell survival area by angiogenesis. So far, we postulated that sinusoid form in the direction of oxygen concentration is low. However, we are not able to 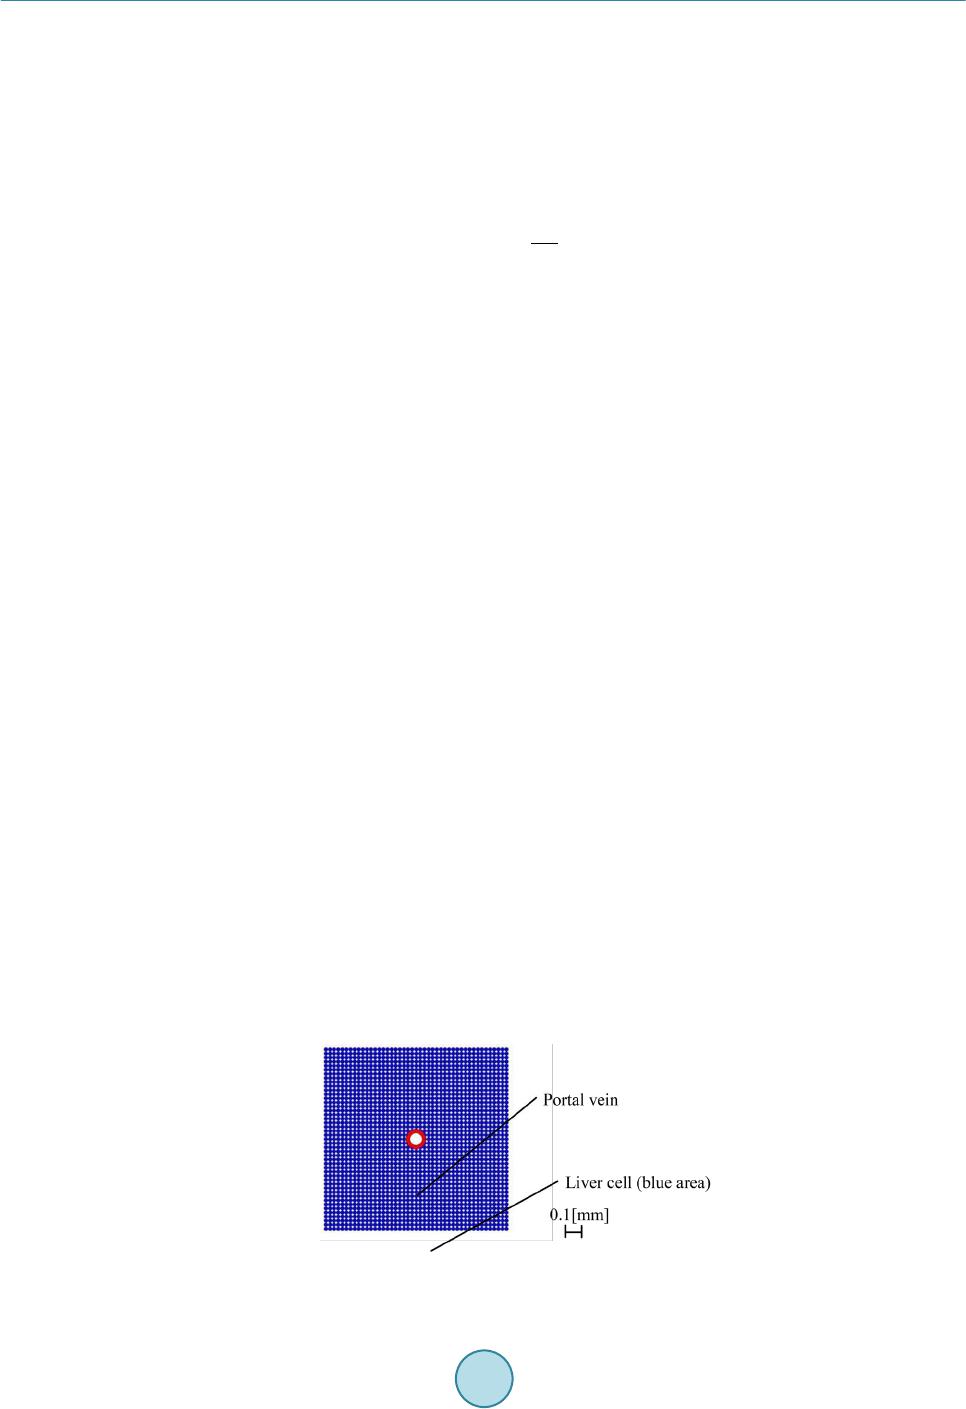 K. Nagayama et al. accurately simulate the characteristic liver cell harness structure (Figure 1) between a portal vein and a central vein through assumptions. The harness structure is an important factor of hepatic lobule modeling. However, it is difficult to describe the exact equations of angiogenesis because the mechanism is unknown. Consequently, the characteristic shape of sinusoids between portal veins and a central vein is qualitatively similar to that which is streamlined and is considered to “so urce” and “suction” ideal fluid through fluid dynamics. This is why we speculate that an equation describing angiogenesis corresponds to Equation (4) (Equation (4)) of complex veloc- ity potential [6] and attempts to model angiogenesis. W is complex velocity potential, Q is the amount of blood flow, z is complex coordinate in the following equation. (4) Moreover, we used extension and divergence of blood vessels and stimulate tissue construction in the large area. In this report, we add concourse and regression of blood vessels to optimize blood vessel structure. Sinu- soids repeat extension, divergence and concourse. In the end, this reaches a central vein. However, when exten- sion and concourse does not happen, the blood vessel regresses. We calculated numerical simulations of liver cell proliferation and angiogenesis on the hexagonal area as a sectional shape of a hepatic lobule. We repeated calculations of a ngiogenesis, liver cell movement, liver cell death, liver cell growth and oxygen diffusion. 3. Calculation Conditions We divided analysis conditions into three steps. First of all, we detailed the condition of oxygen diffusion model around a portal vein. Second, we detailed the condition of angiogenesis model around a portal vein using com- plex velocity potential. Finally, we detailed the condition of a hepatic lobule formation model including complex velocity potential and angiogenesis. In our research, we consider a liver cell of the diameter 20 µm as a particle and calculate using this parameter. 3.1. Around One Blood Vessel Analysis area comprised two dimensions of 900 [µm] × 900 [µm]. We put a portal vein of diameter 100 [µm] at the center and liver cells around the portal vein. Oxygen consumption rate was defined as M0 is 4.0 × 10⁻¹⁶ [mol/(s∙cell)] [7]. Liver cell density was defined as ρ is 1.25 × 10⁸ [cells/cm3] [8]. Oxygen diffusion coefficient was defined as D is 2.1 × 10⁻¹⁶ [cm2/s] [7]. Figure 2 is the initial state of the two dimensional model. Moreover, oxygen saturation concentration 2.0 × 10⁻⁷ [mol/cm3] was treated as dissolved oxygen concentration on the sur- face of a blood vessel and is represented by a dimensionless number 1. Sinusoids form in the direction of the liver cell. We set a threshold 0.1 of oxygen concentration, where sinu- soids can form in the direction. We detailed the analysis condition. Sinusoid form velocity was less than 30 [μm/day]. Blood vessel divergence distance wa s less than 30 [μm/day]. Blood vessel extension angle was from 0˚ to 45˚. Blood vessel divergence angle was from 70˚ to 90˚. The number of divergences was less than two. The frequency of divergence was by 40 [µm]. T he extension of blood vessels depends on complex velocity potential. The divergence of these depends on oxygen dissolution concentration. Moreover, a blood vessel linked with another blood vessel when another blood vessel existed near the forming blood vessel. We calculated that there was blood vessel atrophy and optimized when the above extension, divergence and concourse had not happened. Figure 2. Initial state of one blood vessel. 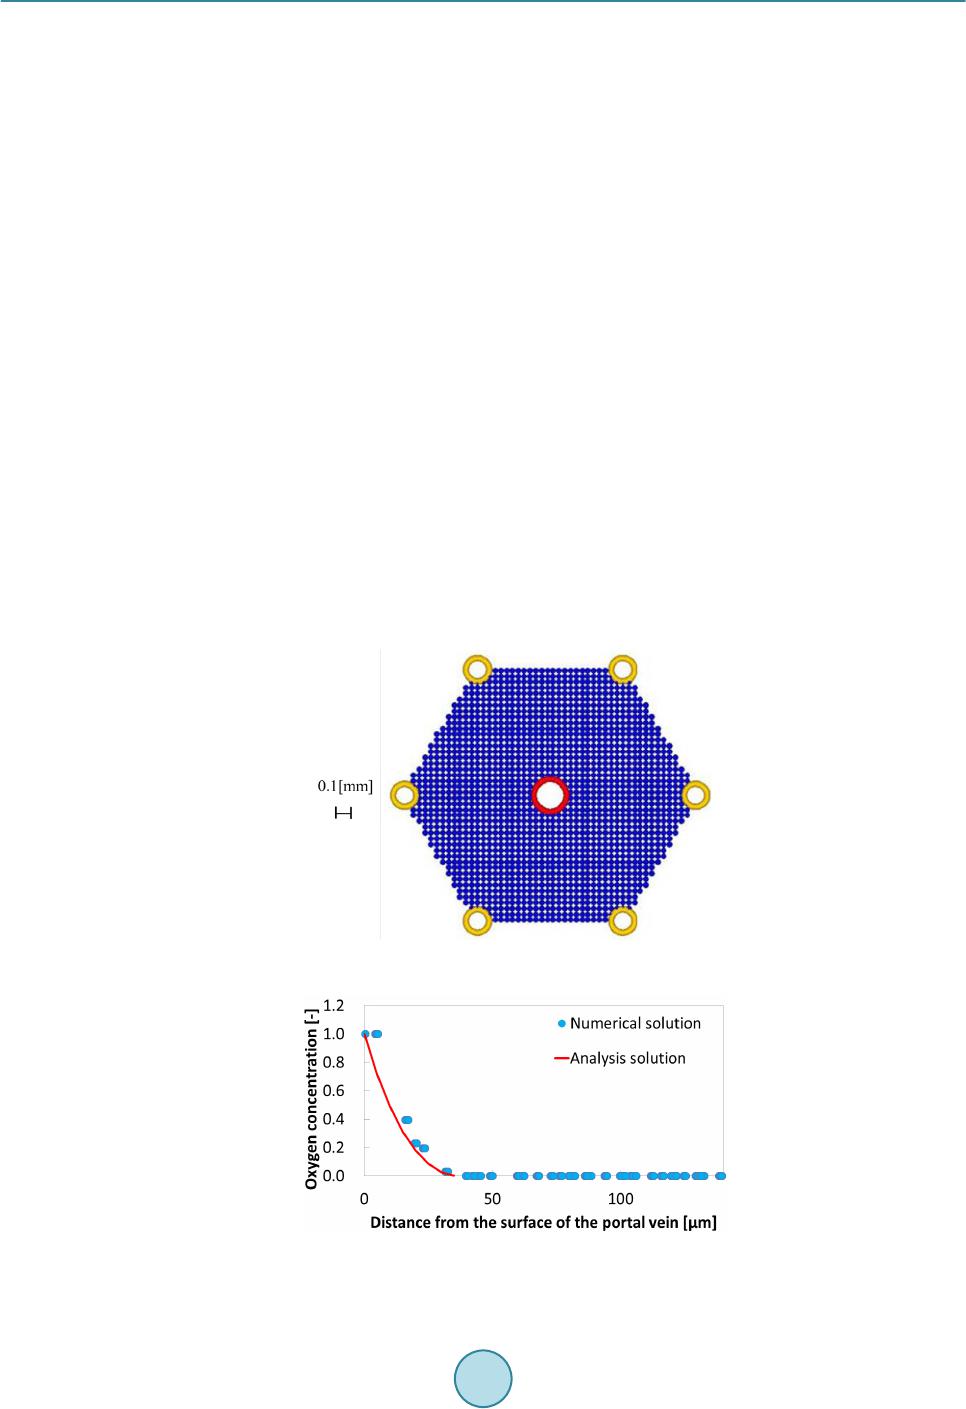 K. Nagayama et al. 3.2. Hepatic Lobule The analysis area was the shape of a hexa gon (Figure 3), which simulates the sectional shape of a hepatic lobule. The distance between portal veins which are located diagonally was 1.0 [mm]. We put portal veins of diameter 100 [µm] at six vertices. We put a central vein, whose diameter was the root of two times that of the portal vein diameter, at the center. Moreover, we placed liver cells around the portal veins and a central vein. We indicated “sour c e ” and “suction” for portal veins and a central vein. The angiogenesis area was regular, and we could cal- culate velocity vectors although each center of the portal veins and a central vein was a singular point. From the relationship of continuity equation on fluid dynamics, we set the amount of flow to three for each portal vein and set the amount of flow to negative six for a central vein. We made two assumptions about liver cell growth and death depending on oxygen dissolution concentration. Cells supplied with oxygen divide periodica lly and cells whose oxygen concentration is 0, die. Moreover, when a liver cell is surrounded with fixed numerical liver cells, it does not grow any more due to contact inhibition phenomenon. Liver cell dividing time was 26 hours assuming a fetus liver. The oxygen concentration of cell death was 0.001. The contact inhibition was more than 8. We set cells moving on this calculation. Clock time was 1 minute. Oxygen concentration threshold was 0.1. 4. Results and Discussion 4.1. Oxygen Diffusion around One Blood Vessel without Angiogenesis We verified oxygen diffusion using the model of a portal vein of diameter 100 [µm] at the center of the analysis area. Oxygen diffused co ncentrically from the portal vein. Oxygen concentration was more than 0 in the area of about 40 [µm] from the surface of the portal vein. Oxygen diffusion analysis was appropriate because numerical solutions corresponded with analytical solutions (Figure 4). As a result, we showed that liver cells around the blood vessels are alive. Therefore, liver cells kept increasing until the area in the vicinity of blood vessels is saturated with liver cells. In other areas, liver cells died because of oxygen loss even if initial liver cells density was different. Figure 3. Initial state of a hepatic lobule. Figure 4. Comparison between numerical solution and analytical solution. 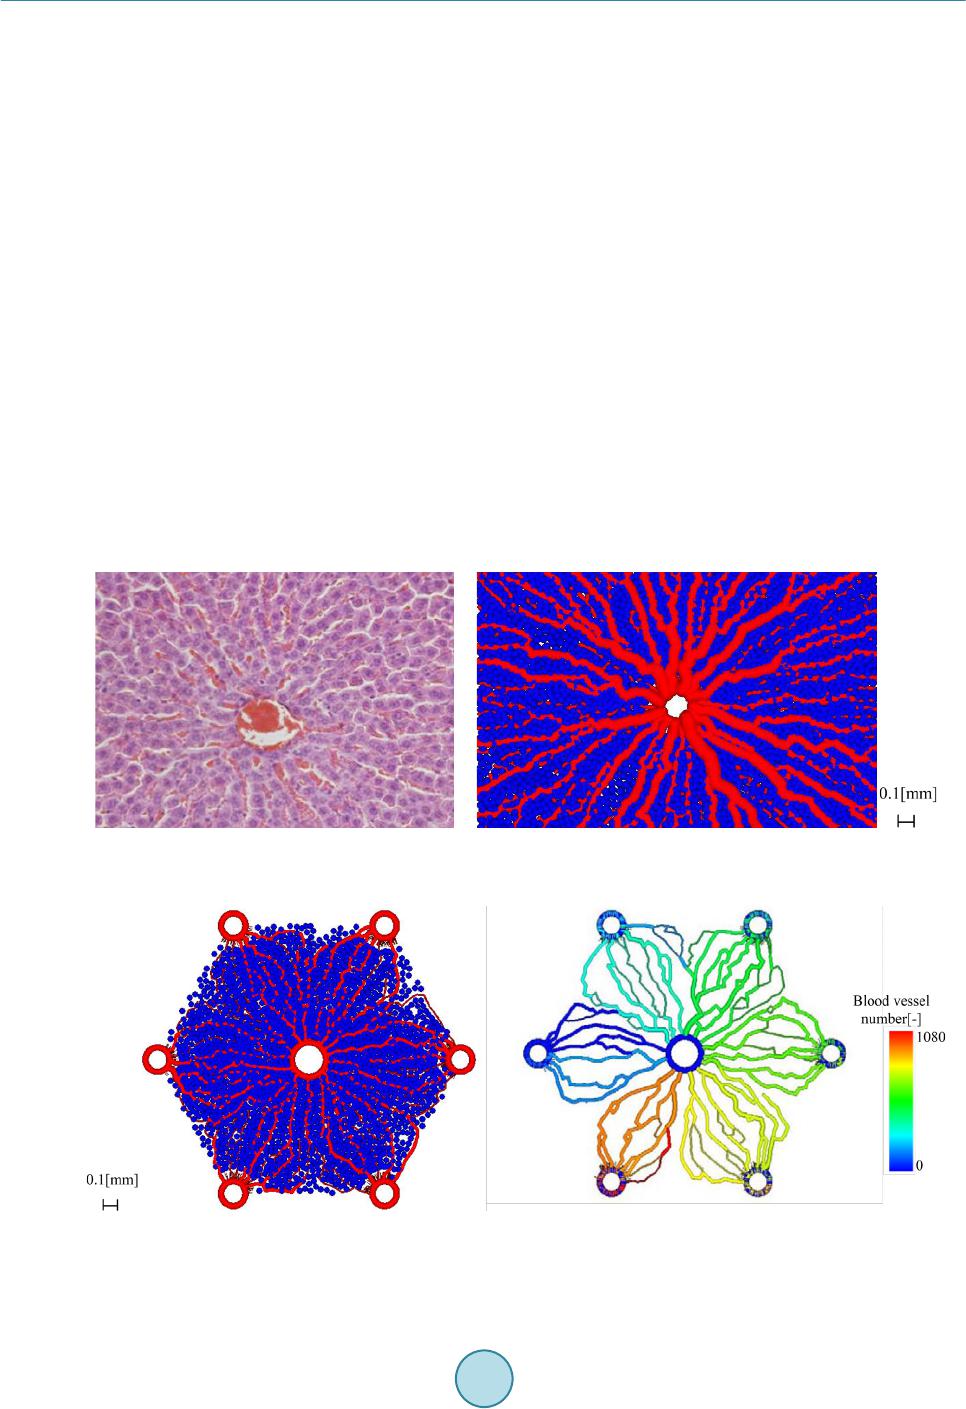 K. Nagayama et al. 4.2. Angiogenesis from One Blood Vessel We calculated extension, divergence, concourse and regression of blood vessels from a portal vein (F ig ure 5). Oxygen was supplied to liver cells and liver cell growth was stimulated by angiogenesis. As a result, liver cells increased over a wide range, and tissue constructed was able to form harness structures. 4.3. Hepatic Lobule Formation We integrated the above inter-particle force, particle movement, the oxygen diffusion model and the angiogene- sis model, and calculated the hepatic lobule formation model. We obtained a result of the harness structure which was qualitatively similar to real phe nomena by angiogenesis of complex velocity potential (Figure 6(a)). Sinusoids repeated divergence and concourse. After that, oxygen was supplied inside the hepatic lobule and tis- sue was constructed. Figure 6(b) shows only blood vessels. We calculated diameters of sinusoids from the amount of flowing blood in sinusoids. Two blood vessels which were at adown stream direction from a diver- gence point of a blood vessel, got thinner than the blood vessels which were in the upstream direction of a di- vergence point. On the other hand, the amount of flowing blood through a blood vessel which is downstream from a concourse point was the sum of the amount of flowing blood of two blood vessels which were upstream this side of the c onc ourse point. T he total amount of flowing blood from portal veins corresponded with (The total amount of blood flowing on the top of the sinusoid) + (The total amount of blood flowing into the central vein) for each step. This is why there is no contradiction with respect to the diameters of sinusoids and the amount of flowing blood at every sinusoid. This is why it was possible qualitatively to make the assumption of angiogenesis on the modeling of tissue reconstruction. (a) (b) Figure 5 . Sinusoids around a portal vein; (a) Real image; (b) Simulation result (Blue: Liver cell, Red : Blood vessel). (a) (b) Figure 6. Results of 2D hepatic lobule formation; (a) Liver cell proliferation and angiogenesis, (b) Angiogenesis; (Blu: Liver cell, Red : Blood vessel).  K. Nagayama et al. 5. Conclusion In this study, we created an analysis model using a Particle Model to elucidate the liver formation mechanism. The object of analysis is a hepatic lobule which is the basic component of the liver. First, 2D cell proliferation around one blood vessel, with oxygen diffusion and consumption, was modeled. The results of oxygen distribu- tion of the numerical simulation agreed with that of the analytical solution. Second, angiogenesis was added and considered. The liver tissues proliferated in a wide range around a portal vein through angiogenesis. Finally, the model was applied to the hepatic lobule and the 2D formation of the lobule was revealed. The simulation results qualitatively corresponded to the actual phenomena of cell proliferation and liver tissue construction. In future, the model may help in developing tissue-engineered liver using regenerative medicine technology. References [1] Sh i raki gawa, N., Ijima, H. and Takei, T. (2012) Decellularized Liver as a Practical Scaffold with a Vascular Network Template for Liver Tissue Engineering. Journal of Bioscience and Bioengineering, 114, 546-551. http://dx.doi.org/10.1016/j.jbiosc.2012.05.022 [2] (2015) Science Daily. htt p:/ /www.s cienced aily.co m/rel eases / [3] Nagayama, K., Nitta, J. and Miura, I. (2009) Numerical Analysis on Angiogenesis in Cancer Using a Particle Model. Theoretical and Applied Mechanics Japan, 58, 321-32 4. [4] Nagayama, K., Matsuoka, S., Morisaki, N. and Taguchi, H. (2015) 3D Numerical Simulation of Hair Formation Process Using a Particle Model. Open Journal of Regenerative Medicine, 4, 1-5. http://file.scirp.org/Html/1-2390044_53849.htm http://dx.doi.org/10.4236/ojrm.2015.41001 [5] Nagayama, K., Uehara, T., Amano, Y. and Tanahashi, M. (2015) 3D Numerical Simulation of Epidermal Skin Turno- ver Process Using a Particle Model.Journal of Biosciences and Medicines, 3, 45-49. http://dx.doi.org/10.4236/jbm.2015.3300 7 [6] Hideo, O. (1982 ) Fluid Mechanics(1). Japan, Corona Publishing Co., Ltd., 118. [7] Ijima, H., et al. (1998) Hepatocyte Spheroids in Polyurethane Foams: Functional Analysis and Application for a Hybr- id Artificial Liver. Tissue Eng., 4, 213-226. http://dx.doi.org/10.1089/ten.1998.4.213 [8] Fanny, E., et al. (2010) Spontaneous Formation of Highly Functional Three-Dimensional Multilayer from Human He- patoma Hep G2 Cells Cultured on an Oxygen-Permeable Polydimethylsiloxane Membrane. Tissue Eng., 16, 311-318. http://dx.doi.org/10.1089/ten.tec.2009.0042
|