 Journal of Power and Energy Engineering, 2016, 4, 1-12 Published Online February 2016 in SciRes. http://www.scirp.org/journal/jpee http://dx.doi.org/10.4236/jpee.2016.42001 How to cite this paper: Wei, X.X., Liu, J., Wei, T.Z. and Wang, L.R. (2016) High Proportion Renewable Energy Supply and Demand Structure Model and Grid Impaction. Journal of Power and Energy Engineering, 4, 1-12. http://dx.doi.org/10.4236/jpee.2016.42001 High Proportion Renewable Energy Supply and Demand Structure Model and Grid Impaction Xiaoxia Wei1, Jie Liu2, Tiezhong Wei2, Lirong Wang2 1State Grid Energy Research Institute, Beijing, China 2Heilongjiang Grid Company, Harbin, China Received 9 November 2015; a ccep ted 15 February 2016; published 18 February 2016 Abstract In considering of high proportion of renewable energy supply in 2050, the accelerating of energy consumption gross, source and environment can affect the energy system restrict affection are stronge r. Add wind and solar to electricity energy with large amount of energy source exploitation. The energy source amount per person is lower. Considering the renewable energy amount and supply, primary energy storage and structure problem is standing out. Before the wide spread of renewable energy, Using the high-carbon energy in China can pollute seriously. Chinese energy supply and demand problem is research key point. This paper researches Chinese energy supply and demand pattern system and evaluation methodology, gives out the inner and outer influen- cing elements. And evaluate Chinese energy supply and demand pattern from energy gross, struc- ture, distribution and transportation. U se energy supply synthesize radar comparison chart in certain time period. From energy security, economy, clean and efficiency, analyze the benefit comparisons of Chinese energy supply and demand pattern. This energy supply and demand pat- tern model will give one certain theoretical analysis and practice reference to the further high proportion of renewable energy. Keywords High Proportion of Renewable Energy Supply, Inner and Outer Element, Power Grid Affection, Supply and Demand Pattern 1. Introduction Energy is the fundamental element of modern civilization. From all countries development practice, the speed and degree of country and regional economic development is depending on modern energy supply guarantee system’s ability and construction. As the maximal developing country, China attracted worldwide attention and most support from the energy system development. Energy is one of the fundaments to guarantee Chinese na- tional economy sustain, stabilization, sound development, which is also one of the implement comprehensively, coordinately, sustainably. So strength our country energy supply and demand scientific analysis, its advanced  X. X. Wei et al. management theory method research, have quite strong reality backgrounds (Sarak H. & Satman A. 2003. Ba- laehandra R. & Chan Du. 1999. Kumar A. & Bhattacharya S. C. & Pham H. L. 2003. Mackay R. M. & Probert S. D. 2001) [1]-[4]. Energy supply and demand is the key topic, confronting with new situation. High proportion of renewable energy supply has being considered in the ten to thirty years, affect the Chinese electricity energy supply and struc ture . (a) In China, until 2030, coal usage will be the fundamental electricity energy in long period of time, coal transportatio n and coal power layout optimization are much more impendency. Parts of coal producing area are approaching to the science capacity. The receiving port power source construction is extruding power transpor- tation space. Make the coal and power have little configuration space. (b) In China, natural gas and import scale expect have rapid growth; shale gas is changing the world using gas condition. Distribution energy sources are changing the world power configuration, affect the power grid struc- ture. (c) Renewable energy’s economic development and efficient utilization should be solved. In further, the re- newable energy will be accelerated to the power generation energy supply. To wind, the abandon wind is one extrude problem. Wind basement exploit is suffocated. Disperse exploit cannot support goal. While to the solar energy, the large occupation land and low utilization time will affect the renewable energy efficiency and economy. (d) International energy cooperation and global energy configuration promising are further infection. Energy consumption is approaching to the energy supply border. So it needs to layout Chinese power supply economi- cally, stabilization, reliably under the global vision. And China is giving the new theory to establish global energy connection. This paper analyzed the energy supply’s new circumstances and key problems. Make the energy supply and demand structure as key line of current and future situations. Make the research in different views (Messner S. & Schrattenholzer L. 2000. Ediger V. S. & Tatlidil H. 2002. Cuaresma J. erespo & Hlouskova J. & Kossmeier S. 2004. Sharma D. P. & Chandramohanan Nair P. S. & Balasubramanian R. 2002) [5]-[7]. (a) Assessment indicator system of energy supply and demand. Describe energy supply pattern and evolution. Evaluate security, economy, clean and efficiency. (b) Evolution characteristics of our energy supply and demand pattern. Research on Chinese energy develop- ment in analysis of the layout and project. And give out the long term energy changing pattern. (c) Research on the power grid function and affection to the energy supply and demand. 2. Indicator System of Energy Supply and Demand Pattern 2.1. Key Element of Energy Supply and Demand Pattern Energy supply and demand is focusing on whole country and different regions energy resource, producing, transportation, consumption, import and different energy in separating region balancing, trans-regional trans- portation condition. Evolution of energy supply and demand pattern is the track of different period of energy quality and quantity development. The key element of energy supply and demand pattern is gross, structure, dis- tribution and transportation. Energy transportation includes variety, scale, direction and distance. 2.2. Indicator System of Energy Supply and Demand Pattern Allocating the energy situation is one of important foundation to scientific judge energy management. This re- search area is lacking quantification description and evaluation method. Normally, it uses the perceptual know- ledge and historical experience to judge energy distribution condition. The analysis method is urgent technical problem. This paper gives the energy distribution affection evaluation indicator system, carries out the demon- stration evaluation. Strive to quantity and demonstrate energy distribution affection and breaking through. Energy distribution affection and evaluation system include security, economy, clean and efficiency four as- pects. Every aspect includes several support indexes. In order to embody power function to energy distribution, the support indexes include power sector and its index of correlation. The support index and its choosing are following the authority theory. In the security evaluation aspect, the support indexes include energy reserves, foreign-trade dependence, coal railway transportation channel and its  X. X. Wei et al. transportation use ration, coal-power transportation system reliability. In economic evaluation aspect, the sup- port indexes include coal and coking industry and its ex-factory price indices of industrial product, oil and gas producer’s price for manufactured products, fuel power purchase price indices, and power producer’s price for manufactured products. In clean evaluation aspect, the support indexes include clean energy ration to primary energy consumption, sulfur dioxide discharge strength, sulfur dioxide discharge value, environmental pollution control investment ration to GDP, clean energy generate electricity ration and other indices. In the high effective aspect, the support indexes include energy loss per GDP, energy processing and transforming efficiency, power energy ration to terminal energy consumption (Persaud A. J. & Kumar U. 2001, Chow L. C. H. 2001) [8] [9] (Figure 1). 2.3. Evaluation Methodology of Energy Supply and Demand Pattern Energy distribution and affection evaluation can adopt the main element analysis method (PCA), through cova- riance matrix feature vector can reveal the common evolvement role, which can reach the index goal without considering man-made thinking. The main element analysis (PCA) include three steps, the first step is construct the covariance matrix accord- ing to the random vector. The second step is solving the covariance value of matrix, and judge the contribution degree, confirming the main element. The third step is construct and solve the synthesize vectors using main element proper vector. This research get one certain year as the base, made the base year’s every prospect synthesize indexes evalua- tion score as ten points. Considering all aspects of synthesize indexes historical development and further trend, making the equal synthesize indexes to scale in one degree, get the historical and further degree evaluation de- scription. This system adopts radar plot to descript the whole system synthesize evaluation and it can be viewed the relative development and changing trend from the line and scale (Figure 2). 3. Relative Important Problem of Chinese Energy Distribution and Supply Demand Energy supply and demand pattern is one big and comprehensive system. This system has different aspects. The inner elements affect the outer elements. This research combines the pattern time and space changing analysis, through the energy different elements (Bentzen J. & Engsted T. 2001. Finon D. 1976. Van der Voot E. 1982. Eltony M. N. & Al-Mutairi N. H. 1995. Ramanathan R. 1999) [10]-[14]. Figure 1. Energy distribution affection and evaluation system. Energy distribution affection and evaluation system with high proportion of renewable energy supply securityeconomicclean efficiency •energy reserves •foreign-trade dependence •coal railway transport channel utilization •coal-power transportation system reliability •gas transport channel utilization •coal and coking industry and its ex-factory price indices of industrial product •oil and gas producer’s price for manufactured products •fuel power purchase price indices •power producer’s price for manufactured products •clean energy ration to primary energy consumption •sulfur dioxide discharge strength •sulfur dioxide discharge value •environmental pollution control investment ration to GDP •clean energy generate electricity ration •renewable energy use efficiency •energy loss per GDP •energy processing and transforming efficiency •power energy ration to terminal energy consumption  X. X. Wei et al. Figure 2 . The comprehensive evaluation plot . 3.1. Energy Supply and Demand Inner Element The inner elements of power supply and demand pattern include four parts. In this research, we consider coal, natural gas, water, nuclear, wind, solar and international power cooperation. These parts are considering the power resources, supply ability, power consumption and transportation (Table 1). In China, the most popular energy resources are coal, natural gas and wind, to solar energy, which is using in the distributed area now. The solar is the main energy in the further usage. Coal is the most important energy to China. To the world coal, Chinese coal reserve is low and difficult to ex- ploit. If we consider the resource amount, mining condition, environment, water resource, transportation and security, China coal maximum exploitation amount is 41 billion tons/year. From 2009, Chinese coal import has increased 160%, and becomes the No.1 of the importing coal countries. In the further, railway and water trans- port will enlarge the scale. China will spread its coal move from the west to the east, which can satisfy the need of the economy. Also consider the Ultra-high voltage power grid, it can also increase the coal usage ratio. Natural gas importing and producing are accelerating rapidly. It is changing the energy consumption condi- tion. In china, natural gas can be imported through gas loop and LNG, from 2010 to 2014, the natural gas trans- portation is reaching 1370 billion steres, gas pipeline is 4.4 ten thousand kilometers, reserve gas ability is 210 billion steres/year. Big gas power generation and distribution gas system is the main type of gas usage. And from the using type, the distribution is most effective. From the cost of generation, the combined cycle is lowest. From the savage of generation, single loop has the fast adjustment. Water is influenced by weather and season condition, according to the survey and draw data, chinses water installed capacity will be saturation in 2035. Then part of water installed capacity will be the basis capacity of the power supply. Pumped-hydro energy storage will be peak load regulation. Nuclear is the restricted energy in certain period of exploitation time, China is focusing on its serious affec- tion to human and environment, and its will be basis energy capacity. Wind generation is facing two key problems, one is abandon wind and the other is lack of fund. Actually, in china, we have several different wind exploitation and usage methods, such as basement plus local consumption, distribution exploitation, basement plus combine output and basement plus wind as the main output. Wind gen- eration is most popular energy usage in china, we adopt demand side management, power adjustment, optimize power operation and strengthen the output passage way to increase the wind energy consumption. Solar generation will be the main renewable energy in the next thirty year, it has wide power supply. Now it is transforming into the thermoelectricity. coal railway transport channel utilization gas transport channel utilization coal-power transportation system reliability coal and coking industry and its ex-factory price indices of industrial product oil and gas producer’s price for manufactured products fuel power purchase price indices power producer’s price for manufactured products clean energy ration to primary energy consumption sulfur dioxide discharge strength sulfur dioxide discharge value environmental pollution control investment ration to GDP clean energy generate electricity ration renewable energy use efficiency energy processing and transforming efficiency power energy ration to terminal energy consumption  X. X. Wei et al. Table 1. The inner element of power supply and demand pattern. Coal Sustainable supply ability Coal transportation ability Coal to power transportation ratio Coal power distribution space Water resource supply ability Natural gas Supply and demand trend Gas generation type Water Supply and demand and in 2035 to saturation Pumped-hydro energy storage regulation Nuclear Stable development with conservatism Wind Development model and choose Programmer target and distribution Solar Development model and choose Programmer target and distribution International power cooperation Resource around of surrounding countries Developing potential of international energy basement Prospect cooperation of international power International power cooperation of China is near to the Russia, Mongolia, Kazakhstan and other countries, which have wide spread area and plenty of source can be used by China. Russia has plenty of coal, oil and natu- ral gas reserves. Mongolia has coal, wind, solar reserves. Kazakhstan has amount of fossil energy. In the further, China will make high voltage transmission to transport energy, which will reduce the discharging and energy import. 3.2. Energy Supply and Demand Outer Element Economy affects energy usage, and imposing the energy development. Energy usage guarantees Chinese long -term of economy accreting. At the same time, Chinese fast economy increasing is the main impetus. To the investment, energy consumption and investment have opposite direction, the investment and its policy will af- fect the energy usage. The industrial structure and household consumption can determine the energy demand structure, with the industrial structure adjustment, the synthesize indexes will be changed, which can determine the regional economy development. In the further, the east part of China is still the most develop part and its energy consumption will be ahead. Society part includes population gross, urbanization and whole people energy saving consciousness. Energy consumption has positive relation with population gross, changes the usage type. The urban is the main energy consumption places. Policy part includes guidance quality and low carbon environmental protection property. The energy strategy in China is now focusing on energy management, reserve, market competition and clean energy development, which are very important to country energy strategy. The constraint, inducing and stimulating policies are in- ducing the further energy development and its trend. The low carbon and environmental policy can also improve and enhance energy consumption structure (Samimi R. 1995. An Bentzen & Tom Engsted. 2001) [15] [16] (Ta- ble 2). International part includes energy market fluctuations price and finance crisis. From the world energy market view, the low energy price can affect the produce profit and less the replacement chasing trend. The high price will accelerate the industry producing cost and salesmen price, and it will affect the energy consumption. The  X. X. Wei et al. Table 2. The outer element of power supply and demand pattern. Economy GDP Investment Resident consumption Industrial structure Regional economic development Society Total population Urbanization process National energy saving awareness Policy Oriented policy Low carbon, environmental protection policy International International energy market price fluctuations Finance crisis finance crisis will also push the real economy, lead to its recession, reduce the energy demand (Wankeun Oh& Kihoon Lee. 2004. George Hondroyiannis. 2004. Khalifa H. Ghali& EI-Mutairi M. I. T. 2004) [17]-[19]. 4. Prediction of Energy Supply and Demand Pattern Evolution Trend in 2020 4.1. Energy Gross Evolution In the further, Chinese energy power consumption demand will accelerate fast. The 12th Five-Year Plan, the annual average increases 5.0%, The 13th Five-Year Plan, the average will be 3.4% in prediction. The power consumption demand is synchronized with energy consumption demand. At the same time, with the fast development of renewable energy, power is standing out in energy system consumption demand, the power consumption speed increase is faster than energy consumption speed. 4.2. Energy Structural Evolution (1) With the fast acceleration of energy supply structure and its clean adjustment, natural gas and non-fossil energy and power ration has fast acceleration. From the primary energy consumption structure, coal consumption to energy consumption gross proportion will be 57% in 2020, and its decreasing amplitude is 12%. Natural gas consumption ratio will accelerate 9% un- til 2020. The non-fossil energy ration will reach to 15% in 2020. The renewable energy of electricity power generation to primary energy will be nearly to 80%. From the power installation structure, coal installation ration will reduce to 54.1% in 2020. The gas power generation installation ratio is 5.7% in 2020. The clean installation ratio will reach to 40%. (2) Energy supply structure will have obvious diversification trend, in the further, energy supply will combine with civil fossil energy, civil clean energy and foreign import to China. In statistics from 2010 to 2020, China’s new primary energy consumption is 16.6 billion tons standard coal. Chinese fossil energy newly increased supply is 16.1 billion tons standard coal. And the newly increased clean energy supply is 4.4 billion tons standard coal. The foreign import newly increase energy supply is 6.1 billion tons standard coal. (3) Energy distribution electrification degree will increase, power is the prominent in energy distribution. From the energy conversion, non-fossil energy is mainly be transformed into electricity power. Power genera- tion energy ratio to primary energy is rapid increasing fast. In 2020, power generation energy ratio to primary energy is 50%. 4.3. Energy Distribution Evolution In the further, the energy distribution intensification in China will be increased fast, big-scale energy basement  X. X. Wei et al. to energy production gross will also accelerate. In 2020, Chinese coal production is most spread in the north parts, such as Shanxi, Shanxi, Neimeng and Xin- jiang. The production mount will be 27 billion tons. The oil spreads in north-east, north-west oil production areas. Natural gas spreads in south-west and north-west energy basement. The newly accelerating hydro-power is in south-west basement. And wind installment will be in tri-north parts of China. The nuclear power is spreading in east part. In 2020, Chinese big synthesize energy basement production ratio to whole primary energy production is 73%. 4.4. Energy Transportation Evolution In China, energy transportation harmonization degree will improve rapid, which will form the reasonable divi- sion of labor and complement each other’s advantage, and form one energy synthesize system. Railway capacity and coal transportation scale is matching. In 2020, Chinese tri-west parts railway outward transport coal is about 12 billion tons. The use ration is 60% and ample is big enough, which can fit the coal transport seasonal fluctuation and outward changing. The highway coal transport will be controlled in reasonable degree. In the further ten years, china can take place of the coal highway transportation about 2 billion tons, railway transportation about 1 billion tons. China will form coal-power energy transportation combination system. In 2020, from the Chinese energy basements outward transport, power transportation will reach 23%, railway coal transportation will be 72%, highway coal transportation will 5%. That will form the reasonable division of labor and complement each oth- er’s advantage energy transportation system. And the power grid will have great impact to wind and hy- dro-power output. 5. Evaluation of Chinese Energy Supply Pattern Evolution to 2050 From security, economy, clean and efficiency, evaluate energy supply pattern evaluation trend. The result showed that security, clean and efficiency will be promoted rapidly, and clean is outstanding. Consider the clean energy development and its environmental benefit, transportation structure will be adjusted. Then the distribu- tion economic degree will be promoted. 5.1. From 2020 to 2050 Installed Capacity According to the energy development prediction, Chinese renewable energy will be 80% to the primary energy in 2050. The fossil energy will be the fundamental load. Wind and solar will be the electricity power supply. From 2020 to 2050, the renewable energy will take place of most part of the fossil energy. The coal capacity will be 78,669 kilo watt, wind capacity will reach to 120,000 kilo watt, solar capacity will be 150,000 kilo watt (Figure 3). From Figure 4, from 2015 to 2050, the proportion of renewable energy to primary energy is accelerating from 10% to 77.1%. The proportion of renewable energy electric quantity to gross generation is from 21.7% to 83.2%. The proportion of generation energy to primary energy is from 46.4% to 92.7%. The proportion of electric energy to terminal is from 25.6% to 67.4%. 5.2. Analysis of Energy Supply Pattern Evolution Trend Make the 2014 as the basic year, analyze the 2020 to 2050 per ten-year as period which can get four series dates. In the energy distribution, economy, clean, efficiency elements are increasing in the further, and the security is getting weak because of renewable energy volatility (Figure 5). The decline of security is mainly because of sufficient railway, import risk coefficient decline, energy diversi- fication degree increment. The improvement of economy is mainly because of environment benefit accelerating, considering the green GDP conception and its economical efficiency. The improvement of clean is mainly be- cause of non-fossil energy ratio increase, and pollution emissions strengthen losing. The improvement of effi- ciency is mainly because of energy loss per GDP, energy consumption elastic coefficient decline and electricity to terminal power consumption ratio increasing. 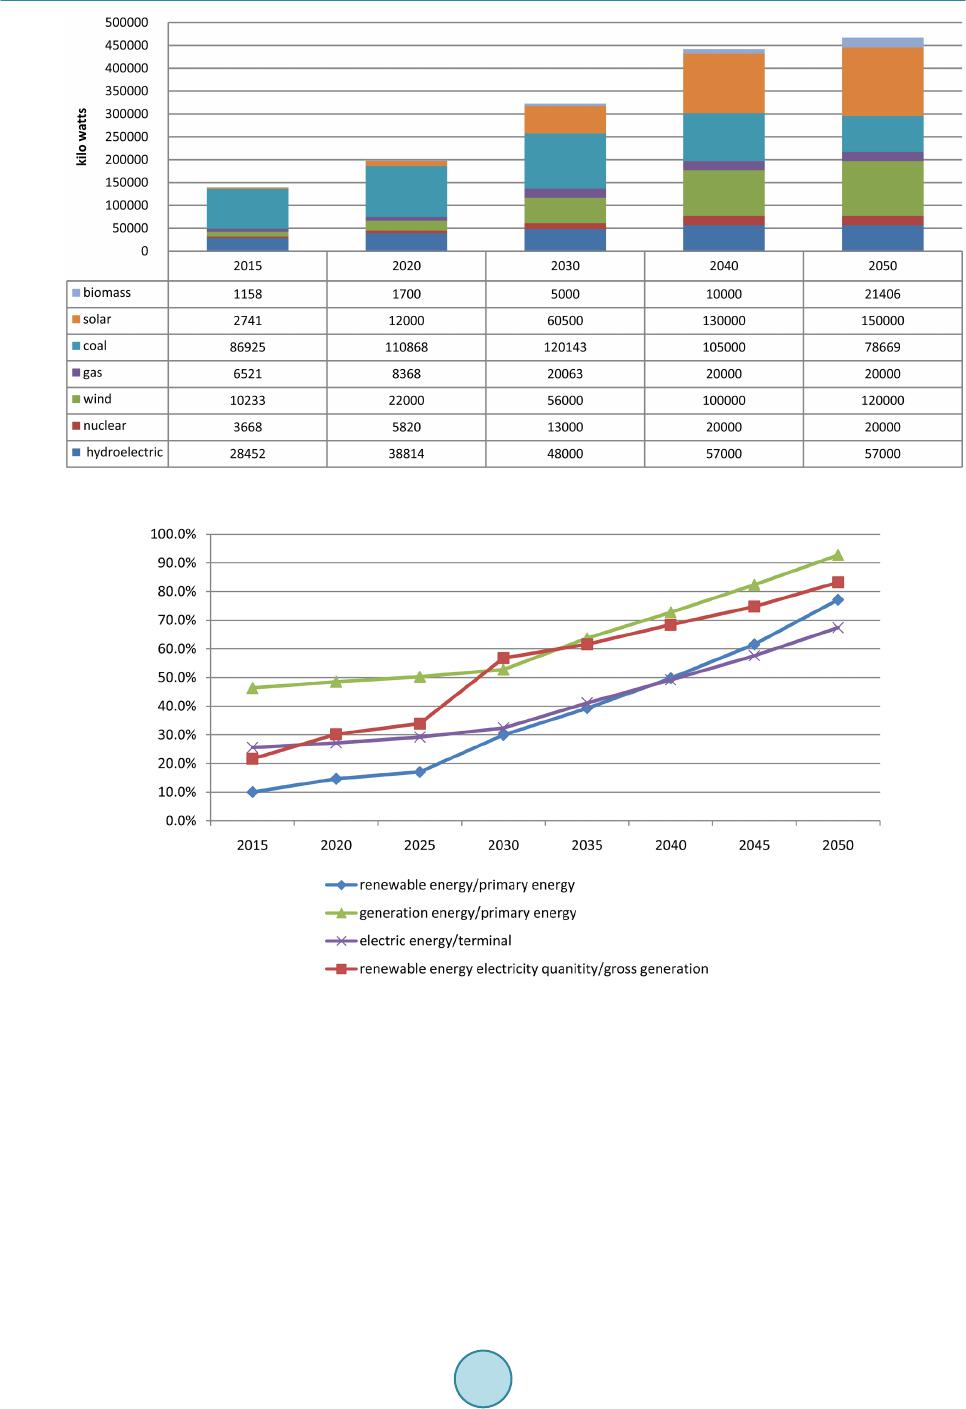 X. X. Wei et al. Figure 3. Energy capacity prediction from 2015 to 2050. Figure 4. Energy proportion comparison from 2015 to 2050. 6. Power Grid Impact to Energy Development and Supply Pattern In China, the power grid function has four aspects in new development. (1) Satisfy energy and power large scale long distance transportation. (2) Satisfy receiving areas multiple energy high efficient integration and coordi- nated operation. (3) Satisfy new energy development and new type power-using service needing. (4) Satisfy the power market platform material base needing. In the further, power grid will be pivotal role in energy exploit, transform, transportation, consumption, security, service and market trading system. (1) Satisfy energy and power large scale long distance transportation. China is still in industrialization, infor- matization, urbanization and agricultural modernization rapid development stage. The power demand will con- tinue to increase. The east and midland will restrain as the power load center in long period of time, while the new coal power, hydro-power, wind and solar power are mainly in the west and north areas. Power demanding  X. X. Wei et al. Figure 5. Ener gy supply pattern evolution trend from 2020 to 2050. and generation is reverse. Long-distance, large-scale energy transportation is the most important characteristic in Chinese energy supply pattern evolution. Chinese west power transport to east and north power transport to south will be still. The energy basement of hydro-power in south-west, coal power in west and north, wind in tri- north and solar in west, will be transported to east and mil-part of china. Russia, Mongolia, Central Asia and Southeast Asia will transport power to China. Grid will be the most important part Chinese energy synthesize transportation system. As improvement of coal power optimization and distribution, the clean non-fossil energy will be transported in large scale and long distance, which will be very important to Chinese energy power large scale transportation in energy synthesize system. (2) Satisfy receiving areas multiple energy high efficient integration and coordinated operation. With power trans-regional scale rapid improvement, the development region will have large ratio import power. Power sys- tem comprehensive degree will accelerate. The importing of coal power, hydro-power, reproducible energy and locale coal power, gas power, hydro-power, storage power, nuclear power, reproducible energy combine into coordination system, and it requires high demanding, such as big area, strong grid, dynamic balance and security high level. (3) Satisfy new energy development and new type power-using service needing. Wind power, solar power and other new energies have randomness and intermittent characteristics. Their controllability and predictability is lower than original fossil power generation. Large scale exploitation will bring big challenge of power grid con- trol and coordination. So the power grid is needing advanced automatics, coordination control and storage tech- nique to implement the new energy accuracy control and high efficient utilization. At the same time, with the wide spread of electric car and electric household appliance, the energy quantity will face the higher requirement. Intelligentize will be the further needing of grid. (4) Satisfy the power market platform material base needing. The whole country power market platform oper- ation needs whole power grid connection, which can carry out the fundamental effect of larger degree, wider scale to give play to energy source distribution. Promote the non-fossil energy large scale exploitation usage and make larger economic benefit, power save benefit, source environmental benefit, security benefit and social benefit. In order to adapt the big change of power grid function, the further power grid must be strong and intel- ligent. With the breaking through of high voltage transportation, intelligent power grid construction can be carry forward synchronization. And it will form high voltage as the center, all or different levels harmonious devel- opment forming intelligent grid. In China, energy development carries out production and consumption concentration ratio reaching to high level, energy producing and consumption showing reverse distribution, trans-regional demand reaching long coal railway transport channel utilization gas transport channel utilization coal-power transportation system reliability coal and coking industry and its ex-factory price indices of industrial product oil and gas producer’s price for manufactured products fuel power purchase price indices power producer’s price for manufactured products clean energy ration to primary energy consumption sulfur dioxide discharge strength sulfur dioxide discharge value environmental pollution control investment ration to GDP clean energy generate electricity ration renewable energy use efficiency energy processing and transforming efficiency power energy ration to terminal energy consumption  X. X. Wei et al. distance. And these characteristics will change energy distribution configuration, coal-transport cooperation, propel intelligent grid construction, drive energy structure adjustment and energy development changing, realize energy security, economy and clean. 6.1. Energy Supply Security Promote clean energy consumption and fuel oil replacement, which can decline foreign-trade dependence. In 2020, electric car will replace fuel oil 700 million tons. In 2050, electric car will totally replace the traditional vehicles. Promote energy transportation system diversified development, reduce transportation risk, and accelerate energy security level. In 2020, the basements will get coal to transportation ratio is 4:1. In 2050, the reliability of coal transportation will be 1:1 (Table 3). 6.2. Energy Clean Development Promote clean energy consumption. In 2020, trans-region power contribution degree to clean energy consump- tion is 27%, and in 2050, the ration will reach to 77%. Reduce pollution emission of development area. In 2020, the sulfur dioxide is 75million tongs/year. And to 2050, the dioxide emission will be zero (Table 4). 6.3. Energy Distribution Efficiency Promote the power transportation and clean energy usage efficiency. In 2020, trans-regional power can lack ab- andoning abandon water and electricity is 320 billion kilowatt-hours, ratio of trans-regional wind power to total power is 40%. In 2050, generation energy to primary energy is 92%. Promote ratio power to terminal energy consumption. In 2020, generating power ratio to primary energy con- sumption will accelerate 8.2%, and in 2050, the ratio will be 67.4% (Table 5). 6.4. Energy System Economy In 2020, trans-regional power can save cost 670 billion yuan/year. From the green GDP, it will reduce whole country environmental loss 30 billion yuan/year. In 2050, with high proportion of renewable energy connecting to the power system, we do not needing to accelerate the environment investment (Table 6). 7. Conclusion Energy is the most important to country development, and the speed and degree of country and regional eco- nomic development is depending on modern energy supply guarantee system’s ability and construction. This Table 3. Grid effect of power security supply. classify 2015 2020 2050 Security Foreign-trade dependence Limit of electric car scale Electric car ownership is500 millio, replace fuel oil 700 million tons. Electric car totally replacement Limit of trans-region of power energy volume exchange Rapid improve grid construction, replace coal importing 5000 million tons. None coal importing Reliability of coal-transportation 3:1 4:1 1:1 Table 4. Grid effect of power clean supply. classify 2015 2020 2050 clean Ratio of clean energy to primary energy consumption Ratio of clean energy to primary energy is 9% Ratio of clean energy to primary energy is 15% Ratio of clean energy to primary energy is 77% Sulfure dioxide emission Changjiang area is 45 tons Changjiang area is 75 tons none  X. X. Wei et al. Table 5. Grid effect of power efficien cy supply. classify 2015 2020 2050 efficiency Energy process transition Line loss rate 6.5% Line loss rate 6.2%, Power appliance usage ratio will be accelerating Generation energy to primary energy is 92% Clean energy has little tran s-regional exchanging power, the north abandon wind ratio is exceeding 20%. Less the hydro-power in southwest is 320 billion kilowatt-hour, reduce the abandon wind power is billion kilowatt-hour. Hydro-power is stable, and wind power can be stored Power ratio to terminal energy 20.9% 27.5% 67.4% Table 6. Grid effect of power economy supply. Classify 2015 2020 2050 Economy Power industrial products ex-factory price Coal transportation to receiving port generating power has low economy Save the cost of generating power cost is 450 billion yuan Renewable energy replacement Green GDP No space in development Lack environment loss is 30 billion yuan/year No needing to add investment paper researches Chinese energy supply and demand pattern system and evaluation methodology with high pro- portion of renewable energy supply, gives out the inner and outer influencing elements. And evaluate Chinese energy supply and demand pattern from energy gross, structure, distribution and transportation. Give the energy supply synthesize radar comparison chart in certain time period. From the energy security, economy, clean and efficiency, analyze the benefit comparisons of Chinese energy supply and demand pattern. This energy supply and demand pattern model will give one certain theoretical analysis and practice reference. References [1] Sarak, H. and Satman, A. (2003) The Degree-Day Method to Estimate the Residential Heatingnatural Gas Consump- tion in Turkey: A Case Study. Energy, 28, 929A-939A. http://dx.doi.org/10.1016/S0360-5442(03 )00 0 35-5 [2] Balaeh and ra, R. and Chandru, V. (19 99) Modelling Electricity Demand with Representative Load Curves. Energy, 24, 219-230. http://dx.doi.org/10.1016/S0360-5442(98 )00 096 -6 [3] K uma r , A., Bhattacharya, S.C. and Pham, H.L. (2003) Greenhouse Gas Mitigation Potential of Biomass Energy Tech- nologies in Vietnam Using the Long Range Energy Alternative. Energy, 28, 627-654. http://dx.doi.org/10.1016/S0360-5442(02)00157-3 [4] Mackay, R.M. and Probert, S.D. (2001) Forecasting the United Kingdom’s Supplies and Demands for Fluid Fossil- fliels. Applied Energy, 69, 161-189. http://dx.doi.org/10.1016/S0306-2619(01 )00 003 -4 [5] Messn er, S. and Schratt enhol zer, L. (2000) MESSAGE-MACROO: Linking an Energy Supply Model with a Macroe- conomic Module and Solving It Iteratively. Energy, 25, 267-282. http://dx.doi.org/10.1016/S0360-5442(99)00063-8 [6] Cu aresma, J.C., Hlouskova, J. and Kossmeier, S. (2004) Forecasting Electricity Spot-Prices Using Linear Univariate Time-Series Model s. Applied Energy, 77, 87-106. http://dx.doi.org/10.1016/S0306-2619 (03 )00 096 -5 [7] S ha rma , D.P., Chandramohanan Nair, P.S. and Balasub ramanian, R. (2002) Demand for Commercial Energy in the State of Kerala, India: An Econometric Analysis with Medium-Range Projections. Energy Po lic y, 30 , 781-791. http://dx.doi.org/10.1016/S0301-4215(01)00138-0 [8] P ersaud, A.J. an d K uma r, U. (2001) An Eclectic Approach in Energy Forecasting: A Case of Natural Resources Cana- da,s(NRCans) Oil and Gas Outlook. Energy Policy, 29, 303 -313. http://dx.doi.org/10.1016/S0301-4215(00 )00 119 -1 [9] Chow, L.C.H. (2001) A Study of Sectoral Energy Consumption in Hong Kong (1984-97) with Special Emphasis on the Household Sector. Energy Policy, 29, 1099-11 10 . http://dx.doi.org/10.1016/S0301-4215( 01) 0004 6-5 [10] Ed iger , V.S . and Tatlidil, H. (2002) Forecasting the Primary Energy Demand in Turkey and Analysis of Cyclic Patteras. Energy Conversion and Management, 43, 473-487. http://dx.doi.org/10.1016/S0196-8904(01)00033-4 [11] Fin on , D. (19 76 ) Un model energetique pour la France. Centre National de la Recherche Scienti-fi q u e, P aris. [12] Van der Voot, E. (1982) The EFOM 12C Energy Supply Model with in the EC Modeling System. Omega , 10 , 50 7 -523.  X. X. Wei et al. http://dx.doi.org/10.1016/0305-0483(82)90007-X [13] Eltony, M.N. and Al-Mutairi, N.H. (1995) Demand for Gaspoline in Kuwait: An Empirical Analysis Using Cointegra- tion Techniques. Energy Econo m ies , 17, 249 -253. http://dx.doi.org/10.1016/0140-9883(95)00006-G [14] Ramanath an, R. (1999) Short - and Long-Run Elasticities of Gasoline Demand in India: An Empirical Analysis Using Cointegration Techniques. Energy Economies, 21, 321 -330. http://dx.doi.org/10.1016/S0140-9883(99 )00 011 -0 [15] S a mimi, R. (1995) Road Transport Energy Demand in Australia: A Integration Approach. Energy Economics, 17 , 329 - 339. http://dx.doi.org/10.1016/0140-9883(95)00035-S [16] Bentzen , J. and En gst ed, T. (2 001 ) A Revival of the Autoregressive Distributed Lag Model in Estimating Energy De- mand Relationships. Energy, 26, 45-55. http://dx.doi.org/10.1016/S0360-5442(00)00052-9 [17] Oh, W. and Lee, K. (2004) Energy Consumption and Economic Growth in Korea, Testing the Causality Relation. Journal of Energy Modeling, 26, 973-985. [18] Hondroyiannis, G. (2004) Estimating Residential Demand for Electricity in Greece. Energy Economies, 26, 319-334. http://dx.doi.org/10.1016/j.eneco.2004.04.001 [19] Ghali, K.H. and EI-Mutairi, M.I. T. (2004) Energy Use and Output Growth in Canada: A Multivariate Integration Analysis. Energy Economies, 26, 225-238. http://dx.doi.org/10.1016/S0140-9883(03 )0005 6 -2
|