Paper Menu >>
Journal Menu >>
 Engineering, 2009, 2, 75-90 doi:10.4236/eng.2009.12009 Published Online August 2009 (http://www.SciRP.org/journal/eng/). Copyright © 2009 SciRes. ENGINEERING A Non-Linear 3D FEM to Simulate Un-Bonded Steel Reinforcement Bars under Axial and Bending Loads Rami HAWILEH1, Adeeb RAHMAN2, Habib TABATABAI3 1Department of Civil Engineering, American University of Sharjah, Sharjah,United Arab Emirates. 2Department of Civil Engineering & Mechanics, University of Wisconsin-Milwaukee, Milwaukee, WI, USA. 3Department of Civil Engineering and Mechanics, University of Wisconsin-Milwaukee, Milwaukee, WI, USA. Email: rhaweeleh@aus.edu Received May 21, 2009; revised July 1, 2009; accepted July 10, 2009 Abstract This paper presents development of 3D non-linear finite element model to simulate the response and predict the behavior of un-bonded mild steel bars under axial and bending loading. The models were successfully analyzed with the finite element software ANSYS, taking into account the nonlinear material properties of the reinforced mild steel bars. A bending strain relationship is derived based on a parametric study involving multiple nonlinear finite element models. A mild steel fracture criterion based on low-cycle fatigue models is proposed to control the total (elastic and plastic) strains in the mild steel bar below a maximum permissible limit. In addition, FE predictions of bar elongation due to strain penetration reasonably agreed with a pro- posed empirical equation by Raynor and Lehman. It was concluded that the equation proposed by Raynor and Lehman is considered valid for estimating the additional unbounded length and can be used in both analysis and design. Keywords: Finite Element, Combined Axial and Bending Loading, Steel Rebar, Precast Hybrid Frame. 1. Introduction In the Precast Seismic Structural Systems (PRESSS) research [1], a total of five different seismic structural systems made from precast concrete elements were pro- posed. These systems formed various parts of the struc- tural framing in the PRESSS Phase III experimental building that was tested at the University of California at San Diego. The structural system identified as the unbonded post-tensioned frame with damping reinforced mild steel bars (hybrid frame) performed very well in the PRESSS evaluation. Hawileh et al. [2] developed a nondimen- sional design procedure for this type of hybrid connec- tions. The hybrid frames contain precast elements (beams and columns) that are connected by unbonded post-tensioning steel and partially debonded reinforce- ment bars, both of which contribute to the overall mo- ment resistance. An important feature of the connection between beam and column is the hybrid combination of mild steel and post-tensioning steel where the mild steel is used to dissipate energy by yielding in tension and compression and the post-tensioning steel is used to clamp the beam against the column. The post-tensioning force would act as a clamping/restoring force to bring the frame back to its original configuration after an earth- quake, and would provide for shear resistance through friction developed at the beam-column interface. Hawileh et al. [3] developed a 3-D nonlinear finite element (FE) model of a hybrid frame system that pre- dicted the experimental results of Cheok and Stone [4]. From the results of the analyses, it was determined that the mild steel bars in a hybrid frame exhibit significant inelastic axial and bending strains. Once the gap at the  R. HAWILEH ET AL Copyright © 2009 SciRes. ENGINEERING 76 d b / 2 dy dx dS O d R B' B A ' Figure 1. Deformed segment of the mild steel bar. beam-column interface opens, relatively high levels of repetitive plastic strains develop in the mild steel bar. This prompted a need for investigating the behavior and performance of reinforcing steel bars when subjected to high amplitude levels of plastic strains, considering both bending and axial strains, respectively. The relatively high inelastic strains in the finite element model show the potential vulnerability of reinforced mild steel bars to low-cycle fatigue failure. It should be noted that both the PRESSS [1] and National Institute of Standards and Technology (NIST) [4] test reports indicate bar fractures during cyclic testing. Mander and Panthaki [5] studied the behavior of rein- forcing steel bars under low-cycle fatigue subjected to axial-strain reversals with strain amplitudes ranging from yield to 6%. The low-cycle fatigue behavior of steel bars subjected to bending strain reversals with variable am- plitudes were studied by Liu [6]. In addition, a mild steel fracture criterion under combined axial and bending strains is proposed in this paper. 2. Bending Strain Calculations for Bars Liu [6] presented the following procedure for calculating strain-displacement relationships for bars subjected to bending when the material is stressed beyond the elastic range. Consider the deformed bar segment shown in Figure 1. Assuming that the cross section of bar is symmetric (i.e. elastic and plastic neutral axes are at the center of the bar), the bending strain and the radius of curvature can be calculated as follows: R d dR Rdd d R dsBA b b b 1 2 2 ds (1) where, R = radius of curvature, d = angle of rotation, b = maximum bending strain, and db = bar diameter. However, 2 22222 2 11 dy dsdx dydxdxy dx (2) 21/2 (1 )ds dxy (3) but, tan dy ydx (4) Differentiate both sides of the above equation 2 2 2sec dy d ydx dx (5) 2 1tan d ydx (6) 2 1tan 1 ydx y d y 2 d x (7) knowing that,s = R dd, and therefore ds d R 1 (8) By inserting d and ds values from Equations 4 to 7, Equation 9 yields: 2 3 2 2 1 2 2 1 )1( 1 1 y y ydx dx y y R (9) 3. Axial Strain Calculations for Bars In Figure 2, the solid line CD is the initial unbonded length of the reinforcing bar in a hybrid frame. The dashed line DE shows the path that the end D of the un- bonded segment of the mild steel bar would take as it moves from D to E. Assuming that the center of rotation “O” for the open- ing of the joint at the beam-column interface is at the neutral axis of the beam when the hybrid frame is sub- jected to a design interface rotation of des, the following can be written using the same assumptions as in the PRESSS program (See Figure 2 and Figure 3). where, R = (1--des)hg (10)  R. HAWILEH ET AL Copyright © 2009 SciRes. ENGINEERING 77 Lsu DUCT GROUT y xCONCRETE C E D '' ''' CD E O des Lsu X Y R = OA ''+ des /2 Figure 2. Path of point D of the unbonded segment of the mild steel bar. Figure 3. Location of the center of rotation at des [1]. Figure 4. Isoparametric view of the entire model.  R. HAWILEH ET AL Copyright © 2009 SciRes. ENGINEERING 78 des = distance from the compression face of the beam to the neutral axis at des divided by the height of the beam distance from the center of the mild steel bar to the near- est face divided by the height of the beam hg = beam- height des = maximum (design) interface rotation Lsu = unbonded length of the mild steel bar at each interface Let: a,a s u s L (1 1) where s is the horizontal gap opening at the location of the tension bar at the beam-column interface (Figure 3) and a,a is the axial bar strain assuming that there is no vertical movement at the end of the bar as a result of rotation. des des (1) gdes sR h (12) des a,a a,a (1 ) s g des su h L (13) and, , tan s udes aa L R (14) 22 1 22 2 , , (1 ) 1 des g su des g desa a aa ODh L h (15) However, cos2 des XDE (16) des DE OD (17) , 1 22 2 , 1 cos 2 desgdes aa des desa a h X (18) and, sin2 des YDE (19) , 1 22 2 , 1 sin 2 desgdes aa des desa a h Y (20) tan su Y Ls (21) 1 22 2 , 1 22 2 , sin 2 tan 1cos 2 des desa a des desa a (22) The axial strain in the reinforcing bar (axial) can be written as: 22 () s u axial su LX YL L su (23) 1 22 2 , 12cos 2 des axialdesaa 1 2 22 ,1 desaa (24) 4. The FE Model As discussed in the previous Section of this paper, the deformed geometry of the bar is needed to allow calcula- tion of bending strains. Therefore, it is important to de- termine the inelastically deformed shape of the reinforc- ing bar at des. A FE model using ANSYS [7] is devel- oped to predict the inelastically deformed shape of the bar. Once an equation for the deflected shape of the bar is derived, the bending and axial strains of the bar can be calculated based on the derived equations of the previous Sections. In addition, a parametric study involving multiple nonlinear FE models using the was performed to inves- tigate and simulate the combined axial and bending be- havior of the mild steel bar for six different cases listed in Table 1. The undeformed geometry of the mild steel bar at the beam-column interface is modeled as shown in Figure 4. The dimensions of the model are listed in Table 2. Figure 5. BEAM188 3-D linear finite strain beam [7].  R. HAWILEH ET AL Copyright © 2009 SciRes. ENGINEERING 79 Table 1. Study cases. No. (1-des-)h des Lsu (inches)٭'' (rad.) X (inches)٭ Y (inches)٭ X/Lsu 1 20 0.02 10 0.4636 0.398 0.204 0.0398 2 20 0.04 20 0.7854 0.784 0.816 0.0392 3 30 0.02 15 0.4636 0.597 0.306 0.0398 4 30 0.04 30 0.7854 1.176 1.224 0.0392 5 20 0.01 5 0.245 0.200 0.051 0.04 6 20 0.02 20 0.7854 0.396 0.404 0.0198 ٭Note: 1 inch = 25.4 mm. Table 2. Model dimensions. Material Width (in)٭ Height (in)٭ Diameter (in)٭ Area (in2)٭ Mild Steel Bar _ _ 1 0.785 Grout _ _ 3 6.281 Concrete Block 7 7 _ 41.932 ٭ Note: 1 inch = 25.4 mm; 1 sq in. = 0.000645 m2. The partially unbonded bar and two concrete blocks rep- resenting parts of the beam and column are modeled. The grout around the bar in the bonded portion is also mod eled. The length of the concrete block is assumed to be 20 inches (508 cm) on each side of the unbounded length of the bar to provide sufficient bar bonded length for all study cases. BEAM188 [7] element is used to model the entire model. The geometry, node locations, and the coordinate system for the ANSYS element BEAM 188 are shown in Figure 5. The cross section details of the beam elements are provided separately. The cross sectional dimensions and properties of the mild steel bar, duct grout, and con- crete are shown in Figures 6 through 8 4.1. Material Properties Components of this structure consist of the following- materials: Concrete, Grout, and Grade 60 Reinforcing bar Grade 60. In order to simulate and analyze this struc- ture, exact material properties and relevant coefficients should be defined properly. The concrete compressive strength f′c is 7400 psi (51 MPa) and the modulus of elasticity for all the materials used in the model is listed in Table 3. The stress-strain curves for the mild steel bar and reinforced concrete are displayed in Figure 9 and Figure 10. Other defined coefficients include: Density ( ): The densities of reinforced mild steel and concrete were assumed to be 490 lb/ft3 (7850 kg/m3) and 150 lb/ft3 (2400 kg/m3), respectively. Poisson’s Ratio ( ): The Poisson’s Ratio () was as- sumed to be 0.3 for steel and 0.2 for concrete 4.2. Boundary Conditions The entire concrete block nodes on the left side of the bar’s unbonded length were restrained (fixed) in all 6 directions (Figure 4). All of the concrete block nodes at the right end of the unbonded mild steel bar were simul- taneously deformed to achieve the following concurrent displacements and rotation: A horizontal displacement X; a vertical displacement Y; and a rotation des.  R. HAWILEH ET AL Copyright © 2009 SciRes. ENGINEERING 80 Figure 6. Mild steel bar cross section. Figure 7. Duct grout cross section.  R. HAWILEH ET AL Copyright © 2009 SciRes. ENGINEERING 81 Figure 8. Concrete cross section. #8, Grade 60 Reinforcing Mild Steel Bar 0 20 40 60 80 100 120 00.02 0.04 0.06 0.080.1 Strain (in/in) Stress (ksi) Figure 9. Stress-strain curve of grade 60 mild steel bar [3].  R. HAWILEH ET AL Copyright © 2009 SciRes. ENGINEERING 82 Stress-Strain Model of unconfined concrete for f ` c = 7400 psi 0 1000 2000 3000 4000 5000 6000 7000 8000 00.00050.001 0.0015 0.0020.0025 0.003 Strain (in/in) Stress (psi) Series 1 Figure 10. Stress-strain model of concrete [3]. Figure 11. Deflected shape of the model.  R. HAWILEH ET AL Copyright © 2009 SciRes. ENGINEERING 83 Table 3. Material properties. Material # Material Name Modulus of Elasticity E s ( ksi ) ٭ 1 Concrete 4900 3 Mild Steel 29,000 5 Duct Grout 3500 ٭Note: 1 ksi = 6.895 MPa. The grout and reinforcing bar elements were not re- strained in either block. The values of these applied dis- placements for the six different cases are listed in Table 1. The relative magnitudes of these displacements are consistent with the deformations in precast/prestressed hybrid frames. 5. Results The FE model provides full fields of stress and strain throughout the model. Figure 11 shows the deflected shape of the entire model. The total (elastic + plastic) axial strains and for the reinforced mild steel bar, grout, and concrete for the first study case are shown in Figures 12 to 14. The results for the bar axial and bending strains for the six study cases are tabulated in Table 4. The above figures show the development of plastic strains in the mild steel bar with its highest value at the fixed end of the bar as shown in Figure 12. The vertical deformation across the unbonded segment of the bar is plotted in Figure 15 for the first study case and in Figure 16 for all the six model study cases. In all six model cases, the vertical deformation data for the bars were fitted into a 3rd order polynomial. The r2 value of this regression analysis is 1.0 in all cases, which means that the regression results provide perfect fit for the finite element results. The equations for the vertical deflection, slope, second derivative, curvature, and bending strain take the following form: y = ax3 + bx2 + cx + d (25) y = 3ax2 + 2bx + c (26) y = 6ax + 2b (27) 3 22 1 1 y Ry 3 22 2 16 +2 13 2 ax b R ax bx (28) A general equation for the bending strain in the bar can be determined using constants a, b, c, and d based on the prescribed boundary conditions as follows: Boundary Conditions: At x = 0 y = 0 d = 0 y = 0 c = 0 At x = Lsu y = y y = des 3 2 des su su L aL y (29) 2 3dessu su yL bL (30) Using y and Lsu values from Equations 14 to 21, 1 22 2 , 2 , 2()sin() 2 1 des desdesaa desgdes aa a h (31) 1 22 2 , , 3() sin() 2 1 des desa ades desg des aa bh (32) According to the FE results the values of both the curvature and bending strain are maximum at the fixed end of the bar (at x =0). Therefore, Substituting Equations 27 and 28 in Equa- tion 29 and considering that x = c = d = 0, yields: max 12b R (33) ,max max 1 2 b b dbd R b (34) where, b,max is the maximum bending strain along the length of the bar. Substituting for b from Equation 33, 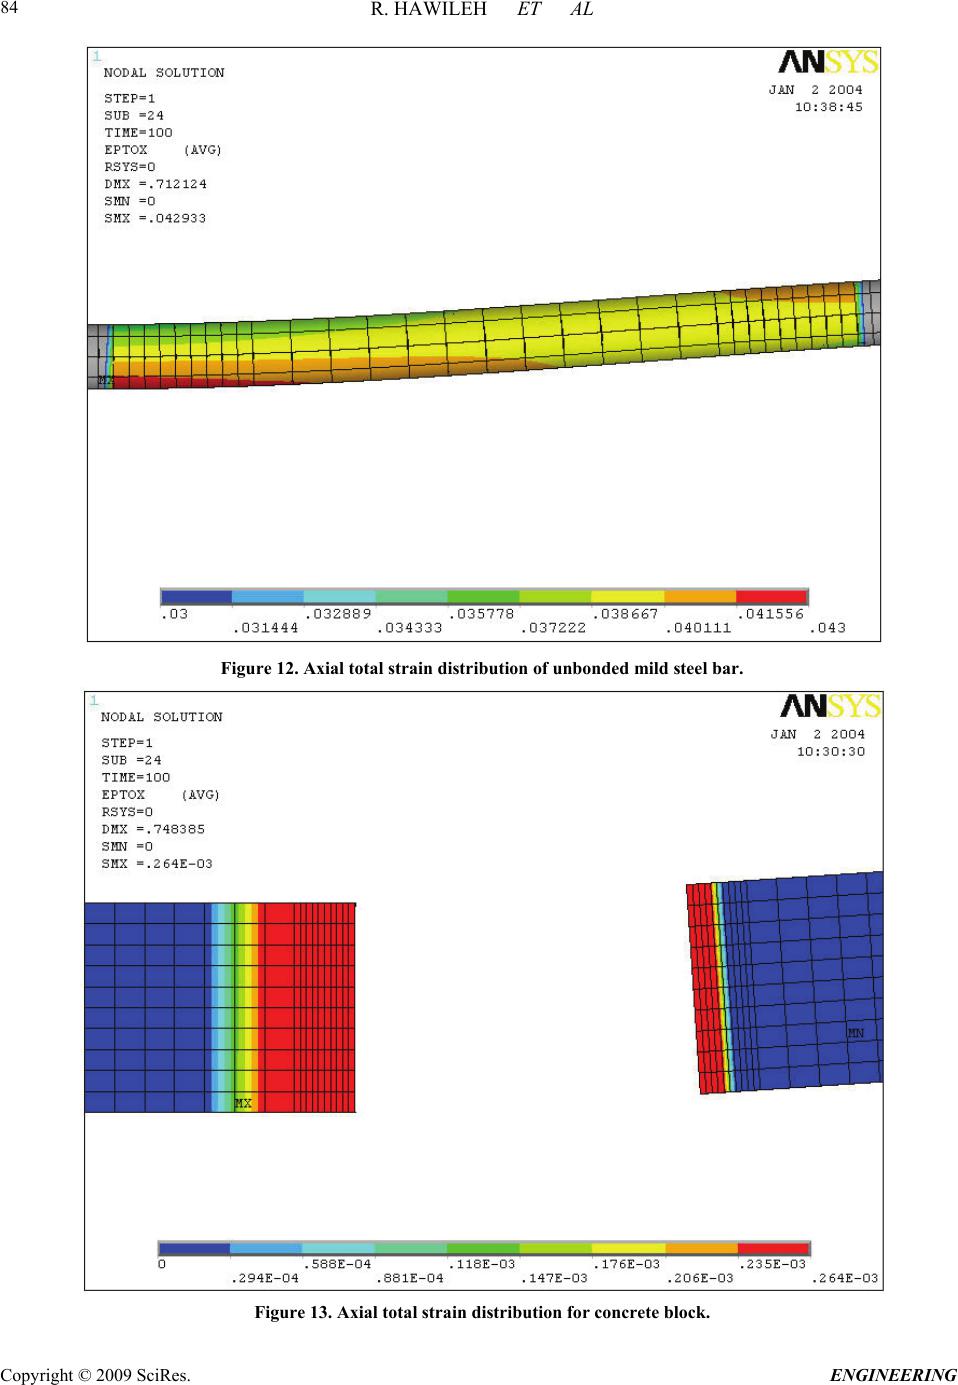 R. HAWILEH ET AL Copyright © 2009 SciRes. ENGINEERING 84 Figure 12. Axial total strain distribution of unbonded mild steel bar. Figure 13. Axial total strain distribution for concrete block. 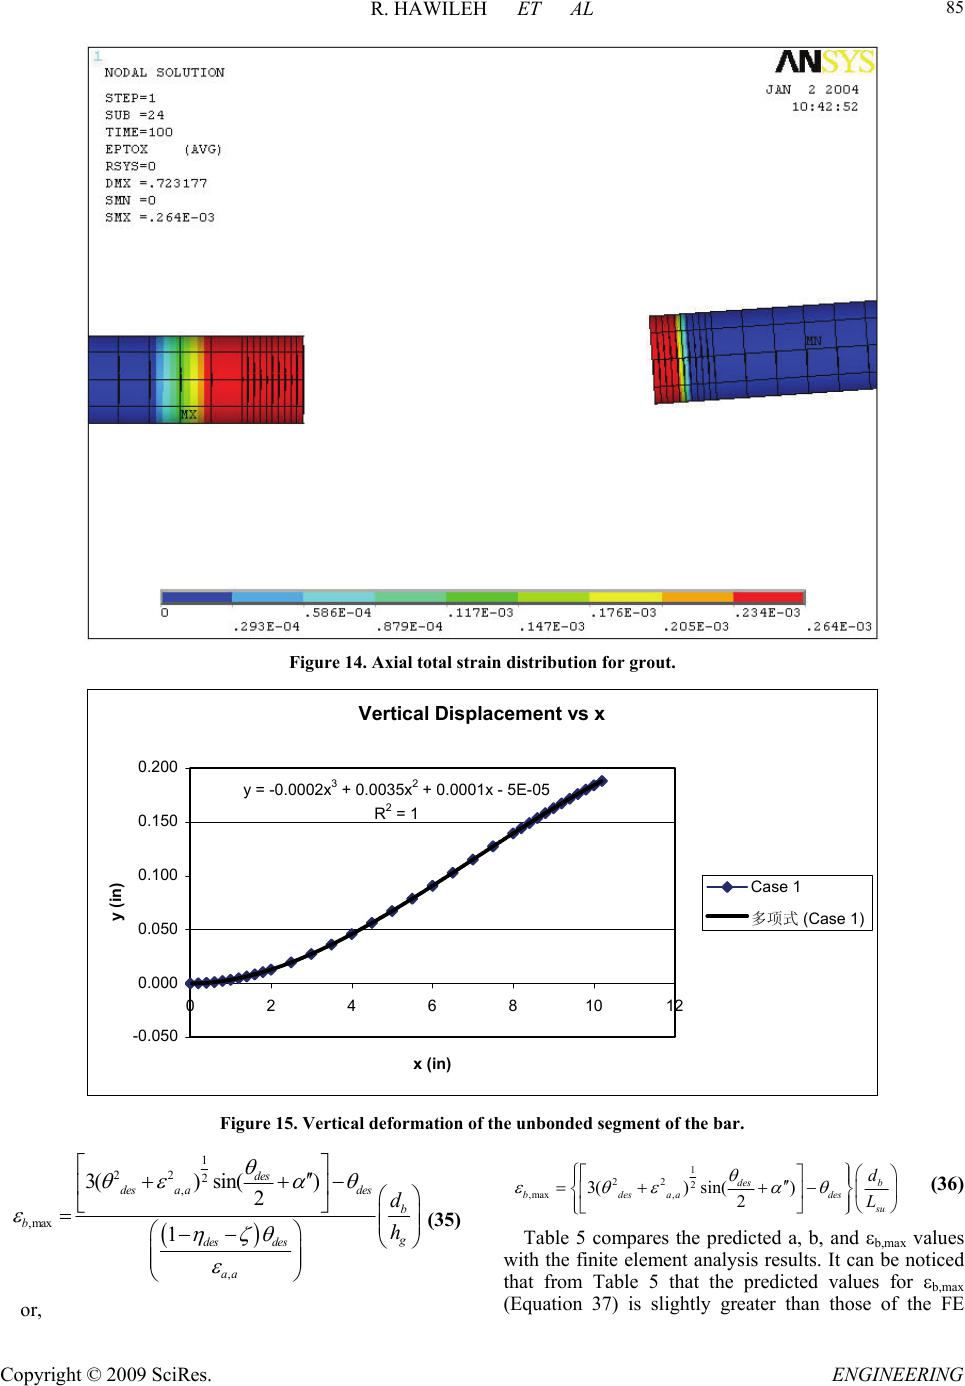 R. HAWILEH ET AL Copyright © 2009 SciRes. ENGINEERING 85 Figure 14. Axial total strain distribution for grout. Vertical Displacement vs x y = -0.0002x 3 + 0.0035x 2 + 0.0001x - 5E-05 R 2 = 1 -0.050 0.000 0.050 0.100 0.150 0.200 024681012 x (in) y (in) Case 1 多项式 (Case 1) Figure 15. Vertical deformation of the unbonded segment of the bar. 1 22 2 , ,max , 3() sin() 2 1 des desa ades b b g des des aa d h (35) 1 22 2 ,max , 3() sin() 2 des b bdesaa des su d L (36) Table 5 compares the predicted a, b, and b,max values with the finite element analysis results. It can be noticed that from Table 5 that the predicted values for b,max (Equation 37) is slightly greater than those of the FE or, 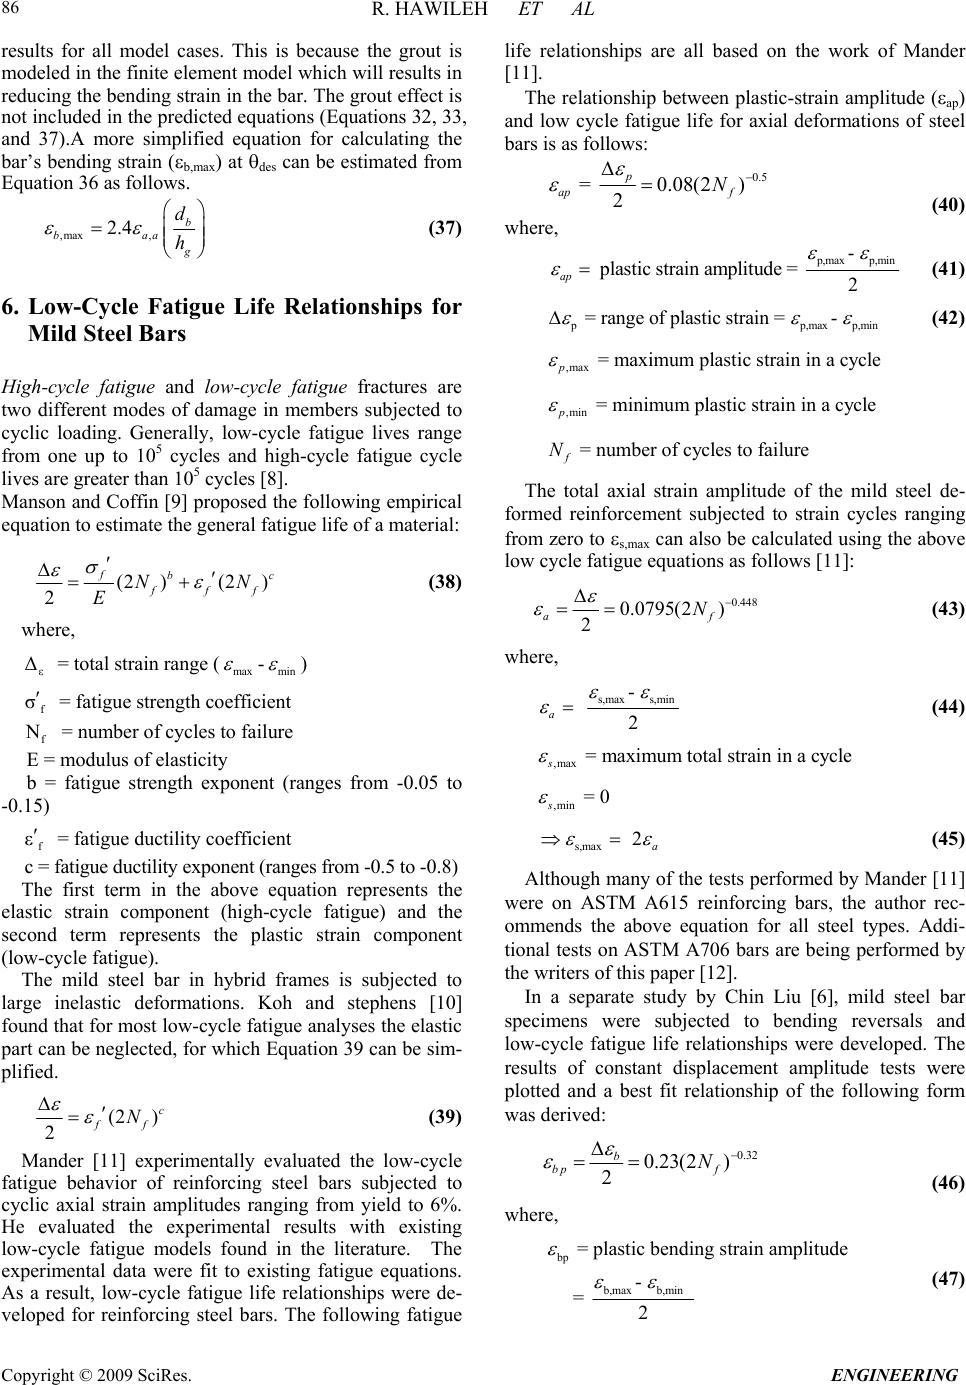 R. HAWILEH ET AL Copyright © 2009 SciRes. ENGINEERING 86 results for all model cases. This is because the grout is modeled in the finite element model which will results in reducing the bending strain in the bar. The grout effect is not included in the predicted equations (Equations 32, 33, and 37).A more simplified equation for calculating the bar’s bending strain (b,max) at des can be estimated from Equation 36 as follows. ,max , 2.4 b baa g d h (37) 6. Low-Cycle Fatigue Life Relationships for Mild Steel Bars High-cycle fatigue and low-cycle fatigue fractures are two different modes of damage in members subjected to cyclic loading. Generally, low-cycle fatigue lives range from one up to 105 cycles and high-cycle fatigue cycle lives are greater than 105 cycles [8]. Manson and Coffin [9] proposed the following empirical equation to estimate the general fatigue life of a material: (2 )(2 ) 2 fb fff N E c N (38) where, ε Δ = total strain range (max -min ) f σ = fatigue strength coefficient f N = number of cycles to failure E = modulus of elasticity b = fatigue strength exponent (ranges from -0.05 to -0.15) f ε = fatigue ductility coefficient c = fatigue ductility exponent (ranges from -0.5 to -0.8) The first term in the above equation represents the elastic strain component (high-cycle fatigue) and the second term represents the plastic strain component (low-cycle fatigue). The mild steel bar in hybrid frames is subjected to large inelastic deformations. Koh and stephens [10] found that for most low-cycle fatigue analyses the elastic part can be neglected, for which Equation 39 can be sim- plified. (2 ) 2 c ff N (39) Mander [11] experimentally evaluated the low-cycle fatigue behavior of reinforcing steel bars subjected to cyclic axial strain amplitudes ranging from yield to 6%. He evaluated the experimental results with existing low-cycle fatigue models found in the literature. The experimental data were fit to existing fatigue equations. As a result, low-cycle fatigue life relationships were de- veloped for reinforcing steel bars. The following fatigue life relationships are all based on the work of Mander [11]. The relationship between plastic-strain amplitude (ap) and low cycle fatigue life for axial deformations of steel bars is as follows: 0.5 = 0.08(2) 2 p ap f N (40) where, p,max p,min - plastic strain amplitude = 2 ap (41) pp = range of plastic strain = - ,maxp,min (42) ,max ,min = maximum plastic strain in a cycle = minimum plastic strain in a cycle = number of cycles to failure p p f N The total axial strain amplitude of the mild steel de- formed reinforcement subjected to strain cycles ranging from zero to s,max can also be calculated using the above low cycle fatigue equations as follows [11]: 0.448 0.0795(2 ) 2 a N f (43) where, s,max s,min - 2 a (44) ,max = maximum total strain in a cycle s ,min= 0 s s,max 2a (45) Although many of the tests performed by Mander [11] were on ASTM A615 reinforcing bars, the author rec- ommends the above equation for all steel types. Addi- tional tests on ASTM A706 bars are being performed by the writers of this paper [12]. In a separate study by Chin Liu [6], mild steel bar specimens were subjected to bending reversals and low-cycle fatigue life relationships were developed. The results of constant displacement amplitude tests were plotted and a best fit relationship of the following form was derived: 0.32 0.23(2 ) 2 b bp f N (46) where, bp b,max b,min = plastic bending strain amplitude - = 2 (47) 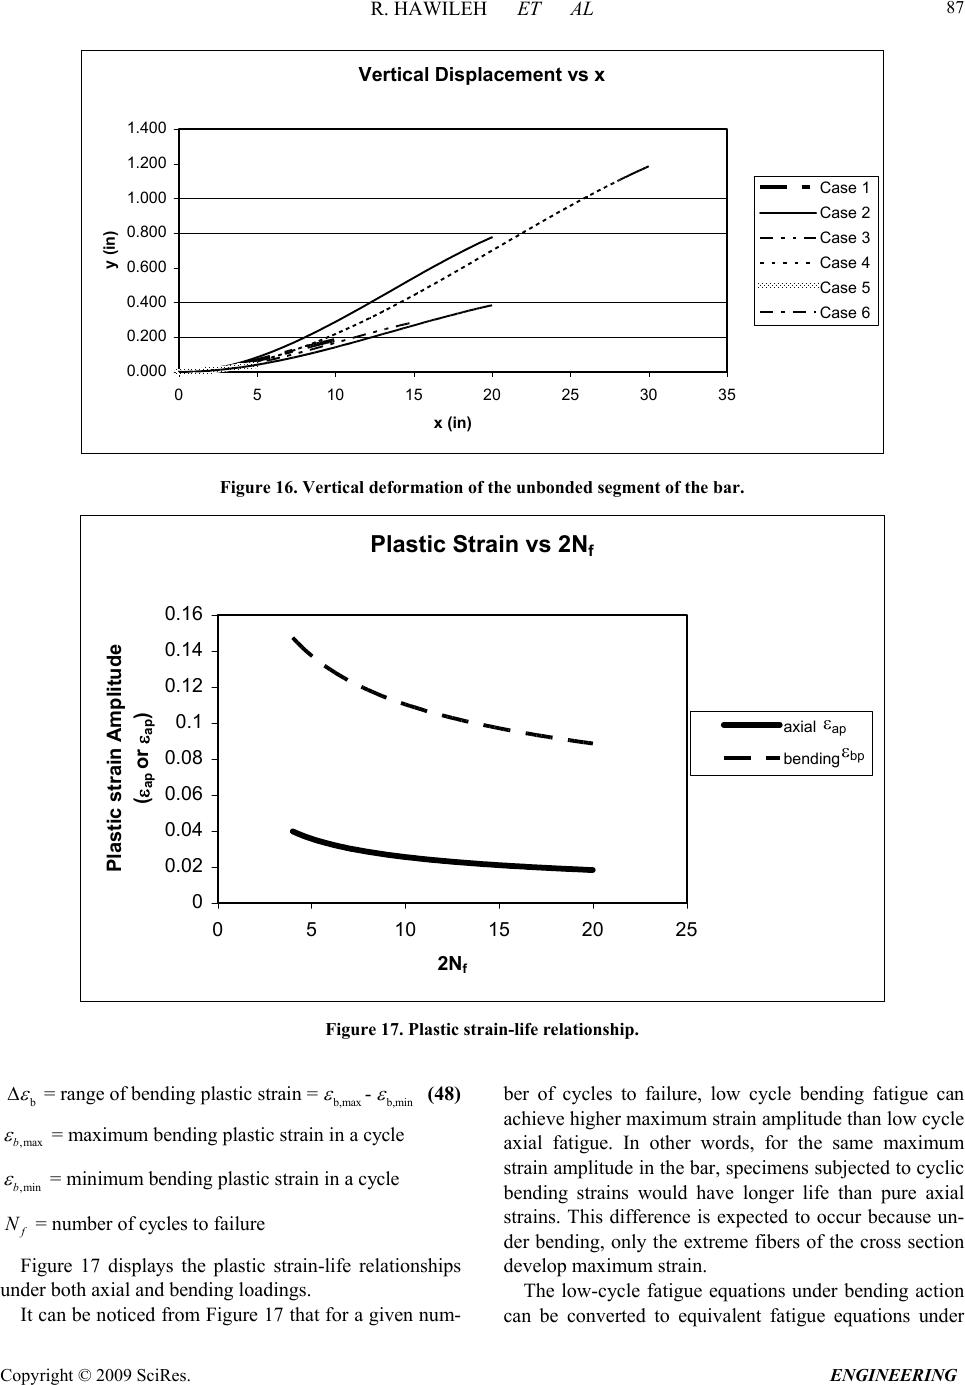 R. HAWILEH ET AL Copyright © 2009 SciRes. ENGINEERING 87 Vertical Displacement vs x 0.000 0.200 0.400 0.600 0.800 1.000 1.200 1.400 0510 15 20 25 30 35 x (in) y (in) Case 1 Case 2 Case 3 Case 4 Case 5 Case 6 Figure 16. Vertical deformation of the unbonded segment of the bar. Plastic Strain vs 2N f 0 0.02 0.04 0.06 0.08 0.1 0.12 0.14 0.16 0510 15 20 25 2N f Plastic strain Amplitude ( ap or ap ) axial bending ap bp Figure 17. Plastic strain-life relationship. b b,maxb,min = range of bending plastic strain = - (48) ,max ,min = maximum bending plastic strain in a cycle = minimum bending plastic strain in a cycle = number of cycles to failure b b f N Figure 17 displays the plastic strain-life relationships under both axial and bending loadings. It can be noticed from Figure 17 that for a given num- ber of cycles to failure, low cycle bending fatigue can achieve higher maximum strain amplitude than low cycle axial fatigue. In other words, for the same maximum strain amplitude in the bar, specimens subjected to cyclic bending strains would have longer life than pure axial strains. This difference is expected to occur because un- der bending, only the extreme fibers of the cross section develop maximum strain. The low-cycle fatigue equations under bending action can be converted to equivalent fatigue equations under 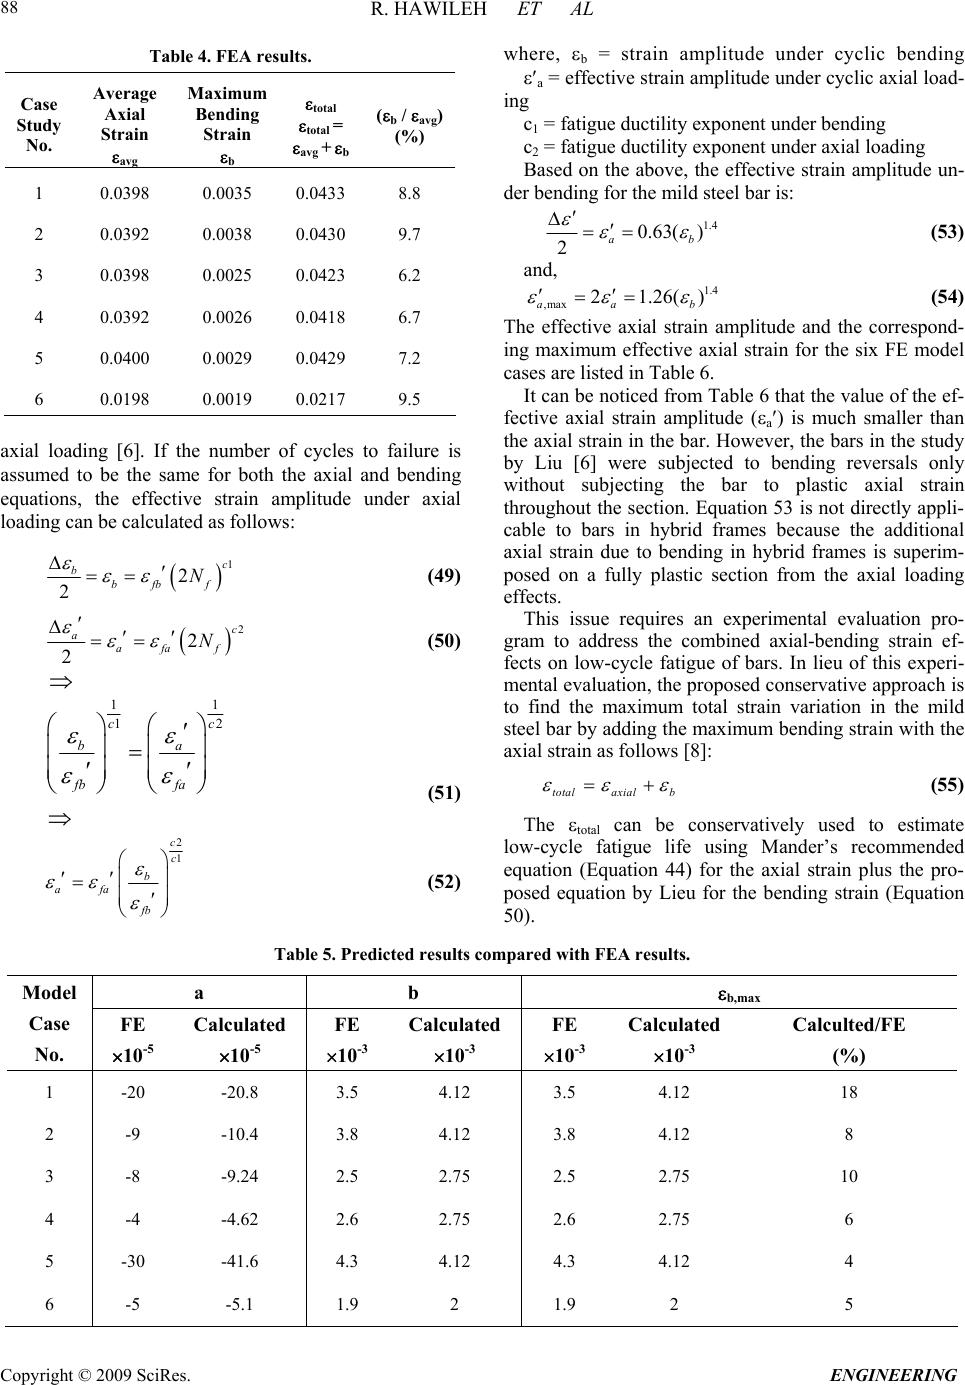 R. HAWILEH ET AL Copyright © 2009 SciRes. ENGINEERING 88 Table 4. FEA results. Case Study No. Average Axial Strain avg Maximum Bending Strain b total total = avg + b (b / avg) (%) 1 0.0398 0.0035 0.0433 8.8 2 0.0392 0.0038 0.0430 9.7 3 0.0398 0.0025 0.0423 6.2 4 0.0392 0.0026 0.0418 6.7 5 0.0400 0.0029 0.0429 7.2 6 0.0198 0.0019 0.0217 9.5 axial loading [6]. If the number of cycles to failure is assumed to be the same for both the axial and bending equations, the effective strain amplitude under axial loading can be calculated as follows: 1 2 2 c b bfb f N (49) 2 2 2 c a afa f N (50) 11 12cc ba fb fa (51) 2 1 c c b afa fb (52) where, b = strain amplitude under cyclic bending a = effective strain amplitude under cyclic axial load- ing c1 = fatigue ductility exponent under bending c2 = fatigue ductility exponent under axial loading Based on the above, the effective strain amplitude un- der bending for the mild steel bar is: 1.4 0.63( ) 2a b (53) and, 1.4 ,max21.26() aa b (54) The effective axial strain amplitude and the correspond- ing maximum effective axial strain for the six FE model cases are listed in Table 6. It can be noticed from Table 6 that the value of the ef- fective axial strain amplitude (a) is much smaller than the axial strain in the bar. However, the bars in the study by Liu [6] were subjected to bending reversals only without subjecting the bar to plastic axial strain throughout the section. Equation 53 is not directly appli- cable to bars in hybrid frames because the additional axial strain due to bending in hybrid frames is superim- posed on a fully plastic section from the axial loading effects. This issue requires an experimental evaluation pro- gram to address the combined axial-bending strain ef- fects on low-cycle fatigue of bars. In lieu of this experi- mental evaluation, the proposed conservative approach is to find the maximum total strain variation in the mild steel bar by adding the maximum bending strain with the axial strain as follows [8]: totalaxial b (55) The total can be conservatively used to estimate low-cycle fatigue life using Mander’s recommended equation (Equation 44) for the axial strain plus the pro- posed equation by Lieu for the bending strain (Equation 50). Table 5. Predicted results compared with FEA results. a b b,max Model Case No. FE 10-5 Calculated 10-5 FE 10-3 Calculated 10-3 FE 10-3 Calculated 10-3 Calculted/FE (%) 1 -20 -20.8 3.5 4.12 3.5 4.12 18 2 -9 -10.4 3.8 4.12 3.8 4.12 8 3 -8 -9.24 2.5 2.75 2.5 2.75 10 4 -4 -4.62 2.6 2.75 2.6 2.75 6 5 -30 -41.6 4.3 4.12 4.3 4.12 4 6 -5 -5.1 1.9 2 1.9 2 5 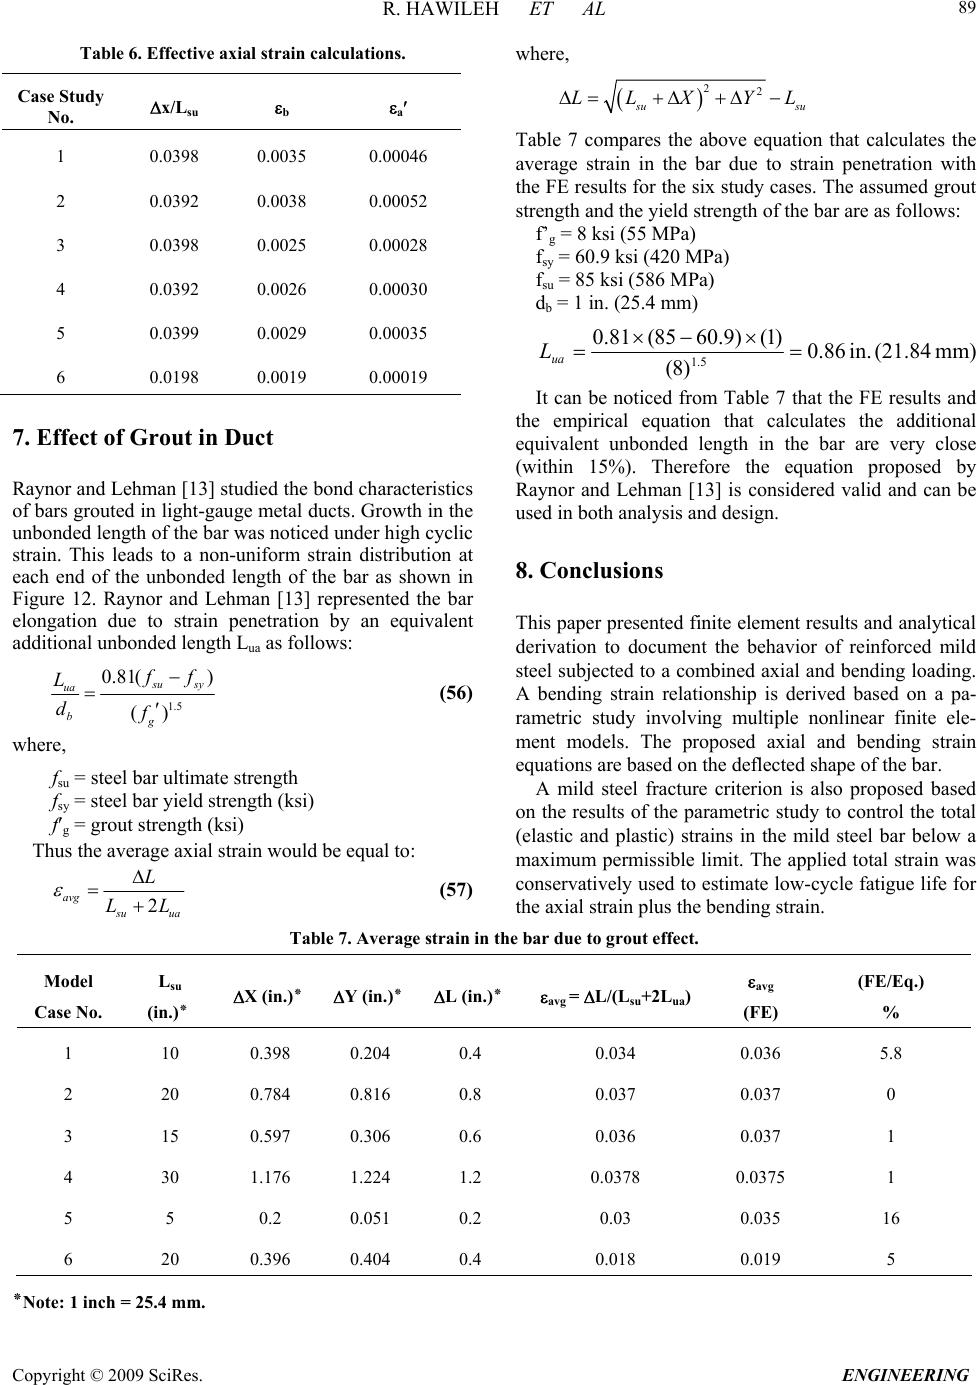 R. HAWILEH ET AL Copyright © 2009 SciRes. ENGINEERING 89 Table 6. Effective axial strain calculations. Case Study No. x/Lsu b a 1 0.0398 0.0035 0.00046 2 0.0392 0.0038 0.00052 3 0.0398 0.0025 0.00028 4 0.0392 0.0026 0.00030 5 0.0399 0.0029 0.00035 6 0.0198 0.0019 0.00019 7. Effect of Grout in Duct Raynor and Lehman [13] studied the bond characteristics of bars grouted in light-gauge metal ducts. Growth in the unbonded length of the bar was noticed under high cyclic strain. This leads to a non-uniform strain distribution at each end of the unbonded length of the bar as shown in Figure 12. Raynor and Lehman [13] represented the bar elongation due to strain penetration by an equivalent additional unbonded length Lua as follows: 1.5 0.81( ) () s usy ua bg f f L df (56) where, fsu = steel bar ultimate strength fsy = steel bar yield strength (ksi) fg = grout strength (ksi) Thus the average axial strain would be equal to: 2 avg s uu L LL where, 22 s us LLX YL u Table 7 compares the above equation that calculates the average strain in the bar due to strain penetration with the FE results for the six study cases. The assumed grout strength and the yield strength of the bar are as follows: f’g = 8 ksi (55 MPa) fsy = 60.9 ksi (420 MPa) fsu = 85 ksi (586 MPa) db = 1 in. (25.4 mm) mm) (21.84 in. 86.0 )8( )1()9.6085( 81.0 5.1 ua L It can be noticed from Table 7 that the FE results and the empirical equation that calculates the additional equivalent unbonded length in the bar are very close (within 15%). Therefore the equation proposed by Raynor and Lehman [13] is considered valid and can be used in both analysis and design. 8. Conclusions This paper presented finite element results and analytical derivation to document the behavior of reinforced mild steel subjected to a combined axial and bending loading. A bending strain relationship is derived based on a pa- rametric study involving multiple nonlinear finite ele- ment models. The proposed axial and bending strain equations are based on the deflected shape of the bar. A mild steel fracture criterion is also proposed based on the results of the parametric study to control the total (elastic and plastic) strains in the mild steel bar below a maximum permissible limit. The applied total strain was conservatively used to estimate low-cycle fatigue life for the axial strain plus the bending strain. a (57) Table 7. Average strain in the bar due to grout effect. Model Case No. Lsu X (in.)٭ Y (in.)٭ L (in.)٭ (in.)٭ avg = L/(Lsu+2Lua) avg (FE) (FE/Eq.) % 1 10 0.398 0.204 0.4 0.034 0.036 5.8 2 20 0.784 0.816 0.8 0.037 0.037 0 3 15 0.597 0.306 0.6 0.036 0.037 1 4 30 1.176 1.224 1.2 0.0378 0.0375 1 5 5 0.2 0.051 0.2 0.03 0.035 16 6 20 0.396 0.404 0.4 0.018 0.019 5 ٭Note: 1 inch = 25.4 mm. 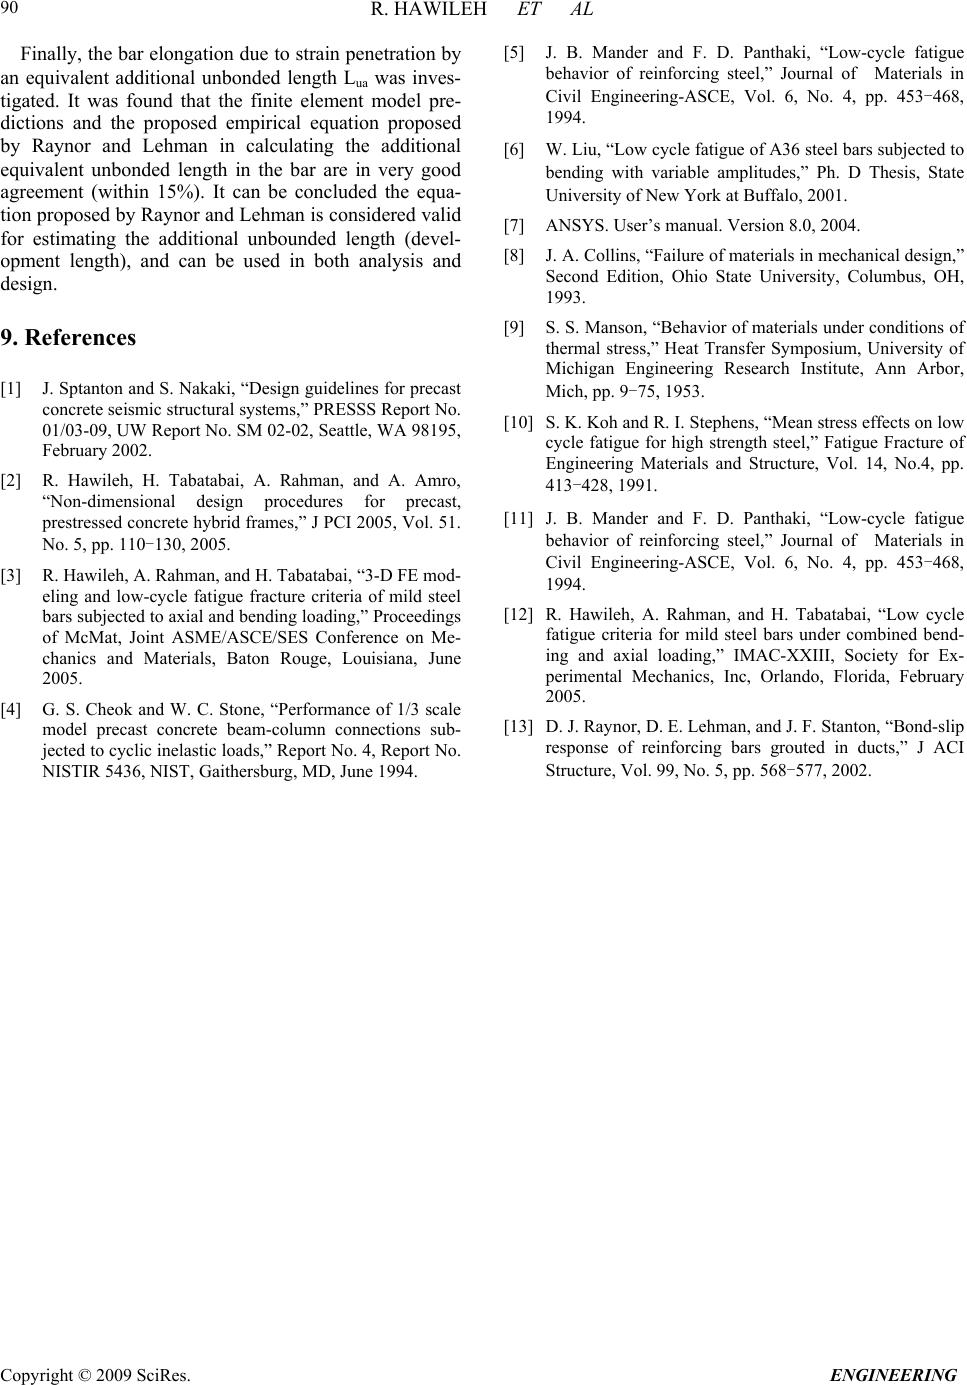 R. HAWILEH ET AL Copyright © 2009 SciRes. ENGINEERING 90 Finally, the bar elongation due to strain penetration by an equivalent additional unbonded length Lua was inves- tigated. It was found that the finite element model pre- dictions and the proposed empirical equation proposed by Raynor and Lehman in calculating the additional equivalent unbonded length in the bar are in very good agreement (within 15%). It can be concluded the equa- tion proposed by Raynor and Lehman is considered valid for estimating the additional unbounded length (devel- opment length), and can be used in both analysis and design. 9. References [1] J. Sptanton and S. Nakaki, “Design guidelines for precast concrete seismic structural systems,” PRESSS Report No. 01/03-09, UW Report No. SM 02-02, Seattle, WA 98195, February 2002. [2] R. Hawileh, H. Tabatabai, A. Rahman, and A. Amro, “Non-dimensional design procedures for precast, prestressed concrete hybrid frames,” J PCI 2005, Vol. 51. No. 5, pp. 110-130, 2005. [3] R. Hawileh, A. Rahman, and H. Tabatabai, “3-D FE mod- eling and low-cycle fatigue fracture criteria of mild steel bars subjected to axial and bending loading,” Proceedings of McMat, Joint ASME/ASCE/SES Conference on Me- chanics and Materials, Baton Rouge, Louisiana, June 2005. [4] G. S. Cheok and W. C. Stone, “Performance of 1/3 scale model precast concrete beam-column connections sub- jected to cyclic inelastic loads,” Report No. 4, Report No. NISTIR 5436, NIST, Gaithersburg, MD, June 1994. [5] J. B. Mander and F. D. Panthaki, “Low-cycle fatigue behavior of reinforcing steel,” Journal of Materials in Civil Engineering-ASCE, Vol. 6, No. 4, pp. 453-468, 1994. [6] W. Liu, “Low cycle fatigue of A36 steel bars subjected to bending with variable amplitudes,” Ph. D Thesis, State University of New York at Buffalo, 2001. [7] ANSYS. User’s manual. Version 8.0, 2004. [8] J. A. Collins, “Failure of materials in mechanical design,” Second Edition, Ohio State University, Columbus, OH, 1993. [9] S. S. Manson, “Behavior of materials under conditions of thermal stress,” Heat Transfer Symposium, University of Michigan Engineering Research Institute, Ann Arbor, Mich, pp. 9-75, 1953. [10] S. K. Koh and R. I. Stephens, “Mean stress effects on low cycle fatigue for high strength steel,” Fatigue Fracture of Engineering Materials and Structure, Vol. 14, No.4, pp. 413-428, 1991. [11] J. B. Mander and F. D. Panthaki, “Low-cycle fatigue behavior of reinforcing steel,” Journal of Materials in Civil Engineering-ASCE, Vol. 6, No. 4, pp. 453-468, 1994. [12] R. Hawileh, A. Rahman, and H. Tabatabai, “Low cycle fatigue criteria for mild steel bars under combined bend- ing and axial loading,” IMAC-XXIII, Society for Ex- perimental Mechanics, Inc, Orlando, Florida, February 2005. [13] D. J. Raynor, D. E. Lehman, and J. F. Stanton, “Bond-slip response of reinforcing bars grouted in ducts,” J ACI Structure, Vol. 99, No. 5, pp. 568-577, 2002. |