M. KUMAR ET AL.
93
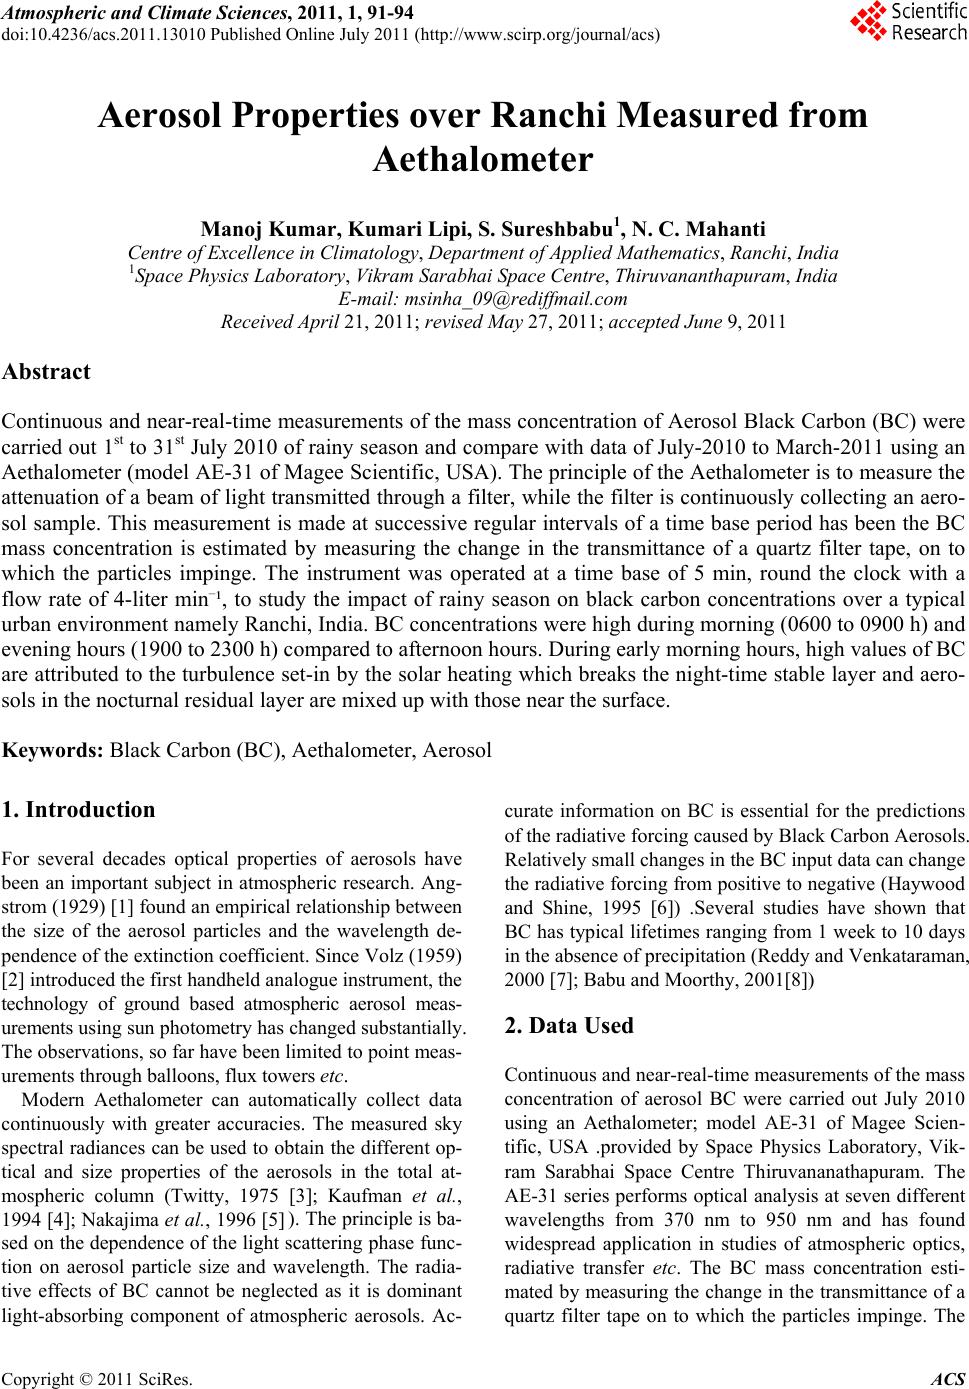
Figure 4. Diurnal variation of Aerosol concentration on
rainy season of July on 880 nm black carbon concentration
on hourly basis for July 10.
continental featu res conductive for aerosol generation by
shifting the air mass (Latha and Badarinath [9], 2005).
During daytime from 12:30 to 17:30 hrs, high BC values
are observed during rainy days in comparison to clear
days; which may be due to cloud cover during rainy days
in comparison to clear days; which may be due to cloud
cover during rainy days because the boundary layer is
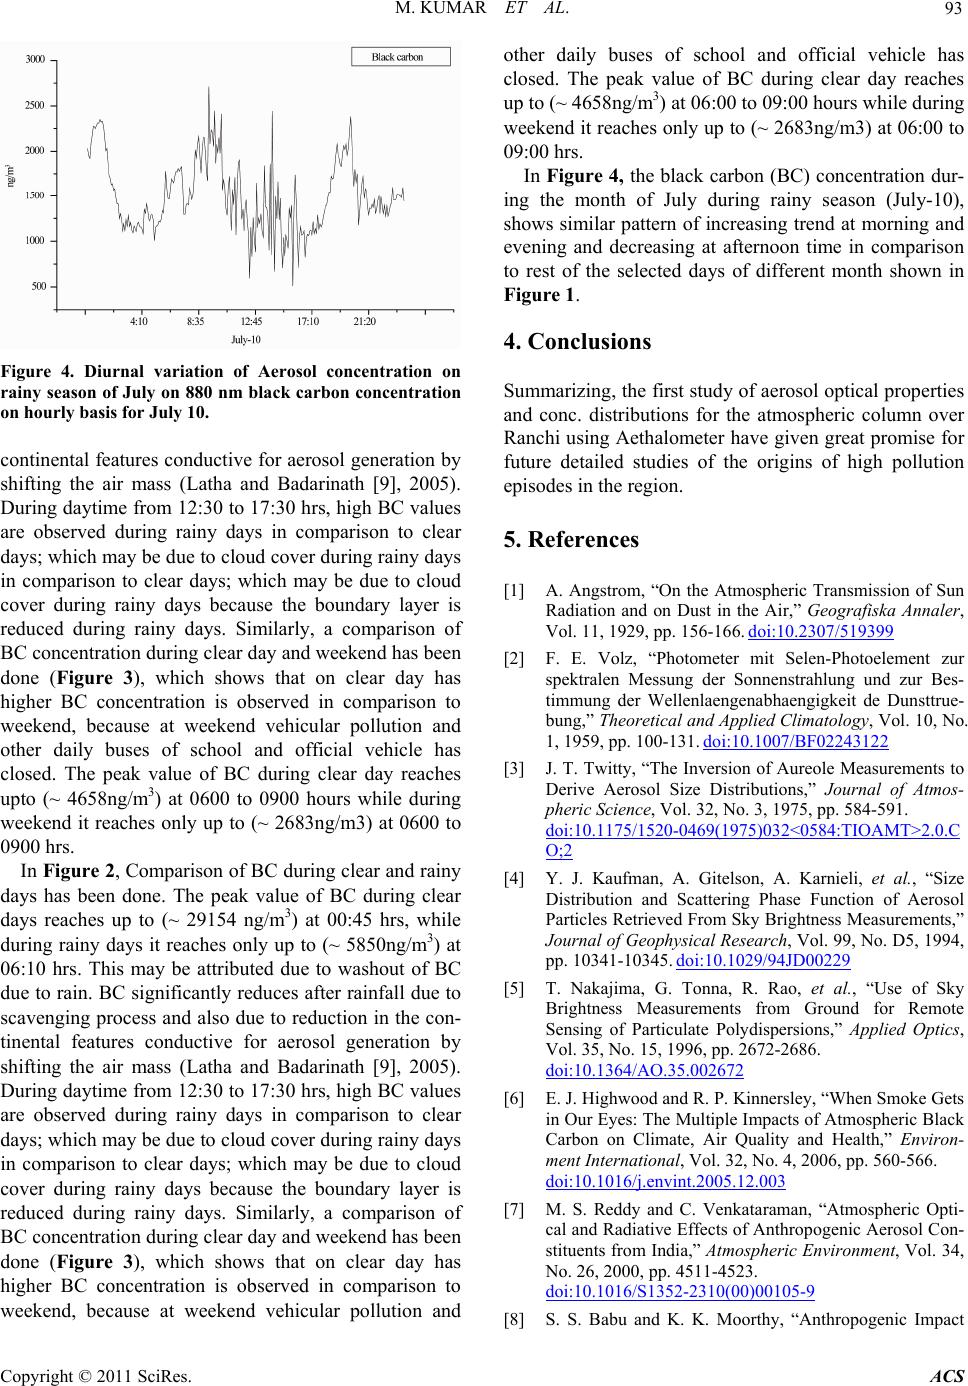
reduced during rainy days. Similarly, a comparison of
BC concentration during clear day and weekend has been
done (Figure 3), which shows that on clear day has
higher BC concentration is observed in comparison to
weekend, because at weekend vehicular pollution and
other daily buses of school and official vehicle has
closed. The peak value of BC during clear day reaches
upto (~ 4658ng/m3) at 0600 to 0900 hours while during
weekend it reaches only up to (~ 2683ng/m3) at 0600 to
0900 hrs.
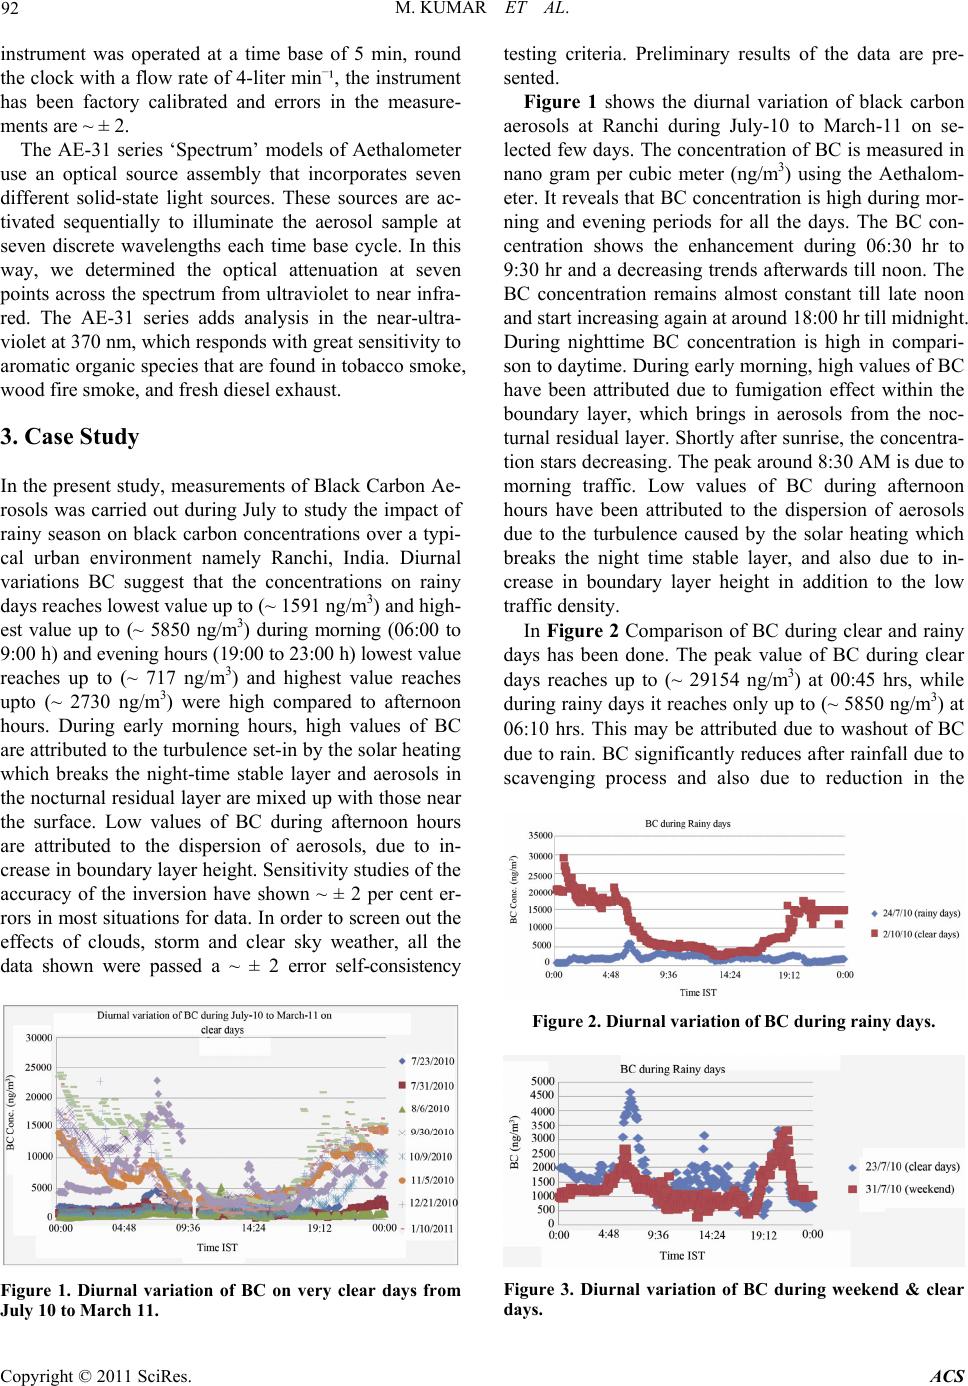
In Figure 2, Comparison of BC during clear and rainy
days has been done. The peak value of BC during clear
days reaches up to (~ 29154 ng/m3) at 00:45 hrs, while
during rainy days it reaches only up to (~ 5850ng/m3) at
06:10 hrs. This may be attributed due to washout of BC
due to rain. BC significantly reduces after rainfall due to
scavenging process and also due to reduction in the con-
tinental features conductive for aerosol generation by
shifting the air mass (Latha and Badarinath [9], 2005).
During daytime from 12:30 to 17:30 hrs, high BC values
are observed during rainy days in comparison to clear
days; which may be due to cloud cover during rainy days
in comparison to clear days; which may be due to cloud
cover during rainy days because the boundary layer is
reduced during rainy days. Similarly, a comparison of
BC concentration during clear day and weekend has been
done (Figure 3), which shows that on clear day has
higher BC concentration is observed in comparison to
weekend, because at weekend vehicular pollution and
other daily buses of school and official vehicle has
closed. The peak value of BC during clear day reaches
up to (~ 4658ng/m3) at 06:00 to 09:00 hours while during
weekend it reache s only up to (~ 2683ng/m3) at 06:00 to
09:00 hrs.
In Figure 4, the black car bon (BC) concentration dur-
ing the month of July during rainy season (July-10),
shows similar pattern of increasing trend at morning and
evening and decreasing at afternoon time in comparison
to rest of the selected days of different month shown in
Figure 1.
4. Conclusions
Summarizing, the first study of aerosol optical properties
and conc. distributions for the atmospheric column over
Ranchi using Aethalometer have given great promise for
future detailed studies of the origins of high pollution
episodes in the region.
5. References
[1] A. Angstrom, “On the Atmospheric Transmission of Sun
Radiation and on Dust in the Air,” Geografiska Annaler,
Vol. 11, 1929, pp. 156-166. doi:10.2307/519399
[2] F. E. Volz, “Photometer mit Selen-Photoelement zur
spektralen Messung der Sonnenstrahlung und zur Bes-
timmung der Wellenlaengenabhaengigkeit de Dunsttrue-
bung,” Theoretical and Applied Climatology, Vol. 10, No.
1, 1959, pp. 100-131. doi:10.1007/BF02243122
[3] J. T. Twitty, “The Inversion of Aureole Measurements to
Derive Aerosol Size Distributions,” Journal of Atmos-
pheric Science, Vol. 32, No. 3, 1975, pp. 584-591.
doi:10.1175/1520-0469(1975)032<0584:TIOAMT>2.0.C
O;2
[4] Y. J. Kaufman, A. Gitelson, A. Karnieli, et al., “Size
Distribution and Scattering Phase Function of Aerosol
Particles Retrieve d From Sky Brightness Measurements,”
Journal of Geophysical Research, Vol. 99, No. D5, 1994,
pp. 10341-10345. doi:10.1029/94JD00229
[5] T. Nakajima, G. Tonna, R. Rao, et al., “Use of Sky
Brightness Measurements from Ground for Remote
Sensing of Particulate Polydispersions,” Applied Optics,
Vol. 35, No. 15, 1996, pp. 2672-2686.
doi:10.1364/AO.35.002672
[6] E. J. Highwood and R. P. Kinnersley, “When Smoke Gets
in Our Eyes: The Multiple Impacts of Atmospheric Black
Carbon on Climate, Air Quality and Health,” Environ-
ment International, Vol. 32, No. 4, 2006, pp. 560-566.
doi:10.1016/j.envint.2005.12.003
[7] M. S. Reddy and C. Venkataraman, “Atmospheric Opti-
cal and Radiative Effects of Anthropogenic Aerosol Con-
stituents from India,” Atmospheric Environment, Vol. 34,
No. 26, 2000, pp. 4511-4523.
doi:10.1016/S1352-2310(00)00105-9
[8] S. S. Babu and K. K. Moorthy, “Anthropogenic Impact
Copyright © 2011 SciRes. ACS