 Atmospheric and Climate Sciences, 2011, 1, 100-112 doi:10.4236/acs.2011.13012 Published Online July 2011 (http://www.scirp.org/journal/acs) Copyright © 2011 SciRes. ACS Effect of Urbanization and Industrialization Processes on Outdoor Thermal Human Comfort in Egypt S. M. Robaa Astronomy and Meteorology Department, Faculty of Science, Cairo University, Giza, Egypt E-mail: d_robaa@hotmail.com Received April 17, 2011; revised May 24, 2011; accepted June 7, 2011 Abstract Detailed studies on the effect of urbanization and industrialization processes on outdoor thermal human com- fort in Greater Cairo region, Egypt have been performed in this study. Four different districts in Greater Cairo region have been selected to represent rural, suburban, typical urban and industrial areas. The data of surface dry, wet bulb temperatures and wind speed for two different periods represent non-urbanized and urbanized periods have been used. Discomfort indices for the two periods have been calculated for the four districts. The study revealed that urbanization and industrialization processes have resulted in the distinctly modification of human comfortable at all districts. The feeling of quite comfortable reduced from the old non-urbanized period to the recent urbanized period at the four districts. During the recent urbanized period, the rural area has the highest total number of quite comfortable hours while both urban and industrial areas have the lowest total number of hours. The serious hot uncomfortable didn’t occur at all districts during the old non-urbanized period while during the recent urbanized period, all people had felt extreme serious hot uncomfortable only at urban and industrial areas. It could be concluded that the urbanization and industriali- zation processes cause increase of human serious hot uncomfortable feeling which in turn leads to more hin- dering for the human activities while the rural conditions leads to optimum weather comfort for further and more human activities. Keywords: Human Comfort, Urbanization, Industrialization, Greater Cairo Region, Egypt 1. Introduction Whether discomfort is caused by either one of the factors depend on the climatic conditions. The main meteorolo- gical factors that largely influence the physiological sen- sation of human comfort are temperature, humidity and wind speed. Also, heavy rains and direct intensive inso- lation could be causes of discomfort. A number of indi- ces utilizing some of these factors have been proposed by different authors, based on the physiological feeling of a large number of people [1-13]. The thermal sensation of heat discomfort is experi- enced under "steady state” conditions, when the average skin temperature is elevated above the level correspond- ing to the state of comfort. Under sedentary activity, it is about 32 - 33˚C. The main environmental conditions, which affect the thermal sensation of heat, are the air and radiant temperatures, and the air velocity over the body. The effect of air velocity on the thermal sensation de- pends on the environmental temperature. At temperatures below 32˚C, increasing air velocity reduces the heat sen- sation due to the higher convective heat loss from the body and lowering of the skin temperature. At tem- peratures between about 33˚C and 37˚C air velocities does not affect significantly the thermal sensation. At environmental temperatures above 37˚C, increased air velocity actually increases the thermal sensation of heat [14]. Thermal sensation has two clearly defined limits. The lower limit is attained when the skin is completely dry and the upper limit is considered when the whole body and clothing are soaked with sweat. Between these two limits there are intermediate levels, which can be defined quite clearly [15]. When the evaporation rates are much faster than sweat Secretion the sweat evaporates as it emerges from the pores of the skin, without forming a liquid layer over the skin. The skin is then felt as dry. With increasing sweat rate or decreasing rate of evaporation, sweat spreads over the skin, increasing the effective area of evaporation takes place. In this way the body can keep a rate of  S. M. ROBAA 101 evaporative potential to the environment. However, sub- jectively the moist skin causes discomfort although it is an essential ingredient in the physiological thermoregu- lation. The rate of sweating is determined by the balance between metabolic heat production and the heat loss by convection and radiation. Under hot humid conditions the cooling efficiency of sweating decreases, as part of the sweat evaporates over hair and the clothing and de- rives part of the energy from the ambient air instead of from the body. The sweat rate and evaporation then ex- ceed the need for evaporation cooling to compensate for the reduced cooling efficiency. Urbanization and industrialization processes have re- sulted in the modification of local city climate [9] and [16-29]. The urbanization and industrialization have in- creased very rapidly in Greater Cairo region, particularly in the last few years of the last century causing extreme local climatic changes [9]. Therefore, the aims of this study are to examine the effect of urbanization and in- dustrialization processes on outdoor thermal comfort in Greater Cairo region, Egypt. The results of this study are useful for native people and as a guide to tourists or visitors for understanding thermal comfort, planning out- door recreational activities and developing the tourist industry. 2. Methodolgy and Estimations Siple and Passel [30] constructed chill index relates hu- man feeling to the prevailing weather conditions (dry temperature and wind speed); their index, K, is expressed as follows; d K10 V +10.45-V33T (1) where, V is the wind speed (m/s) and Td is the dry tem- perature (˚C) of surface air. On the other hand, [31] studied the effects of tem- perature and humidity on the human body. He deter- mined a discomfort index, TI, using a simple linear ad- justment applied to the average of the dry and wet bulb temperatures readings; dW TI0.72 TT40.6 (2) where Tw is wet bulb temperature in ˚C. Also, the human feeling to the prevailing weather conditions (dry temperature and relative humidity), MI, could be calculated using the formula of [32]; dd MIT0.4T10RH /100 (3) where RH is the relative humidity in %. The following comments could be concluded. Siple and Passel’s index includes a considerable wind effect on human comfort but the effect of humidity has not been Table 1. Criterions of, RI, at different discomforts. RI values Human feeling RI < 60 60 ≤ RI < 65 65 ≤ RI < 75 75 ≤ RI < 80 80 ≤ RI < 85 85 ≤ RI All people feel quite uncomfortable cooling. 50% of people feel partial uncomfortable cooling. All people feel quite comfortable. 50% of people feel partially uncomfortable heat. All people feel uncomfortable heat. All people feel extreme serious uncomfortable heat. Figure 1. Map of Greater Cairo Region, GCR (Study area) (The rural, suburban, urban and areas are indicated). considered. Furthermore, both Thom's and Missenard’s indices do not include the effect of wind speed in spite of its active role in assessing human comfort. Therefore, Robaa [33] proposed formula accounting for the combined effect of the three weather elements (dry air temperature, humidity and wind speed) on hu- man discomfort. His formula, RI, is expressed as fol- lows; dW RI 1.53T0.32T1.38V 44.65 (4) The range of applicability of this formula (formula 4) is wide and adequate for Egypt's climate. The criterions of RI are given in Table 1. Robaa [33] used RI (formula 4) and Table 1 to deter- mine the thermal comfort and discomfort over the whole Egypt country in daytime and nighttime of different mon- ths of the year. He compared the obtained results of RI with the results of Thom and Siple’s indices for the same observations. He found that RI is closely related to both Siple and Passel (Equation 1) and Thom (Equation 2) indices, however, RI, illustrates the integrated effect of both wind speed and humidity in changes on human comfortable. Many evidences have been performed to illustrate that the proposed Robaa index, RI, gives pre- Copyright © 2011 SciRes. ACS  102 S. M. ROBAA Table 2. Coordinates and brief locations description. Stations Lat. (N) Long. (E) Brief description of their sites Bahtim 30˚08' 31˚15' An agrometeorological station, lies on the border between urbanized and cultivated area. Cairo (A. P.) 30˚08' 31˚24' Suburban site in the eastern desert. Abbasiya 30˚05' 31˚17' Typical urban site surrounded by overpopu- lation towns in all directions except SE-direction. Helwan 29˚52' 31˚20' Heavy industrial site lies in south east of Cairo City in eastern desert. cise estimations for assessing human comfortable than other discomfort indices [33]. This study examines the impacts of urbanization and industrialization processes on thermal comfort in urban Greater Cairo Region, GCR, Egypt. Therefore, four dif- ferent districts in GCR, namely, Bahtim, Cairo Airport, Abbasiya and Helwan have been chosen to represent rural, suburban, urban and industrial area respectively (Figure 1 and Table 2). RI index is used in this study to determine the thermal comfort values over the above four districts 3. Study Area The study area of GCR lies in south of Delta of the Nile basin. It is considered as one of the world’s 15 largest cities in urban and population growth. Population in GCR exceeds 18 millions concentrated over an area of about 214 km2 (almost 4.2 km width and 50 km along the sides of the River Nile). The urbanization and indus- trialization have increased very rapidly in Greater Cairo, particularly in the second half of the last century causing an increase in the pollution of its atmosphere. This in turn has an effective role in intensifying the problem of contaminating Cairo’s environment with various impuri- ties and environmental hazards [34]. Climatologically, GCR follows the subtropical cli- matic region. It is characterized by the presence of Mo- qattam hills to its east and south east, then desert areas extending in the west and east directions. Among the outstanding weather events are the dust and sandstorms frequently blow in transitional seasons of spring (March to May) and autumn (September to November). In spring, hot desert depressions are known as the Khamsin depres- sions. They are always associated with strong hot dry wind often laden with dust and sand increasing the at- mospheric pollution. In winter season (December to Feb- ruary) the general climate of Greater Cairo region is cold, moist and rainy while during summer season (Jun to August), Cairo’s climate is hot, dry and rainless. Greater Cairo region is composed of four main parts (Figure 1): (1) The Shubra El-Kheima industrial complex area lies at the northern boundary of Cairo City. Its area is about 30 km2 and over 550 industrial plants of various sizes. Textile manufacturing is the predominant activity, fol- lowed by engineering construction, chemical, petroleum and electrical industries. Emissions from these industries directly affect the air quality in the Central Cairo since it is frequently upstream [35]. There has no any meteoro- logical stations established at Shubra El-Kheima till now. (2) The Central Cairo lies at the center on the east bank of the River Nile. It accommodates more than 80% of the area population and includes thousands of small factories and workshops in addition to more than one and half million of automobiles travelling on the city roads. (3) A narrow strip of Giza Governorate runs along the western side of the River Nile, opposite to the Central Cairo. This sector has two mains, but small, industrial centers: one in the northern part of the strip and other in the south. Residential districts lie between both industrial centers. (4) The heavy industry area of Helwan, is about 24 km to the south east of the Central Cairo. A brief description and basic information of the four selected districts (Figure 1 and Table 2) are given be- low; Bahtim agrometeorological station lies about 13 km to the north west of Central Cairo near the border between urbanized and cultivated area. It has been established at the end of 1966 in the field of the Agricultural Research Station of the Agricultural Society at Bahtim and is working on routing basis up till now (2011). The obser- vational field at Bahtim included a dry and bare field up to 1970. Afterwards it included a wet field covered with grass (Lippa-Nodiflora). The surrounding area was cul- tivated land and it was considered to be a good example of the rural area. The irrigation in Bahtim in addition to the Nile water is considered important and good moisture sources. Fortunately, although the population and human activities started increasing rapidly nearby Bahtim area during the last few last years, its typical rural conditions is still completely existing until now (2011). The international Cairo Airport lies about 29 km to the north east border of Central Cairo in the eastern desert. The Airport is surrounded by the desert from all its di- rections except the southwest direction where the loca- tion of Central Cairo and Abbasiya urban area. There is a very vast open area around Airport runway. There are no any buildings or human activities around the Airport and a shortest distance between the nearest buildings and Airport place is not less than 12 km. Much of asphalt roads and the associated traffics exist around the Airport to connect it by the surrounding countries. The local soil of the Airport is originally desert sand and there has no any moisture sources at Airport location. Copyright © 2011 SciRes. ACS  S. M. ROBAA 103 Abbasiya meteorological station (main building of the Egyptian Meteorological Authority, EMA) lies on the east bank of the River Nile near Central Cairo on the road leading from the city to the suburb of Heliopolis, to the northeast part of Cairo city. Much of factories exist in the nearby area also, where high density of buildings and high density of population exists in addition to thousands cars and buses. Streets are covered by asphalt and gar- dens are not abundant. The local soil is originally desert sand. There have no any moisture sources except River Nile. Generally, air quality in Abbasiya station represents the typical urbanization occurs in and around Cairo City. Helwan is the heavy industry area, is about 24 km to the south east of the city of Cairo. The most important factors in this area are the steel, cement, chemical, fertil- izer, brick and car industries and power plants. Before 1970, this city was an international famous calm place distinguished by its fine and good weather as well as its known natural spring. Peoples from different parts of the country and from different countries usually visited it enjoyed its good weather and exposing themselves to the beneficial solar radiation. From 1970, industrialization has been growing very rapid in and around Helwan. Therefore a significant variation of surface air tempera- tures, relative humidity and other meteorological ele- ments causes increase of the green house effect as a re- sult of increase air pollution [36]. These industrial proc- esses cause decrease of wind speed and increase of at- mospheric heating over Helwan especially in summer months. This is due to sharp increase of aerosols and gaseous pollutants in Helwan’s atmosphere from both natural and industrial sources [9]. All the above stations were adequately and regularly serviced by EMA. 4. Data Used The available monthly mean daily values of measured Td, Tw (˚C) and V (m/s), at eight fixed hours (0000, 0300, 0600, 0900, 1200, 1500, 1800 and 2100 GMT) for non- urbanized periods (1967-1976) and (1947-1956) at Bahtim and other three districts respectively and for re- cent urbanized period (1990-2009) at the four districts have been taken from EMA and used in this study. Hourly mean discomfort index for all year months has been calculated for the four districts applying Robaa’s discomfort index, RI, (Equation 4). Results are given as isopleths in Figures 5 and 6. Six ranges of discomfort index are considered corresponding to values; RI < 60, 60 ≤ RI < 65, 65 ≤ RI < 75, 75 ≤ RI < 80, 80 ≤ RI < 85 and 85 ≤ RI (Table 1). The number of hours of discom- fort index in each of the above ranges in each month of the two periods at the mentioned districts are given in Tables 3-7. Also, the monthly mean values of dry air temperature, Td (˚C), relative humidity, RH (%) and wind speed, V (kt) at the four selected stations for the recent urbanized period (1990-2009) have been used and presented in Figures 2-4 to give an idea of how local surface conditions modify the microclimates. These data were also obtained from EMA. 5. Results and Discussion 5.1. The Annual Variation of Td Figure 2 illustrates that monthly mean dry temperature, Td, rises at the four understudy stations (Bahtim, Cairo Airport, Abbasyia and Helwan) very regularly from low values during winter season to high values in summer season. The coldest month during the considered period is January while the hottest month is August at the four different locations (Figure 2). It could be noticed that monthly mean dry temperature, Td, values at the industrial area (Helwan) are always greater than urban (Abbasyia), suburban (Cairo Airport) and rural (Bahtim) areas with higher values of urban than rural area during all months (Figure 2). The greater Td values at the industrial area is due to the heavy industrial collection at Helwan and highly polluted air causing green house effect leading to rising surface air tempera- ture during all months of the year [12]. Also, it could be noticed that the Td values of the ur- ban area are closest to the values of industrial area during all year months. This is attributed to high concentration of smoke and aerosols in Abbasiya’s atmosphere result- ing from more than 2 millions cars and buses moving in its streets, in addition to increase of industries in a big in- dustrial activity area of Shubra-El Kheima (lies at the Figure 2. Annual variation of mean temperature, Td (˚C) at the industrial, urban, suburban and rural areas in GCR during the period (1990-2009). Copyright © 2011 SciRes. ACS 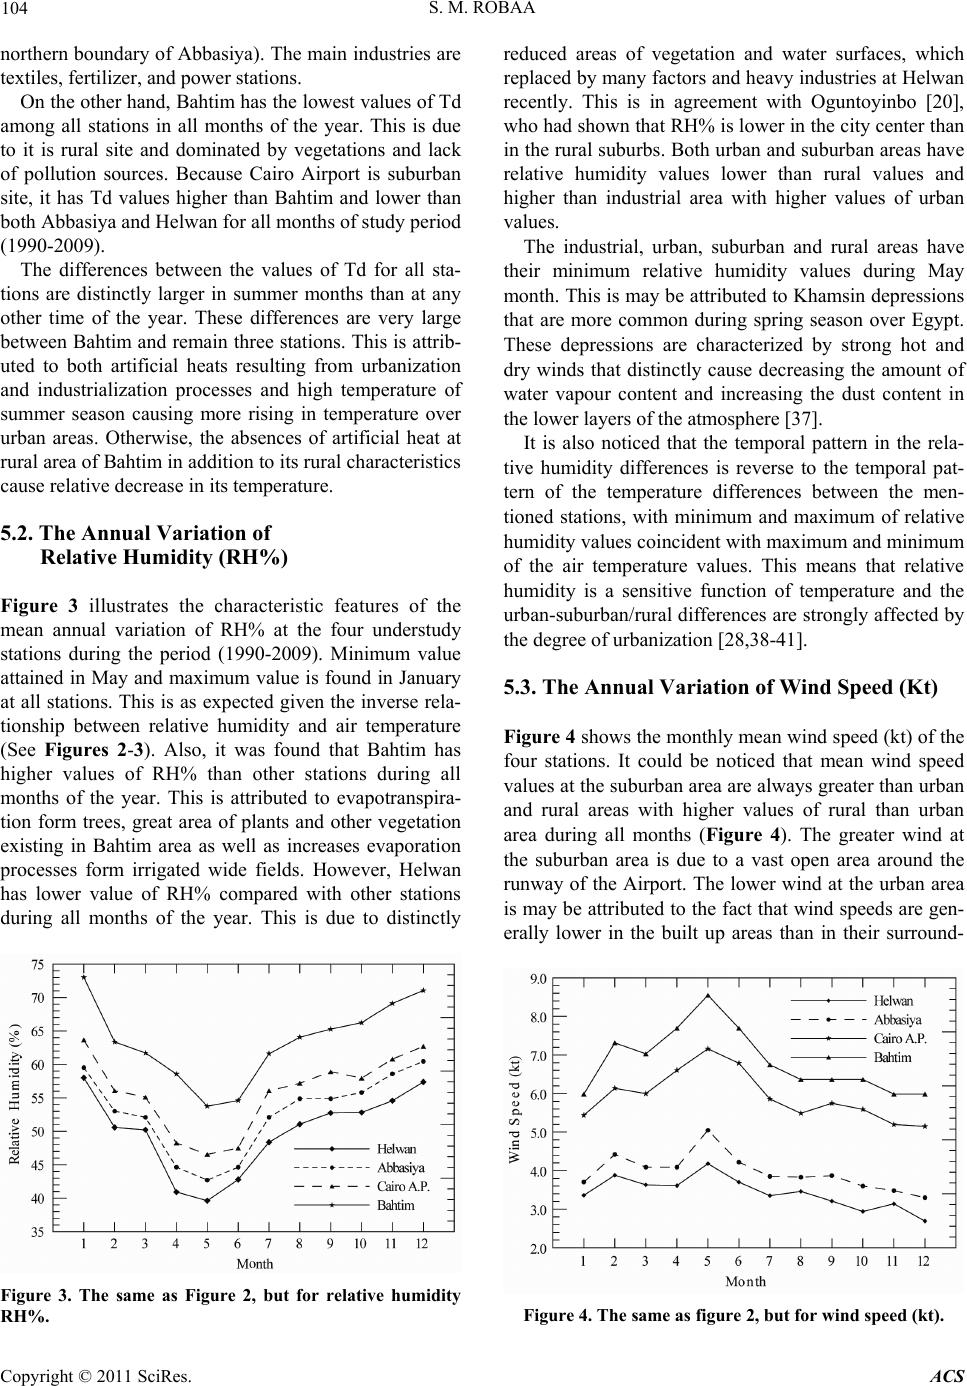 104 S. M. ROBAA northern boundary of Abbasiya). The main industries are textiles, fertilizer, and power stations. On the other hand, Bahtim has the lowest values of Td among all stations in all months of the year. This is due to it is rural site and dominated by vegetations and lack of pollution sources. Because Cairo Airport is suburban site, it has Td values higher than Bahtim and lower than both Abbasiya and Helwan for all months of study period (1990-2009). The differences between the values of Td for all sta- tions are distinctly larger in summer months than at any other time of the year. These differences are very large between Bahtim and remain three stations. This is attrib- uted to both artificial heats resulting from urbanization and industrialization processes and high temperature of summer season causing more rising in temperature over urban areas. Otherwise, the absences of artificial heat at rural area of Bahtim in addition to its rural characteristics cause relative decrease in its temperature. 5.2. The Annual Variation of Relative Humidity (RH%) Figure 3 illustrates the characteristic features of the mean annual variation of RH% at the four understudy stations during the period (1990-2009). Minimum value attained in May and maximum value is found in January at all stations. This is as expected given the inverse rela- tionship between relative humidity and air temperature (See Figures 2-3). Also, it was found that Bahtim has higher values of RH% than other stations during all months of the year. This is attributed to evapotranspira- tion form trees, great area of plants and other vegetation existing in Bahtim area as well as increases evaporation processes form irrigated wide fields. However, Helwan has lower value of RH% compared with other stations during all months of the year. This is due to distinctly Figure 3. The same as Figure 2, but for relative humidity RH%. reduced areas of vegetation and water surfaces, which replaced by many factors and heavy industries at Helwan recently. This is in agreement with Oguntoyinbo [20], who had shown that RH% is lower in the city center than in the rural suburbs. Both urban and suburban areas have relative humidity values lower than rural values and higher than industrial area with higher values of urban values. The industrial, urban, suburban and rural areas have their minimum relative humidity values during May month. This is may be attributed to Khamsin depressions that are more common during spring season over Egypt. These depressions are characterized by strong hot and dry winds that distinctly cause decreasing the amount of water vapour content and increasing the dust content in the lower layers of the atmosphere [37]. It is also noticed that the temporal pattern in the rela- tive humidity differences is reverse to the temporal pat- tern of the temperature differences between the men- tioned stations, with minimum and maximum of relative humidity values coincident with maximum and minimum of the air temperature values. This means that relative humidity is a sensitive function of temperature and the urban-suburban/rural differences are strongly affected by the degree of urbanization [28,38-41]. 5.3. The Annual Variation of Wind Speed (Kt) Figure 4 shows the monthly mean wind speed (kt) of the four stations. It could be noticed that mean wind speed values at the suburban area are always greater than urban and rural areas with higher values of rural than urban area during all months (Figure 4). The greater wind at the suburban area is due to a vast open area around the runway of the Airport. The lower wind at the urban area is may be attributed to the fact that wind speeds are gen- erally lower in the built up areas than in their surround- Figure 4. The same as figure 2, but for wind speed (kt). Copyright © 2011 SciRes. ACS 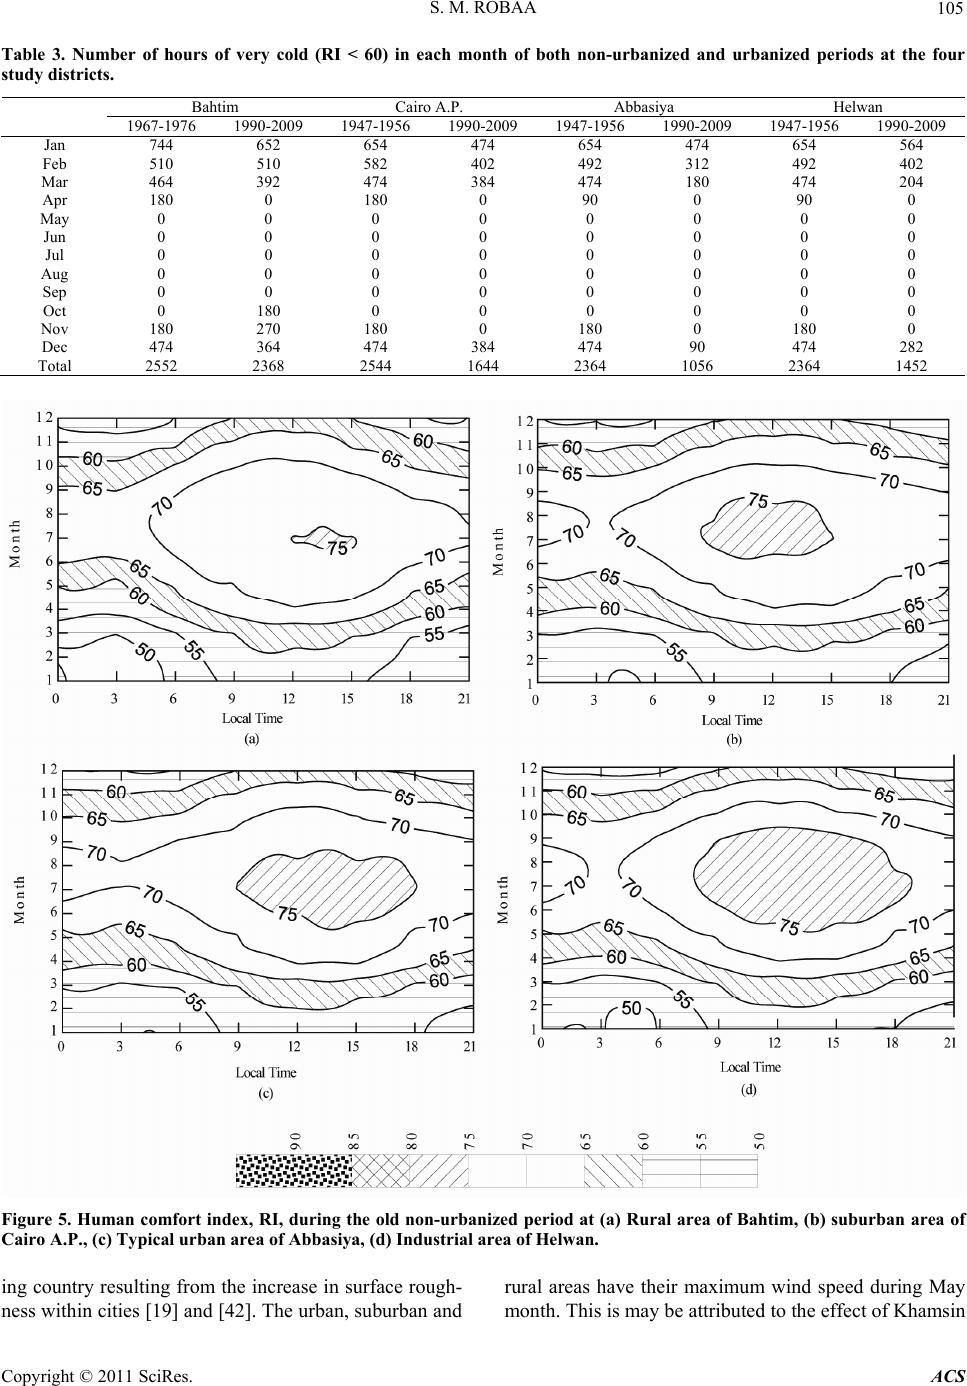 S. M. ROBAA Copyright © 2011 SciRes. ACS 105 Table 3. Number of hours of very cold (RI < 60) in each month of both non-urbanized and urbanized periods at the four study districts. Bahtim Cairo A.P. Abbasiya Helwan 1967-1976 1990-2009 1947-1956 1990-2009 1947-1956 1990-2009 1947-1956 1990-2009 Jan 744 652 654 474 654 474 654 564 Feb 510 510 582 402 492 312 492 402 Mar 464 392 474 384 474 180 474 204 Apr 180 0 180 0 90 0 90 0 May 0 0 0 0 0 0 0 0 Jun 0 0 0 0 0 0 0 0 Jul 0 0 0 0 0 0 0 0 Aug 0 0 0 0 0 0 0 0 Sep 0 0 0 0 0 0 0 0 Oct 0 180 0 0 0 0 0 0 Nov 180 270 180 0 180 0 180 0 Dec 474 364 474 384 474 90 474 282 Total 2552 2368 2544 1644 2364 1056 2364 1452 Figure 5. Human comfort index, RI, during the old non-urbanized period at (a) Rural area of Bahtim, (b) suburban area of Cairo A.P., (c) Typical urban area of Abbasiya, (d) Industrial area of Helwan. ing country resulting from the increase in surface rough- ness within cities [19] and [42]. The urban, suburban and rural areas have their maximum wind speed during May month. This is may be attributed to the effect of Khamsin 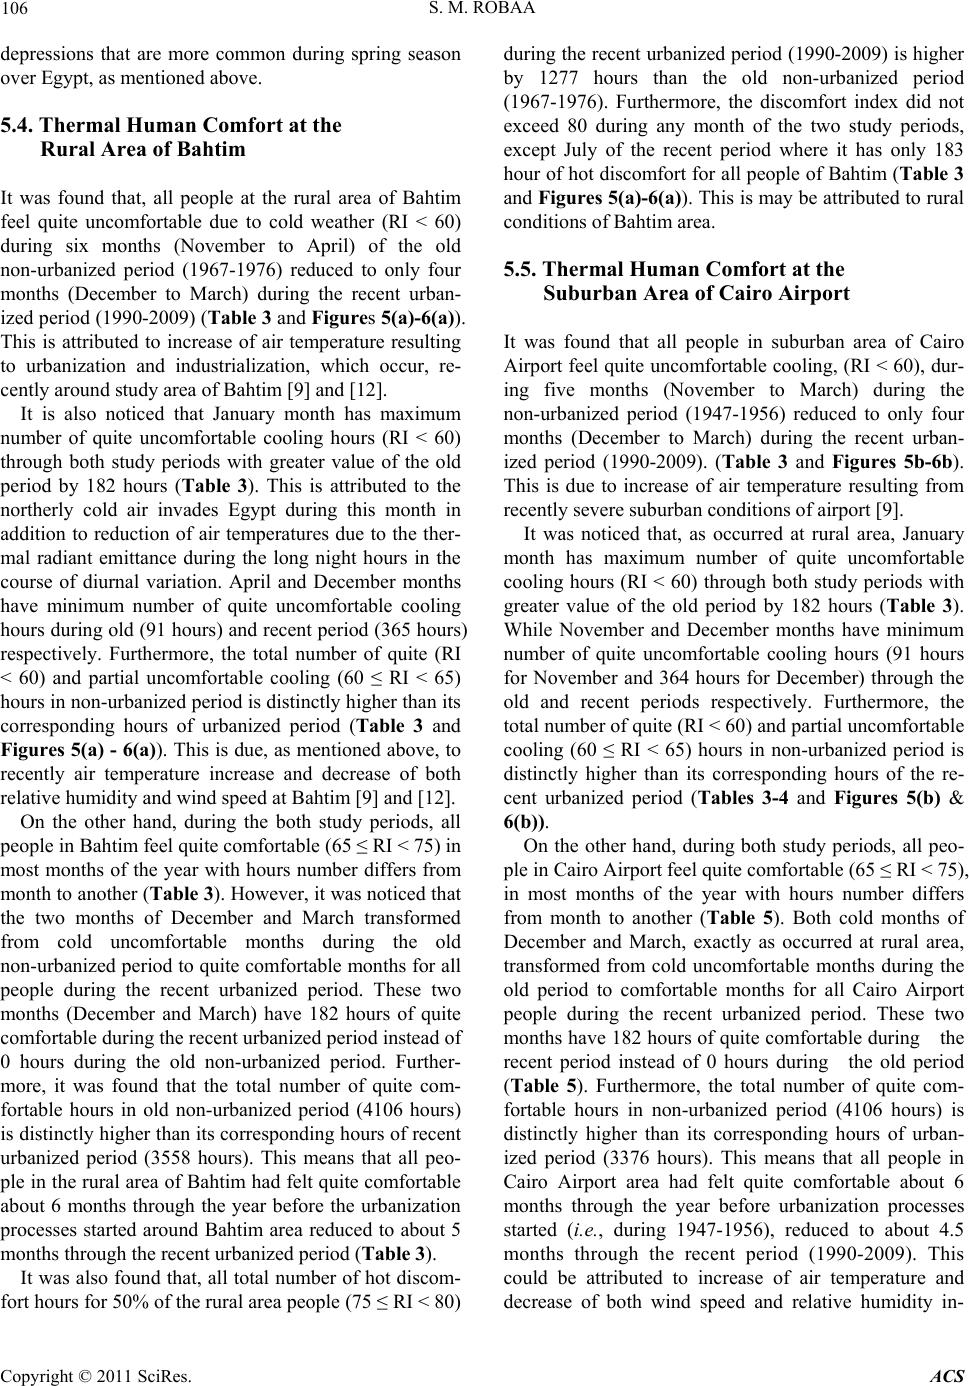 106 S. M. ROBAA depressions that are more common during spring season over Egypt, as mentioned above. 5.4. Thermal Human Comfort at the Rural Area of Bahtim It was found that, all people at the rural area of Bahtim feel quite uncomfortable due to cold weather (RI < 60) during six months (November to April) of the old non-urbanized period (1967-1976) reduced to only four months (December to March) during the recent urban- ized period (1990-2009) (Table 3 and Figures 5(a)-6(a)). This is attributed to increase of air temperature resulting to urbanization and industrialization, which occur, re- cently around study area of Bahtim [9] and [12]. It is also noticed that January month has maximum number of quite uncomfortable cooling hours (RI < 60) through both study periods with greater value of the old period by 182 hours (Table 3). This is attributed to the northerly cold air invades Egypt during this month in addition to reduction of air temperatures due to the ther- mal radiant emittance during the long night hours in the course of diurnal variation. April and December months have minimum number of quite uncomfortable cooling hours during old (91 hours) and recent period (365 hours) respectively. Furthermore, the total number of quite (RI < 60) and partial uncomfortable cooling (60 ≤ RI < 65) hours in non-urbanized period is distinctly higher than its corresponding hours of urbanized period (Table 3 and Figures 5(a) - 6(a)). This is due, as mentioned above, to recently air temperature increase and decrease of both relative humidity and wind speed at Bahtim [9] and [12]. On the other hand, during the both study periods, all people in Bahtim feel quite comfortable (65 ≤ RI < 75) in most months of the year with hours number differs from month to another (Table 3). However, it was noticed that the two months of December and March transformed from cold uncomfortable months during the old non-urbanized period to quite comfortable months for all people during the recent urbanized period. These two months (December and March) have 182 hours of quite comfortable during the recent urbanized period instead of 0 hours during the old non-urbanized period. Further- more, it was found that the total number of quite com- fortable hours in old non-urbanized period (4106 hours) is distinctly higher than its corresponding hours of recent urbanized period (3558 hours). This means that all peo- ple in the rural area of Bahtim had felt quite comfortable about 6 months through the year before the urbanization processes started around Bahtim area reduced to about 5 months through the recent urbanized period (Table 3). It was also found that, all total number of hot discom- fort hours for 50% of the rural area people (75 ≤ RI < 80) during the recent urbanized period (1990-2009) is higher by 1277 hours than the old non-urbanized period (1967-1976). Furthermore, the discomfort index did not exceed 80 during any month of the two study periods, except July of the recent period where it has only 183 hour of hot discomfort for all people of Bahtim (Table 3 and Figures 5(a)-6(a)). This is may be attributed to rural conditions of Bahtim area. 5.5. Thermal Human Comfort at the Suburban Area of Cairo Airport It was found that all people in suburban area of Cairo Airport feel quite uncomfortable cooling, (RI < 60), dur- ing five months (November to March) during the non-urbanized period (1947-1956) reduced to only four months (December to March) during the recent urban- ized period (1990-2009). (Table 3 and Figures 5b-6b). This is due to increase of air temperature resulting from recently severe suburban conditions of airport [9]. It was noticed that, as occurred at rural area, January month has maximum number of quite uncomfortable cooling hours (RI < 60) through both study periods with greater value of the old period by 182 hours (Table 3). While November and December months have minimum number of quite uncomfortable cooling hours (91 hours for November and 364 hours for December) through the old and recent periods respectively. Furthermore, the total number of quite (RI < 60) and partial uncomfortable cooling (60 ≤ RI < 65) hours in non-urbanized period is distinctly higher than its corresponding hours of the re- cent urbanized period (Tables 3-4 and Figures 5(b) & 6(b)). On the other hand, during both study periods, all peo- ple in Cairo Airport feel quite comfortable (65 ≤ RI < 75), in most months of the year with hours number differs from month to another (Table 5). Both cold months of December and March, exactly as occurred at rural area, transformed from cold uncomfortable months during the old period to comfortable months for all Cairo Airport people during the recent urbanized period. These two months have 182 hours of quite comfortable during the recent period instead of 0 hours during the old period (Table 5). Furthermore, the total number of quite com- fortable hours in non-urbanized period (4106 hours) is distinctly higher than its corresponding hours of urban- ized period (3376 hours). This means that all people in Cairo Airport area had felt quite comfortable about 6 months through the year before urbanization processes started (i.e., during 1947-1956), reduced to about 4.5 months through the recent period (1990-2009). This could be attributed to increase of air temperature and ecrease of both wind speed and relative humidity in- d Copyright © 2011 SciRes. ACS  S. M. ROBAA Copyright © 2011 SciRes. ACS 107 Table 4. Number of hours of cold (60 ≤ RI < 65) in each month of both non-urbanized and urbanized periods at the four study districts. Bahtim Cairo A.P Abbasiya Helwan 1967-1976 1990-2009 1947-1956 1990-2009 1947-1956 1990-2009 1947-1956 1990-2009 Jan 0 92 90 270 90 180 90 90 Feb 162 162 90 270 180 90 180 90 Mar 190 190 270 180 270 282 180 270 Apr 270 270 180 270 180 0 270 0 May 270 190 270 90 180 90 180 0 Jun 90 0 0 0 0 0 0 0 Jul 0 0 0 0 0 0 0 0 Aug 0 0 0 0 0 0 0 0 Sep 0 0 0 0 0 0 0 0 Oct 270 162 180 0 180 0 180 0 Nov 270 180 270 360 270 180 270 90 Dec 270 290 270 180 270 384 270 180 Total 1792 1536 1620 1620 1620 1206 1620 720 Table 5. Number of hours of quite comfortable (65 ≤ RI < 75) in each month of both non-urbanized and urbanized periods at the four study districts. Bahtim Cairo A.P Abbasiya Helwan 1967-1976 1990-2009 1947-1956 1990-2009 1947-1956 1990-2009 1947-1956 1990-2009 Jan 0 0 0 0 0 90 0 90 Feb 0 0 0 0 0 270 0 180 Mar 90 162 0 180 0 282 90 270 Apr 270 450 360 360 450 450 360 450 May 474 364 474 384 564 384 474 372 Jun 630 360 630 360 540 180 450 180 Jul 564 190 564 180 564 0 474 0 Aug 744 372 654 270 564 0 564 0 Sep 720 450 720 450 630 270 450 180 Oct 474 402 564 654 564 474 564 474 Nov 270 270 270 360 270 450 270 540 Dec 0 90 0 180 0 270 0 282 Total 4236 3110 4236 3378 4146 3120 3696 3018 duced by urbanization process that recently occurred at airport area [9] and [12]. It was also found that, all total number of partial un- comfortable heat (75 ≤ RI < 80) hours for the recent pe- riod (1990-2009) is higher by 1095 hours than the non-urbanized period (1947-1956). In addition, discom- fort index did not exceed 80 during any month of the non-urbanized period, but the hot uncomfortable (80 < RI < 85) for all people of Cairo Airport started by grow- ing of urbanization through the last few decades. There are 548 hours of hot uncomfortable occurred during the daytime of three months (June to August) especially around local noon as shown in Figure 6(b) and Table 7. Fortunately, the discomfort index did not exceed 85 dur- ing any month of the both study periods at Cairo Airport. 5.6. Thermal Human Comfort at the Urban Area of Abbasiya It was found that all people in urban area of Abbasiya feel quite uncomfortable cooling (RI < 60) during only four cold months (December to March) during the non-urbanized period (1947-1956) reduced to only three months (January to March) during the recent urbanized period (1990-2009) (Table 3 and Figures (5) & (6)). This is attributed to distinctly increase of air temperature and decrease of both wind speed and relative humidity induced by urbanization process that recently occurred in and around urban area of Abbasiya [9] and [12]. It is also noticed that, as occurred at the rural and subur- ban areas, January month has maximum number of quite uncomfortable cooling hours (RI < 60) through both study periods (730 and 365 hours for the old and recent period respectively) with twice greater value of the old period (Table 3). While December and March months have minimum number of quite uncomfortable cooling hours (456 hours for both months) through the old period while the minimum hour number of the recent period (91 hours) occurred in March. Furthermore, the total number of quite (RI < 60) and partial uncomfortable cooling (60 ≤ RI < 65) hours in non-urbanized period is distinctly higher than its corresponding hours of the recent urban- ized period (Tables 3 & 4 and Figures 5© & 6(c)). On the other hand, during the two study periods, all people in Abbasiya feel quite comfortable (65 ≤ RI < 75) n most months of the year with hours number differs i 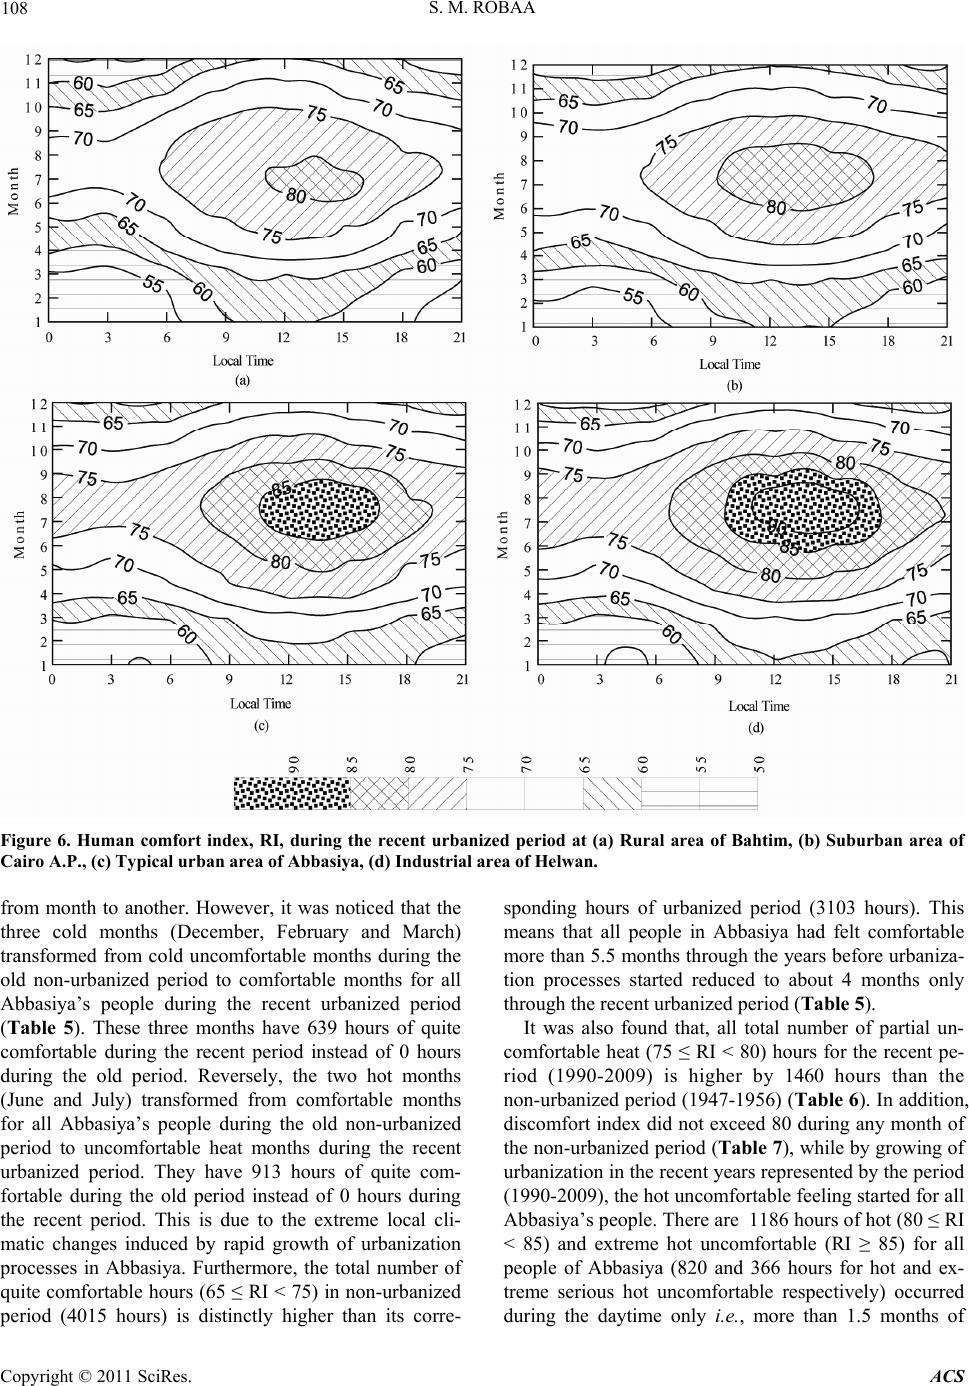 S. M. ROBAA Copyright © 2011 SciRes. ACS 108 Figure 6. Human comfort index, RI, during the recent urbanized period at (a) Rural area of Bahtim, (b) Suburban area of Cairo A.P., (c) Typical urban area of Abbasiya, (d) Industrial area of Helwan. from month to another. However, it was noticed that the three cold months (December, February and March) transformed from cold uncomfortable months during the old non-urbanized period to comfortable months for all Abbasiya’s people during the recent urbanized period (Table 5). These three months have 639 hours of quite comfortable during the recent period instead of 0 hours during the old period. Reversely, the two hot months (June and July) transformed from comfortable months for all Abbasiya’s people during the old non-urbanized period to uncomfortable heat months during the recent urbanized period. They have 913 hours of quite com- fortable during the old period instead of 0 hours during the recent period. This is due to the extreme local cli- matic changes induced by rapid growth of urbanization processes in Abbasiya. Furthermore, the total number of quite comfortable hours (65 ≤ RI < 75) in non-urbanized period (4015 hours) is distinctly higher than its corre- sponding hours of urbanized period (3103 hours). This means that all people in Abbasiya had felt comfortable more than 5.5 months through the years before urbaniza- tion processes started reduced to about 4 months only through the recent urbanized period (Table 5). It was also found that, all total number of partial un- comfortable heat (75 ≤ RI < 80) hours for the recent pe- riod (1990-2009) is higher by 1460 hours than the non-urbanized period (1947-1956) (Table 6). In addition, discomfort index did not exceed 80 during any month of the non-urbanized period (Table 7), while by growing of urbanization in the recent years represented by the period (1990-2009), the hot uncomfortable feeling started for all Abbasiya’s people. There are 1186 hours of hot (80 ≤ RI < 85) and extreme hot uncomfortable (RI ≥ 85) for all people of Abbasiya (820 and 366 hours for hot and ex- treme serious hot uncomfortable respectively) occurred uring the daytime only i.e., more than 1.5 months of d  S. M. ROBAA Copyright © 2011 SciRes. ACS 109 Table 6. Number of hours of hot uncomfortable for 50% of people (75 ≤ RI < 80) in each month of both non-urbanized and urbanized periods at the four study districts. Bahtim Cairo A.P. Abbasiya Helwan 1967-1976 1990-2009 1947-1956 1990-2009 1947-1956 1990-2009 1947-1956 1990-2009 Jan 0 0 0 0 0 0 0 0 Feb 0 0 0 0 0 0 0 0 Mar 0 0 0 0 0 0 0 0 Apr 0 0 0 90 0 270 0 270 May 0 190 0 270 0 270 90 372 Jun 0 360 90 360 180 360 270 360 Jul 180 554 180 564 180 564 270 564 Aug 0 372 90 474 180 654 180 654 Sep 0 270 0 270 90 450 270 540 Oct 0 0 0 90 0 270 0 270 Nov 0 0 0 0 0 90 0 90 Dec 0 0 0 0 0 0 0 0 Total 180 1746 360 2118 630 2928 1080 3120 Table 7. Number of hours of hot uncomfortable for all people (80 ≤ RI < 85) in each month of both non-urbanized and ur- banized periods at the four study districts. Bahtim Cairo A.P Abbasiya Helwan 1967-1976 1990-2009 1947-1956 1990-2009 1947-1956 1990-2009 1947-1956 1990-2009 Jan 0 0 0 0 0 0 0 0 Feb 0 0 0 0 0 0 0 0 Mar 0 0 0 0 0 0 0 0 Apr 0 0 0 0 0 0 0 0 May 0 0 0 0 0 0 0 0 Jun 0 0 0 0 0 180 0 180 Jul 0 0 0 0 0 180 0 180 Aug 0 0 0 0 0 90 0 90 Sep 0 0 0 0 0 0 0 0 Oct 0 0 0 0 0 0 0 0 Nov 0 0 0 0 0 0 0 0 Dec 0 0 0 0 0 0 0 0 Total 0 0 0 0 0 450 0 450 people of Abbasiya (820 and 366 hours for hot and ex- treme serious hot uncomfortable respectively) occurred during the daytime only i.e., more than 1.5 months of continuous hot and extreme hot discomfort started by June and ended by September especially around local noon as shown in Figure 6 (c) and Tables 7. 5.7. Thermal Human Comfort at the Industrial Area of Helwan All people in the industrial area of Helwan feel quite uncomfortable due to cold weather (RI < 60) only during four months (December to March) of both study periods. It was found that the total number of quite (RI < 60) and partial (60 ≤ RI < 65) cold uncomfortable hours during the non-urbanized period (1947-1956) is higher than their corresponding hours in the recent period (1990- 2009), (Table 3 and Figures 5(d) & 6(d)). This is attrib- uted to distinctly increase of air temperature and de- crease of both wind speed and relative humidity induced by complex industrial processes that recently occurred at the industrial area of Helwan [9] and [12]. On the other hand, during both study periods, all peo- ple in Helwan City feel quite comfortable (65 ≤ RI < 75) in most months of the year with hours number distinctly differs from month to another (Table 5). However, it was noticed that the cold months, (December to March) transformed from cold uncomfortable season during the old non-industrial period to quite comfortable season for all Helwan’s people during the recent industrial period. This season has 913 hours of quite comfortable during the recent period instead of 0 hours during the old period. Reversely, the three hot months (July - September) transformed from quite comfortable months for all Hel- wan’s people during the old non-industrial period to hot and extreme serious hot uncomfortable months during the recent industrial period. These months have 1369 hours of quite comfortable during the old period instead of 0 hours during the recent period. Furthermore, the total number of quite comfortable hours (65 ≤ RI < 75) in non-industrial period (1947-1956) (3833 hours) is dis- tinctly higher than its corresponding hours of industrial period (1990-2009) (3103 hours). This means that all people in Helwan had felt comfortable about 5.5 months through the years before industrialization processes started at Helwan (i.e., during 1947-1956), reduced to  110 S. M. ROBAA about 4 months only through the recent period (1990- 2009). It was also found that, all total number of partial un- comfortable heat (75 ≤ RI < 80) hours for the recent pe- riod (1990-2009) is higher by 912 hours than the non-urbanized period (1947-1956) (Table 6). Further- more, discomfort index did not exceed 80 during any month of the non-urbanized period (Table 7), while by growing of the industrialization processes in the recent years, the hot uncomfortable feeling started for all Hel- wan’s people. There are 1735 hours of hot (80 ≤ RI < 85) and extreme serious hot uncomfortable (RI ≥ 85) for all Helwan’s people (1369 and 366 hours for hot and ex- treme serious hot uncomfortable respectively) occurred during the daytime only i.e., more than 2.5 months of continuous hot and extreme hot discomfort started by May and ended by September especially around local noon as shown in Figure 6(d) and Tables 7. 5.8. Urban-Suburban/Rural Human Comfort in Greater Cairo It was found that all people in rural, urban, suburban and industrial areas feel quite uncomfortable due to cold weather (RI < 60) during only four months (December to March) of both study periods exception rural area through the old non-urbanized period (Table 3). January month has maximum number of quite uncomfortable cooling hours through both study periods with greater value of the old period at all districts. This is attributed, as mentioned above, to the northerly cold air invades Egypt during this month as well as the reduction of air temperatures due to the thermal radiant emittance during the long night hours of this month. On the other hand, the total number of quite uncomfortable cooling (RI < 60) hours in rural area is higher than its corresponding hours in urban, suburban and industrial areas during both study periods except the suburban area (Table 3). This is due to rural conditions at Bahtim [9] and [12]. While the ur- ban area of Abbasiya has the lowest number of quite uncomfortable cooling (RI < 60) hours during both study periods with distinctly higher total number of hours dur- ing the old non-urbanized period. This is due to high temperature and low values of both wind speed and rela- tive humidity resulting from severe urban conditions at Abbasiya [9] and [12]. It must be noticed that the differ- ence between the highest (at rural area) and lowest (at urban area) total number of quite uncomfortable cooling hours during the old non-urbanized period (274 hours) is distinctly lower than its corresponding hours during the recent urbanized period (1095 hours). This explains the increase of urbanization effects from the old to recent period especially at the urban area of Abbasiya. It is clear that the total number of quite and partial cold uncom- fortable hours gradually decrease with the increase of urbanization degree. Furthermore, the partial uncom- fortable cooling feeling (60 ≤ RI < 65) has similar char- acteristics of quite uncomfortable cooling (RI < 60) at all districts. During the old non-urbanized period, both rural and suburban areas have the highest total number of quite comfortable (65 ≤ RI < 75) hours (4106 hour) while the industrial area of Helwan has the lowest total number of hours (3833 hours) (Table 5). The equivalence of the total number of quite comfortable hours for rural and suburban areas is may be due to the time lag of the old un-urbanized at rural (1967 - 1976) and suburban (1947 - 1956) areas. During the recent urbanized period (1990 - 2009), the rural area has also the highest total number of quite comfortable hours (3558 hour) while both urban and industrial areas have the lowest total number of hours (3103 hours). This is due to rural conditions at Bahtim and higher air temperature at urban and industrial areas resulting from artificial heat [9] and [12], (Table 5 and Figures 5-6). It must be also noticed that the differ- ence between the highest and lowest total number of quite comfortable hours during the old non-urbanized period (273 hours) is lower than its corresponding hours during the recent urbanized period (455 hours). This means that all districts are nearly characterize by rela- tively similar clear weather during the old period, but with the recently urbanization growth, its effects gradu- ally increase from old to recent period to reach its maxi- mum effect during last few years especially at urban and industrial areas. Discomfort index did not exceed 80 during both study periods at the rural area exception July month of the re- cent urbanized period whereas Bahtim has 183 hours (the lowest total number hours) of hot uncomfortable (80 ≤ RI < 85) for all people (Tables 6-7 and Figures 5(a)-6(a )). This is attributed to rural and open area of Bahtim. On the other hand, both industrial and urban areas have the largest total number of partially hot uncomfort- able (75 ≤ RI < 80) hours (1004 and 2190 hours for in- dustrial and urban areas respectively) during the old and recent period respectively (Table 6). When RI is in the range 80 - 85, everyone is expected to be uncomfortable and it becomes serious at the higher values. The num- ber of hours in all months of the year when RI is greater than 80 are given in Tables 7. It was found that the num- ber of 80 ≤ RI < 85 hours agrees with the degree of ur- banization of every station. Therefore, industrial area has the maximum number of RI > 80 hours (1369 hours) followed it directly, the urban area (821 hours) (Table 7). This is due to more population and rapidly increase of Copyright © 2011 SciRes. ACS 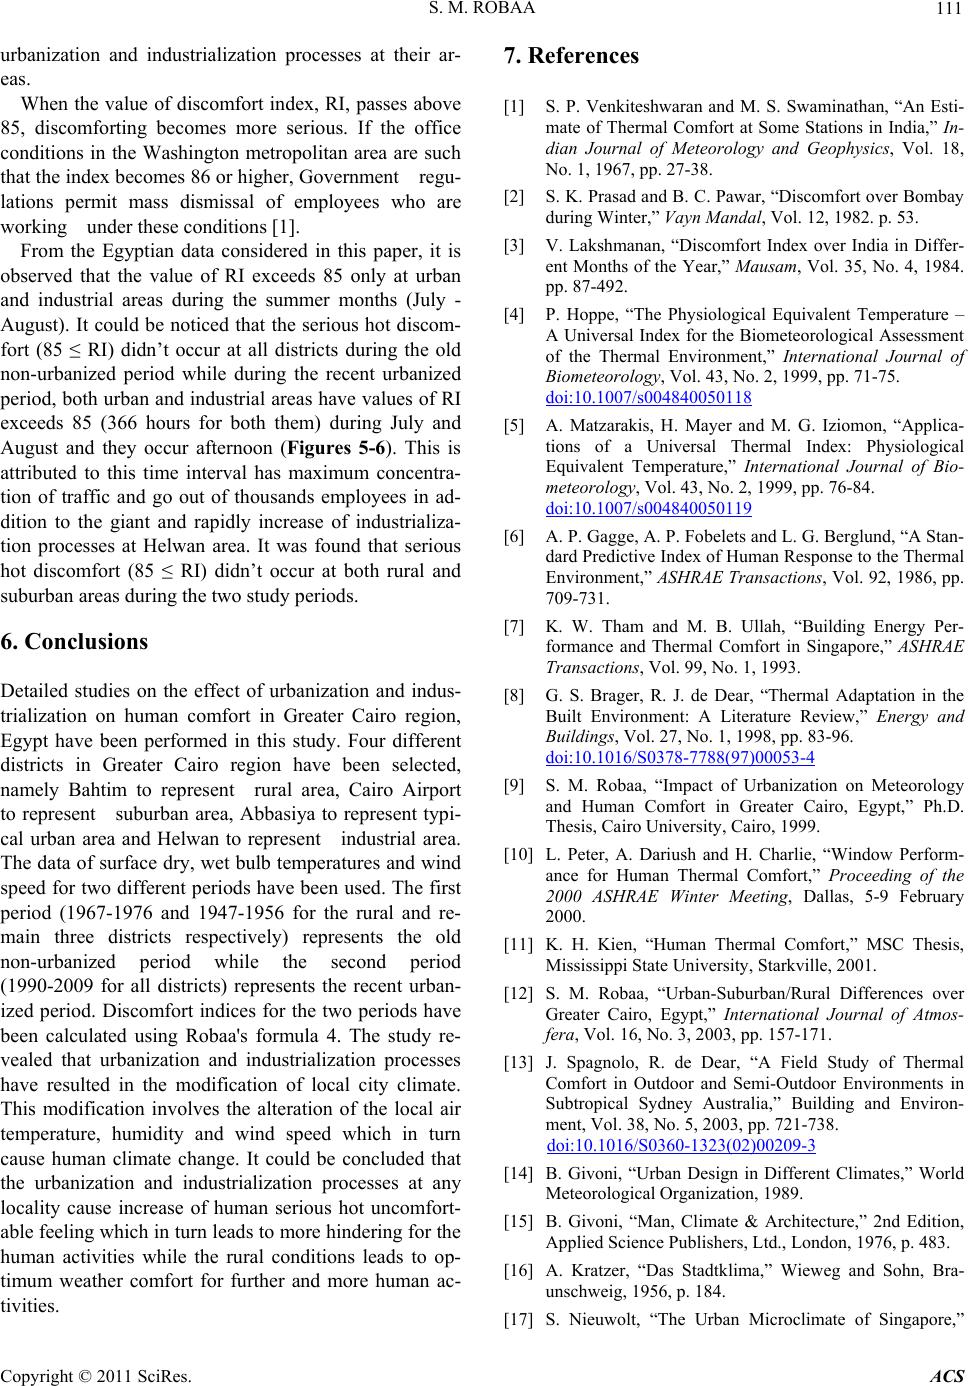 S. M. ROBAA 111 urbanization and industrialization processes at their ar- eas. When the value of discomfort index, RI, passes above 85, discomforting becomes more serious. If the office conditions in the Washington metropolitan area are such that the index becomes 86 or higher, Government regu- lations permit mass dismissal of employees who are working under these conditions [1]. From the Egyptian data considered in this paper, it is observed that the value of RI exceeds 85 only at urban and industrial areas during the summer months (July - August). It could be noticed that the serious hot discom- fort (85 ≤ RI) didn’t occur at all districts during the old non-urbanized period while during the recent urbanized period, both urban and industrial areas have values of RI exceeds 85 (366 hours for both them) during July and August and they occur afternoon (Figures 5-6). This is attributed to this time interval has maximum concentra- tion of traffic and go out of thousands employees in ad- dition to the giant and rapidly increase of industrializa- tion processes at Helwan area. It was found that serious hot discomfort (85 ≤ RI) didn’t occur at both rural and suburban areas during the two study periods. 6. Conclusions Detailed studies on the effect of urbanization and indus- trialization on human comfort in Greater Cairo region, Egypt have been performed in this study. Four different districts in Greater Cairo region have been selected, namely Bahtim to represent rural area, Cairo Airport to represent suburban area, Abbasiya to represent typi- cal urban area and Helwan to represent industrial area. The data of surface dry, wet bulb temperatures and wind speed for two different periods have been used. The first period (1967-1976 and 1947-1956 for the rural and re- main three districts respectively) represents the old non-urbanized period while the second period (1990-2009 for all districts) represents the recent urban- ized period. Discomfort indices for the two periods have been calculated using Robaa's formula 4. The study re- vealed that urbanization and industrialization processes have resulted in the modification of local city climate. This modification involves the alteration of the local air temperature, humidity and wind speed which in turn cause human climate change. It could be concluded that the urbanization and industrialization processes at any locality cause increase of human serious hot uncomfort- able feeling which in turn leads to more hindering for the human activities while the rural conditions leads to op- timum weather comfort for further and more human ac- tivities. 7. References [1] S. P. Venkiteshwaran and M. S. Swaminathan, “An Esti- mate of Thermal Comfort at Some Stations in India,” In- dian Journal of Meteorology and Geophysics, Vol. 18, No. 1, 1967, pp. 27-38. [2] S. K. Prasad and B. C. Pawar, “Discomfort over Bombay during Winter,” Vayn Mandal, Vol. 12, 1982. p. 53. [3] V. Lakshmanan, “Discomfort Index over India in Differ- ent Months of the Year,” Mausam, Vol. 35, No. 4, 1984. pp. 87-492. [4] P. Hoppe, “The Physiological Equivalent Temperature – A Universal Index for the Biometeorological Assessment of the Thermal Environment,” International Journal of Biometeorology, Vol. 43, No. 2, 1999, pp. 71-75. doi:10.1007/s004840050118 [5] A. Matzarakis, H. Mayer and M. G. Iziomon, “Applica- tions of a Universal Thermal Index: Physiological Equivalent Temperature,” International Journal of Bio- meteorology, Vol. 43, No. 2, 1999, pp. 76-84. doi:10.1007/s004840050119 [6] A. P. Gagge, A. P. Fobelets and L. G. Berglund, “A Stan- dard Predictive Index of Human Response to the Thermal Environment,” ASHRAE Transactions, Vol. 92, 1986, pp. 709-731. [7] K. W. Tham and M. B. Ullah, “Building Energy Per- formance and Thermal Comfort in Singapore,” ASHRAE Transactions, Vol. 99, No. 1, 1993. [8] G. S. Brager, R. J. de Dear, “Thermal Adaptation in the Built Environment: A Literature Review,” Energy and Buildings, Vol. 27, No. 1, 1998, pp. 83-96. doi:10.1016/S0378-7788(97)00053-4 [9] S. M. Robaa, “Impact of Urbanization on Meteorology and Human Comfort in Greater Cairo, Egypt,” Ph.D. Thesis, Cairo University, Cairo, 1999. [10] L. Peter, A. Dariush and H. Charlie, “Window Perform- ance for Human Thermal Comfort,” Proceeding of the 2000 ASHRAE Winter Meeting, Dallas, 5-9 February 2000. [11] K. H. Kien, “Human Thermal Comfort,” MSC Thesis, Mississippi State University, Starkville, 2001. [12] S. M. Robaa, “Urban-Suburban/Rural Differences over Greater Cairo, Egypt,” International Journal of Atmos- fera, Vol. 16, No. 3, 2003, pp. 157-171. [13] J. Spagnolo, R. de Dear, “A Field Study of Thermal Comfort in Outdoor and Semi-Outdoor Environments in Subtropical Sydney Australia,” Building and Environ- ment, Vol. 38, No. 5, 2003, pp. 721-738. doi:10.1016/S0360-1323(02)00209-3 [14] B. Givoni, “Urban Design in Different Climates,” World Meteorological Organization, 1989. [15] B. Givoni, “Man, Climate & Architecture,” 2nd Edition, Applied Science Publishers, Ltd., London, 1976, p. 483. [16] A. Kratzer, “Das Stadtklima,” Wieweg and Sohn, Bra- unschweig, 1956, p. 184. [17] S. Nieuwolt, “The Urban Microclimate of Singapore,” Copyright © 2011 SciRes. ACS 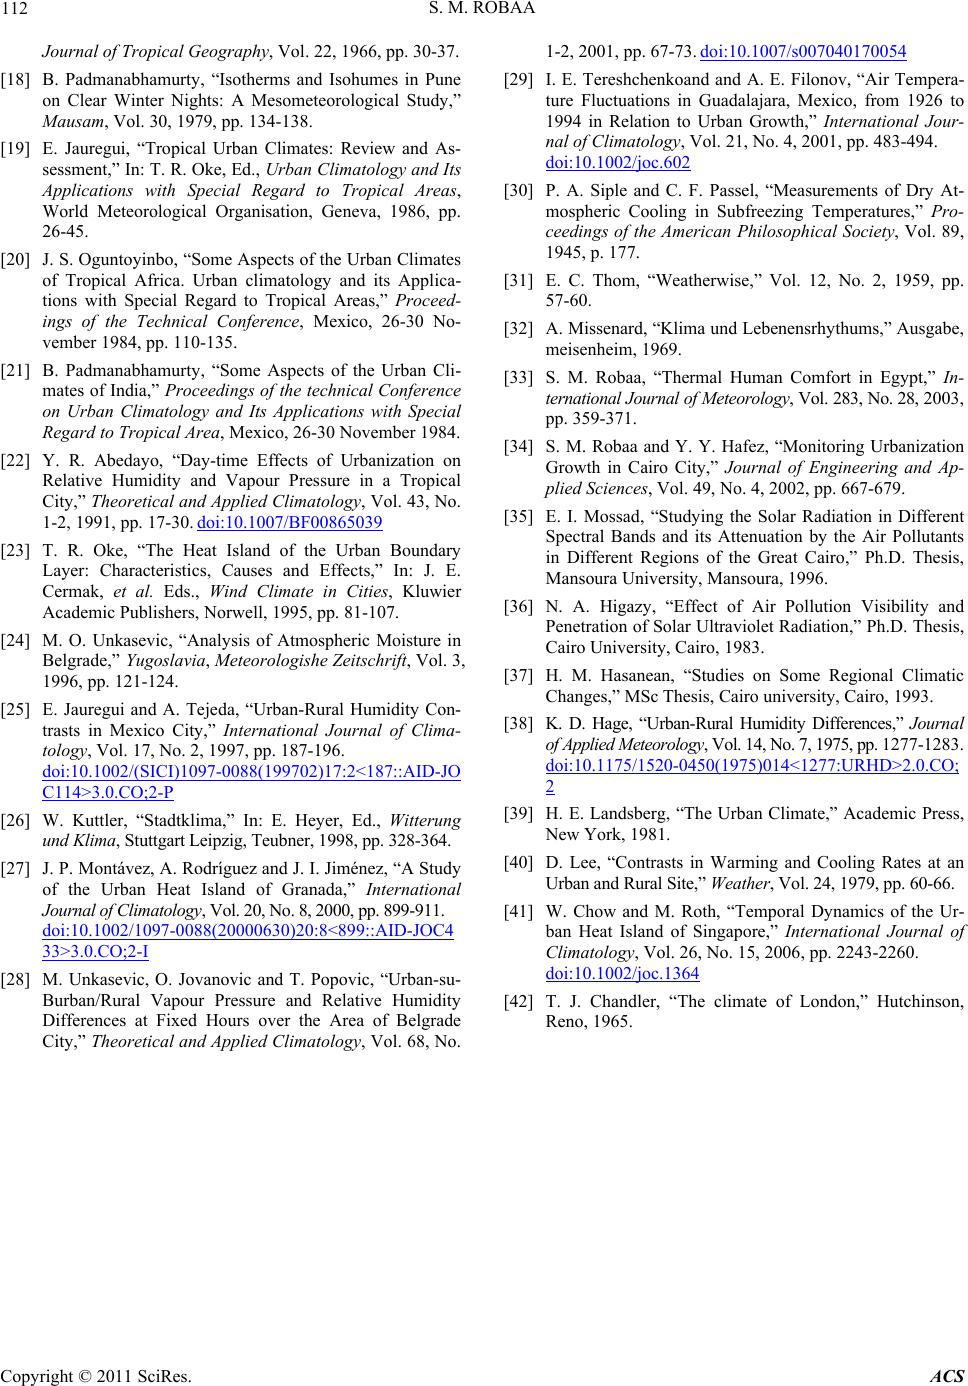 S. M. ROBAA Copyright © 2011 SciRes. ACS 112 Journal of Tropical Geography, Vol. 22, 1966, pp. 30-37. [18] B. Padmanabhamurty, “Isotherms and Isohumes in Pune on Clear Winter Nights: A Mesometeorological Study,” Mausam, Vol. 30, 1979, pp. 134-138. [19] E. Jauregui, “Tropical Urban Climates: Review and As- sessment,” In: T. R. Oke, Ed., Urban Climatology and Its Applications with Special Regard to Tropical Areas, World Meteorological Organisation, Geneva, 1986, pp. 26-45. [20] J. S. Oguntoyinbo, “Some Aspects of the Urban Climates of Tropical Africa. Urban climatology and its Applica- tions with Special Regard to Tropical Areas,” Proceed- ings of the Technical Conference, Mexico, 26-30 No- vember 1984, pp. 110-135. [21] B. Padmanabhamurty, “Some Aspects of the Urban Cli- mates of India,” Proceedings of the technical Conference on Urban Climatology and Its Applications with Special Regard to Tropical Area, Mexico, 26-30 November 1984. [22] Y. R. Abedayo, “Day-time Effects of Urbanization on Relative Humidity and Vapour Pressure in a Tropical City,” Theoretical and Applied Climatology, Vol. 43, No. 1-2, 1991, pp. 17-30. doi:10.1007/BF00865039 [23] T. R. Oke, “The Heat Island of the Urban Boundary Layer: Characteristics, Causes and Effects,” In: J. E. Cermak, et al. Eds., Wind Climate in Cities, Kluwier Academic Publishers, Norwell, 1995, pp. 81-107. [24] M. O. Unkasevic, “Analysis of Atmospheric Moisture in Belgrade,” Yugoslavia, Meteorologishe Zeitschrift, Vol. 3, 1996, pp. 121-124. [25] E. Jauregui and A. Tejeda, “Urban-Rural Humidity Con- trasts in Mexico City,” International Journal of Clima- tology, Vol. 17, No. 2, 1997, pp. 187-196. doi:10.1002/(SICI)1097-0088(199702)17:2<187::AID-JO C114>3.0.CO;2-P [26] W. Kuttler, “Stadtklima,” In: E. Heyer, Ed., Witterung und Klima, Stuttgart Leipzig, Teubner, 1998, pp. 328-364. [27] J. P. Montávez, A. Rodríguez and J. I. Jiménez, “A Study of the Urban Heat Island of Granada,” International Journal of Clima tology, Vol. 20, No. 8, 2000, pp. 899-911. doi:10.1002/1097-0088(20000630)20:8<899::AID-JOC4 33>3.0.CO;2-I [28] M. Unkasevic, O. Jovanovic and T. Popovic, “Urban-su- Burban/Rural Vapour Pressure and Relative Humidity Differences at Fixed Hours over the Area of Belgrade City,” Theoretical and Applied Climatology, Vol. 68, No. 1-2, 2001, pp. 67-73. doi:10.1007/s007040170054 [29] I. E. Tereshchenkoand and A. E. Filonov, “Air Tempera- ture Fluctuations in Guadalajara, Mexico, from 1926 to 1994 in Relation to Urban Growth,” International Jour- nal of Climatology, Vol. 21, No. 4, 2001, pp. 483-494. doi:10.1002/joc.602 [30] P. A. Siple and C. F. Passel, “Measurements of Dry At- mospheric Cooling in Subfreezing Temperatures,” Pro- ceedings of the American Philosophical Society, Vol. 89, 1945, p. 177. [31] E. C. Thom, “Weatherwise,” Vol. 12, No. 2, 1959, pp. 57-60. [32] A. Missenard, “Klima und Lebenensrhythums,” Ausgabe, meisenheim, 1969. [33] S. M. Robaa, “Thermal Human Comfort in Egypt,” In- ternational Journal of Meteorology, Vol. 283, No. 28, 2003, pp. 359-371. [34] S. M. Robaa and Y. Y. Hafez, “Monitoring Urbanization Growth in Cairo City,” Journal of Engineering and Ap- plied Sciences, Vol. 49, No. 4, 2002, pp. 667-679. [35] E. I. Mossad, “Studying the Solar Radiation in Different Spectral Bands and its Attenuation by the Air Pollutants in Different Regions of the Great Cairo,” Ph.D. Thesis, Mansoura University, Mansoura, 1996. [36] N. A. Higazy, “Effect of Air Pollution Visibility and Penetration of Solar Ultraviolet Radiation,” Ph.D. Thesis, Cairo University, Cairo, 1983. [37] H. M. Hasanean, “Studies on Some Regional Climatic Changes,” MSc Thesis, Cairo university, Cairo, 1993. [38] K. D. Hage, “Urban-Rural Humidity Differences,” Journal of Applied Meteorology, Vol. 14, No. 7, 1975, pp. 1277-1283. doi:10.1175/1520-0450(1975)014<1277:URHD>2.0.CO; 2 [39] H. E. Landsberg, “The Urban Climate,” Academic Press, New York, 1981. [40] D. Lee, “Contrasts in Warming and Cooling Rates at an Urban and Rural Site,” Weather, Vol. 24, 1979, pp. 60-66. [41] W. Chow and M. Roth, “Temporal Dynamics of the Ur- ban Heat Island of Singapore,” International Journal of Climatology, Vol. 26, No. 15, 2006, pp. 2243-2260. doi:10.1002/joc.1364 [42] T. J. Chandler, “The climate of London,” Hutchinson, Reno, 1965.
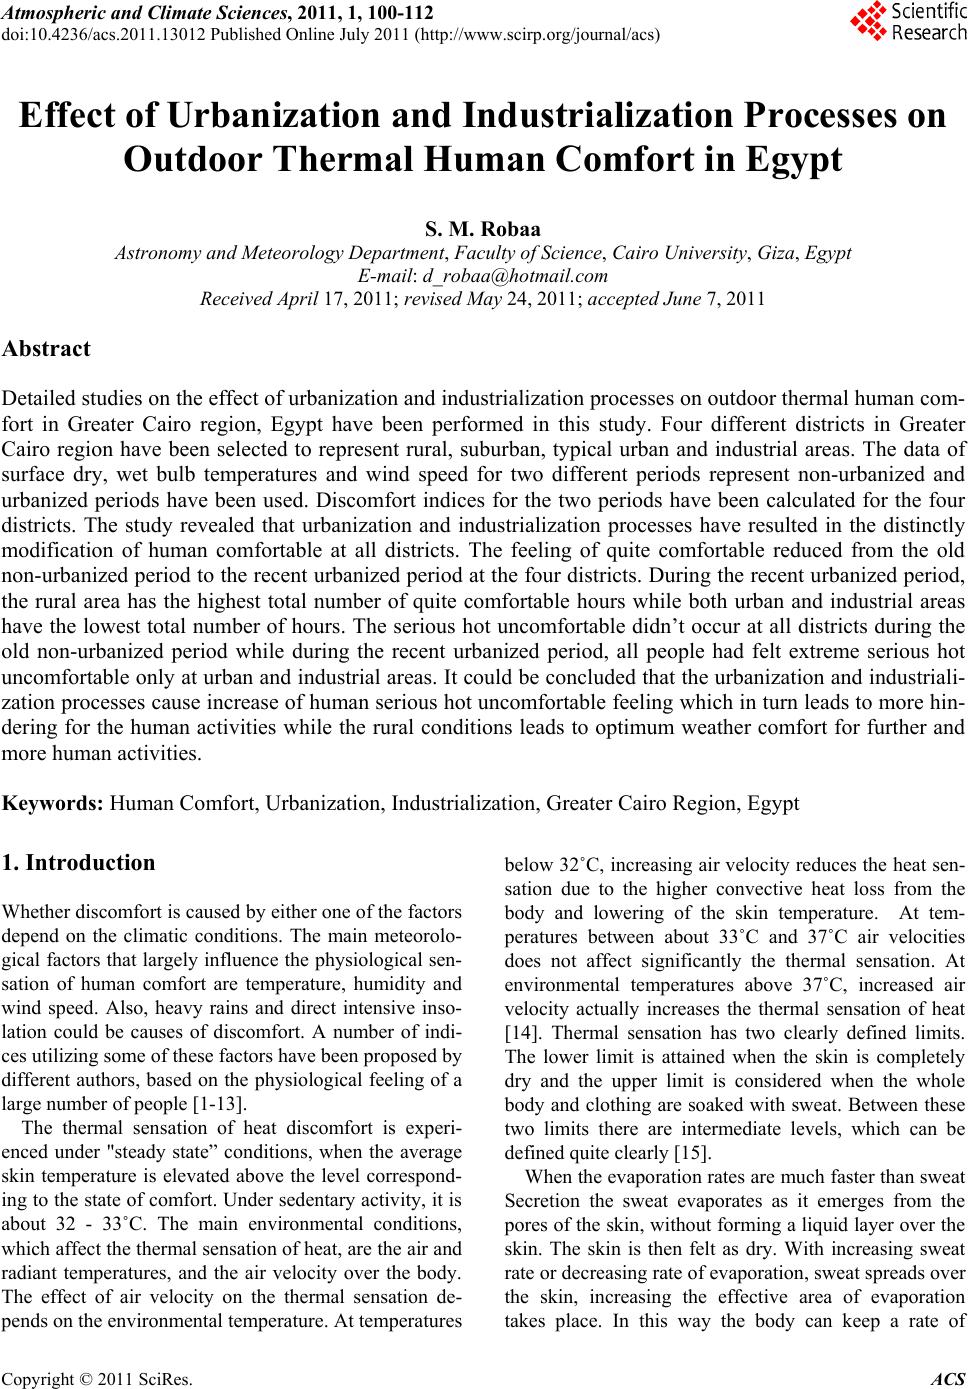
|